


What is the destination for your trading? Not your goals for this week, this month, this year. What is the vision for it all?
Dr. Brett Steenbarger spent four years at Tudor Investment Corporation and has worked with countless hedge fund managers since. At SMB Capital’s New York trading summit last month, he shared what he’s observed: those who dedicate a percentage of their profits to causes they deeply believe in transform their relationship with market speculation.
They’re inspired to trade well because the profits fund something meaningful. They stay disciplined because the cause matters more than any single position. And they hold better emotional balance because their identity isn’t tethered solely to market swings.
Dr. Steenbarger cites Paul Tudor Jones as an example of this principle: a man trading not for a number on a screen, but for his Robin Hood Foundation. The foundation is the destination that pulls him forward—his vision for his trading.
You don’t need PTJ-level wealth to feel this pull.
My wife and I have a young family and an equally young nest egg. We both care deeply about our local community and the next generation being raised here.
A few times a year, we’ll find ourselves driving through town and spot a commercial space for lease. My wife, an entrepreneur in architectural design, begins painting a picture of what could be created to support the flourishing of the people we care about. I soundboard. We assemble a shortlist of collaborators who could bring the vision to life.
The timing isn’t today. But there’s a real sense that the day will arrive when we have the capacity to move on one of these visions—if not multiple. The trading desk feels different the next morning. My attention is less magnetized to the minutiae: to today’s action, to this week’s performance.
I return to process—one I know will persist indefinitely, and compound until we arrive at the day the resources and timing are no longer ahead of us, but at our feet.
This is all it takes. No philanthropic foundation. No WSJ headline.
Just a destination you truly care about, and can make out clearly enough to feel its pull.
A Rip-Roaring Rally
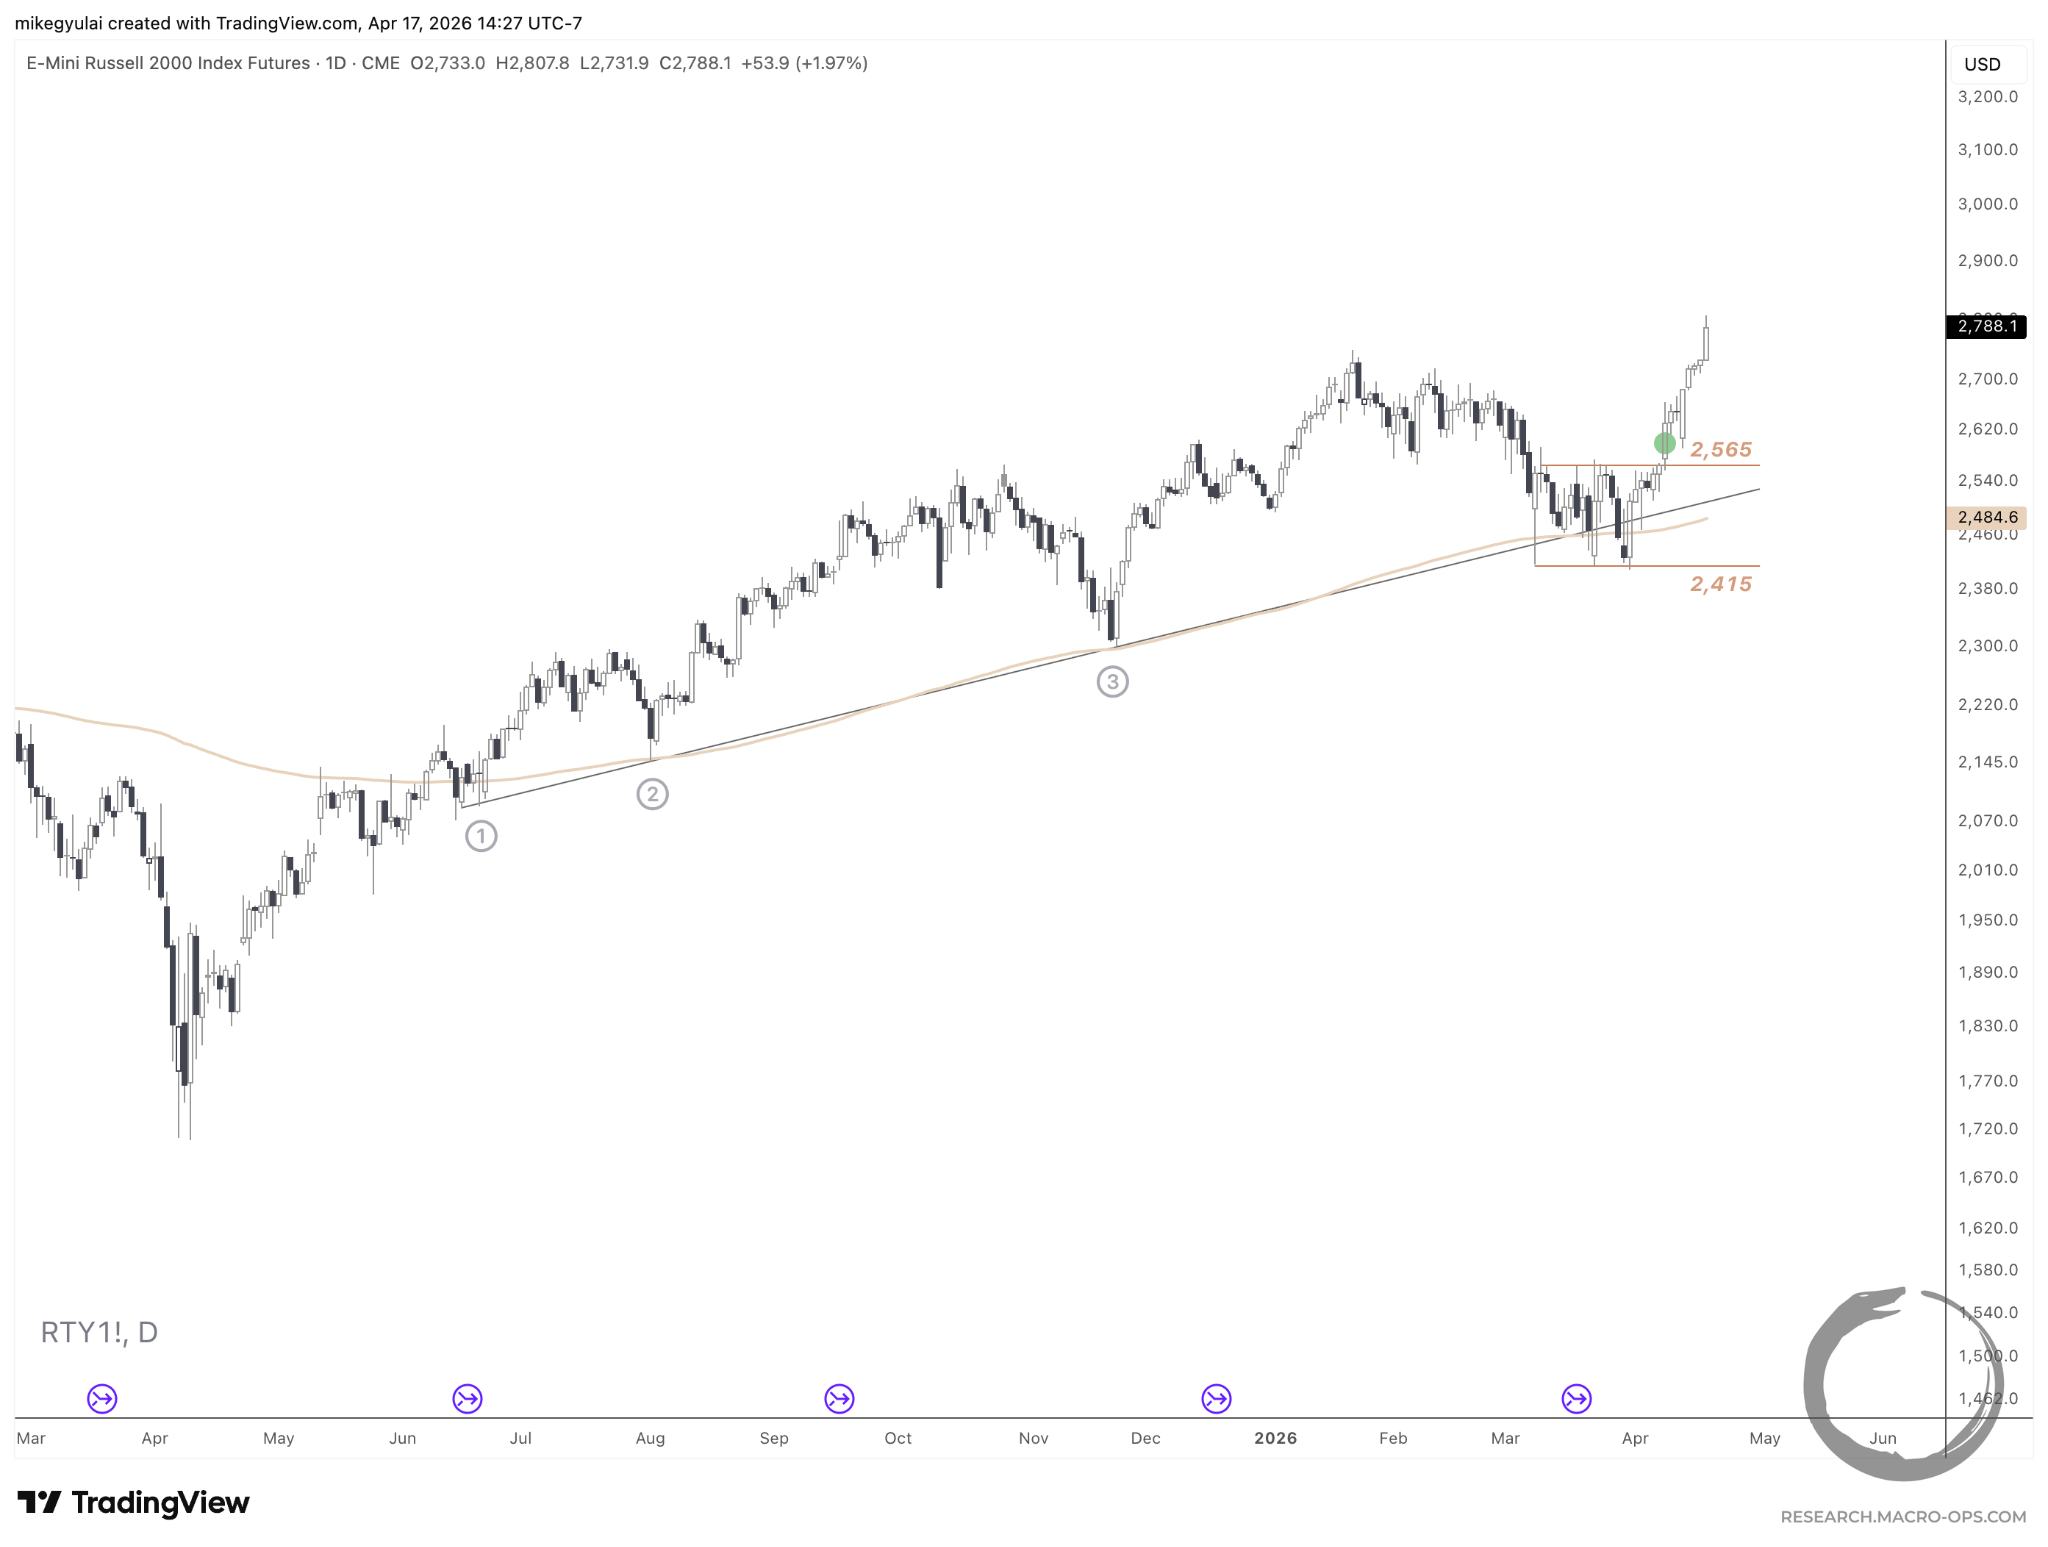
Two weeks ago, in the April 4, 2026 issue, I featured the “loose” markets of Crude Oil and the Nasdaq, and contrasted them to the “tight” price compression on the Russell. Shortly after, the Russell popped out of that range with our Macro Ops Portfolio positioned long.
Things looked pretty good last week when I wrote I’d be watching what would develop next—potentially a bear-market “Rounding Pattern” or a tight, low-volatility consolidation.
What we got was a hot knife through butter:
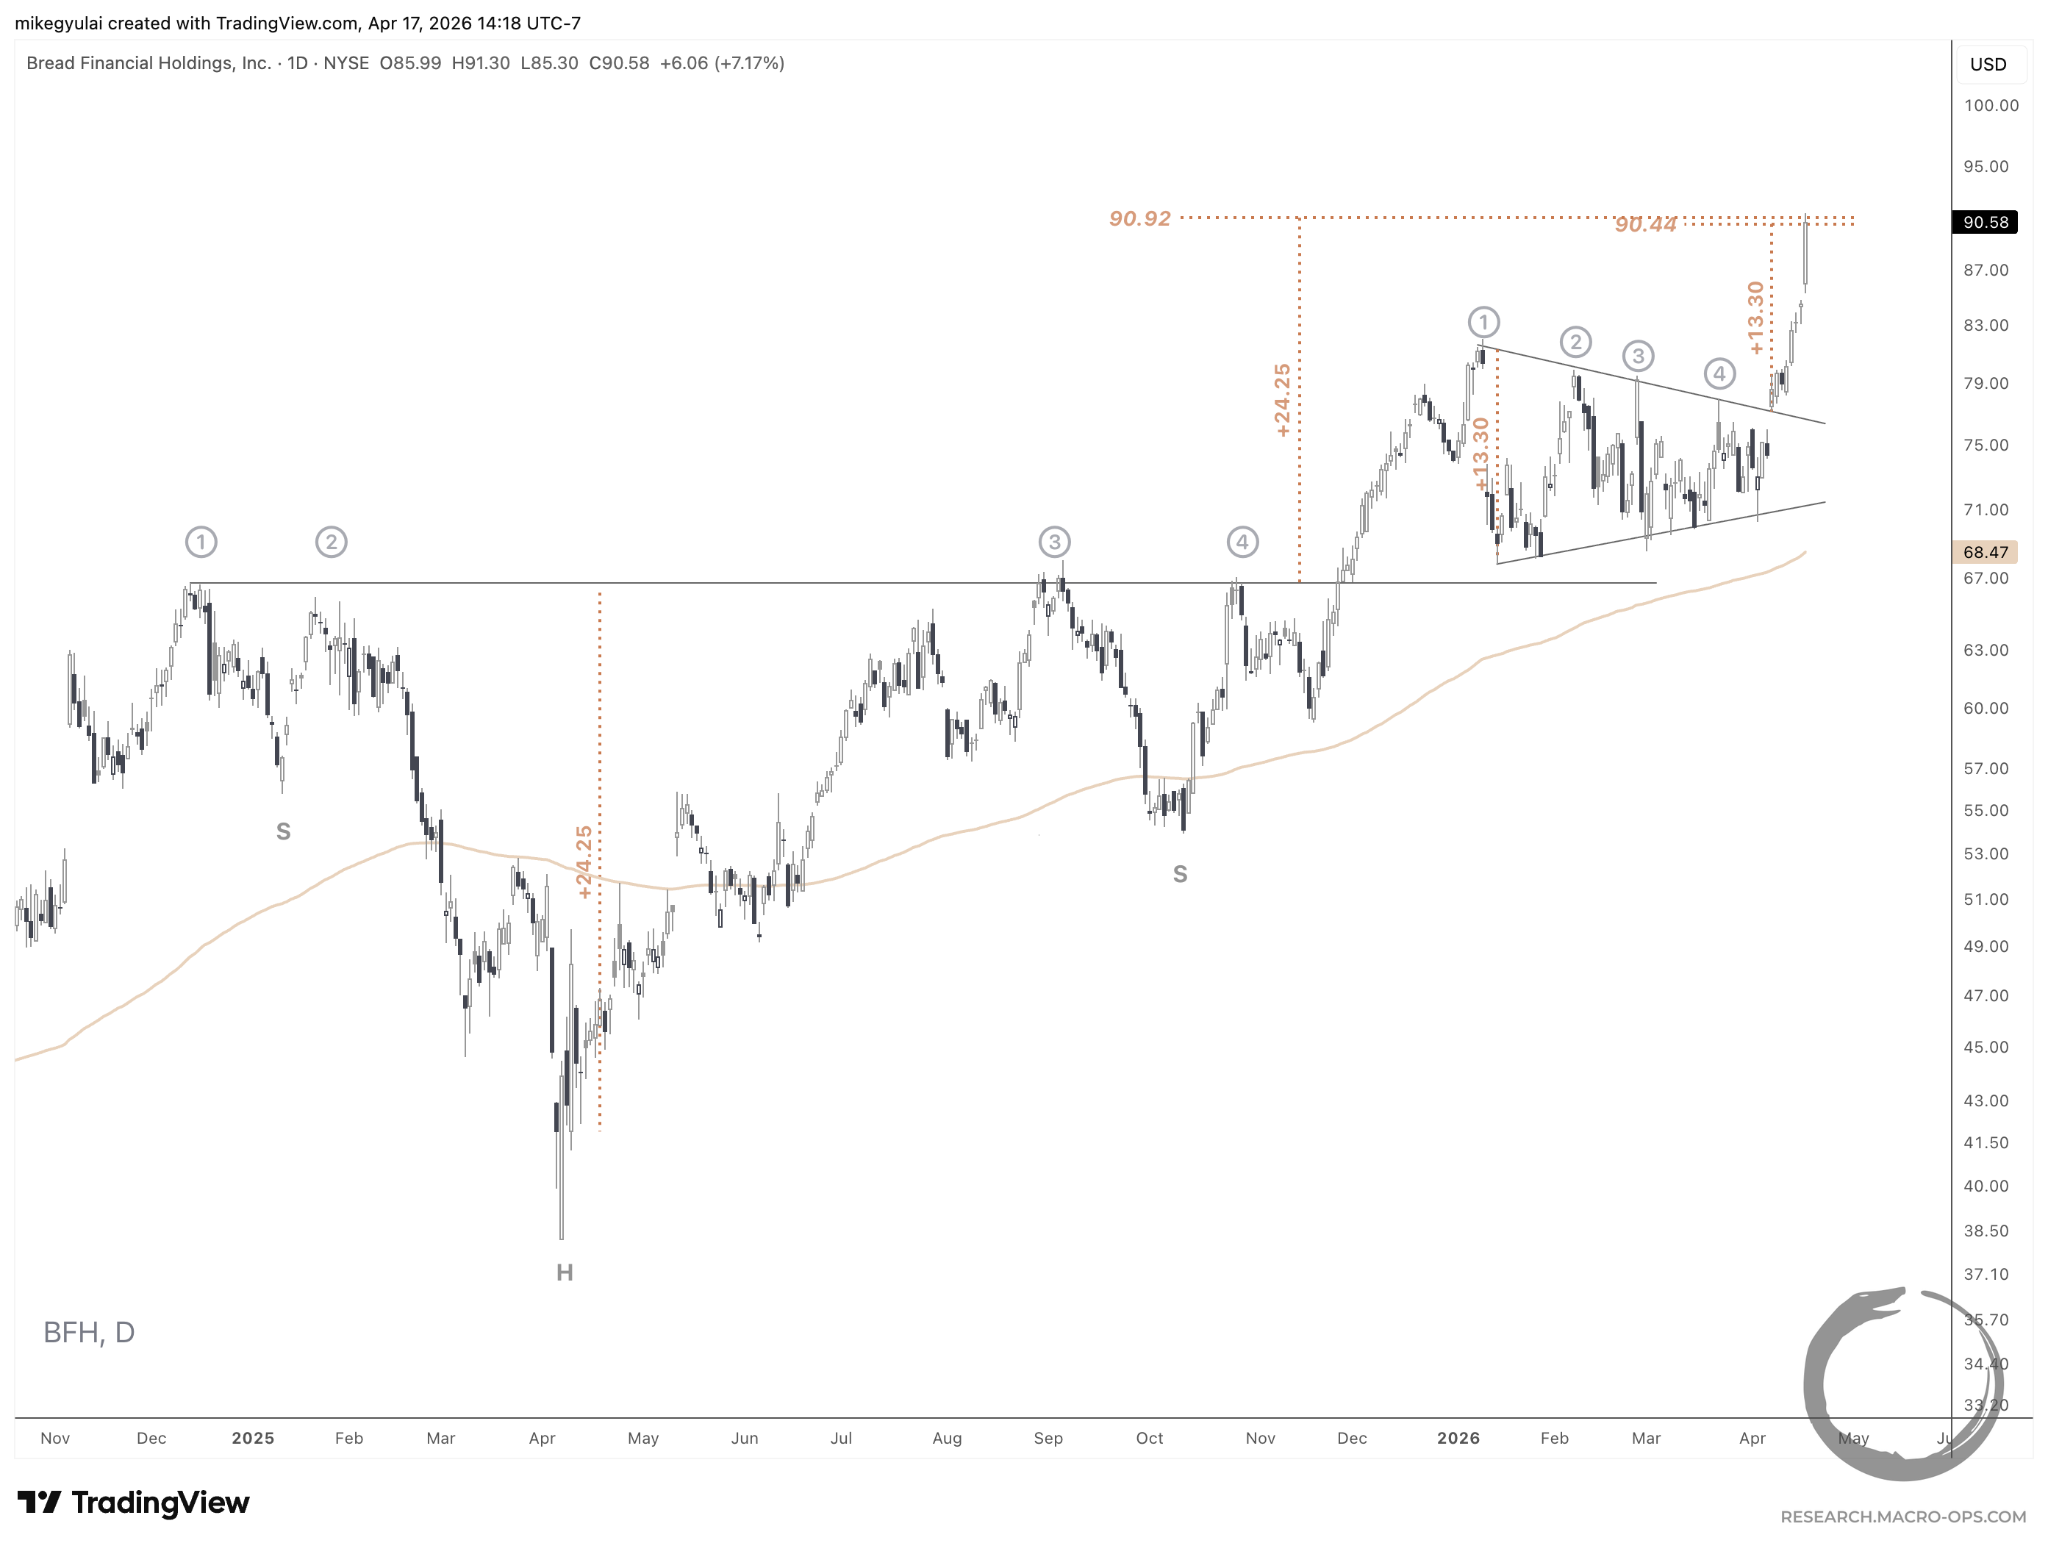
In that same April 4 issue, I covered three names that had exhibited notable relative strength in the face of all the turmoil.
Bread Financial Holdings has gone on to meet both its Head & Shoulders Continuation and Symmetrical Triangle 1X targets:
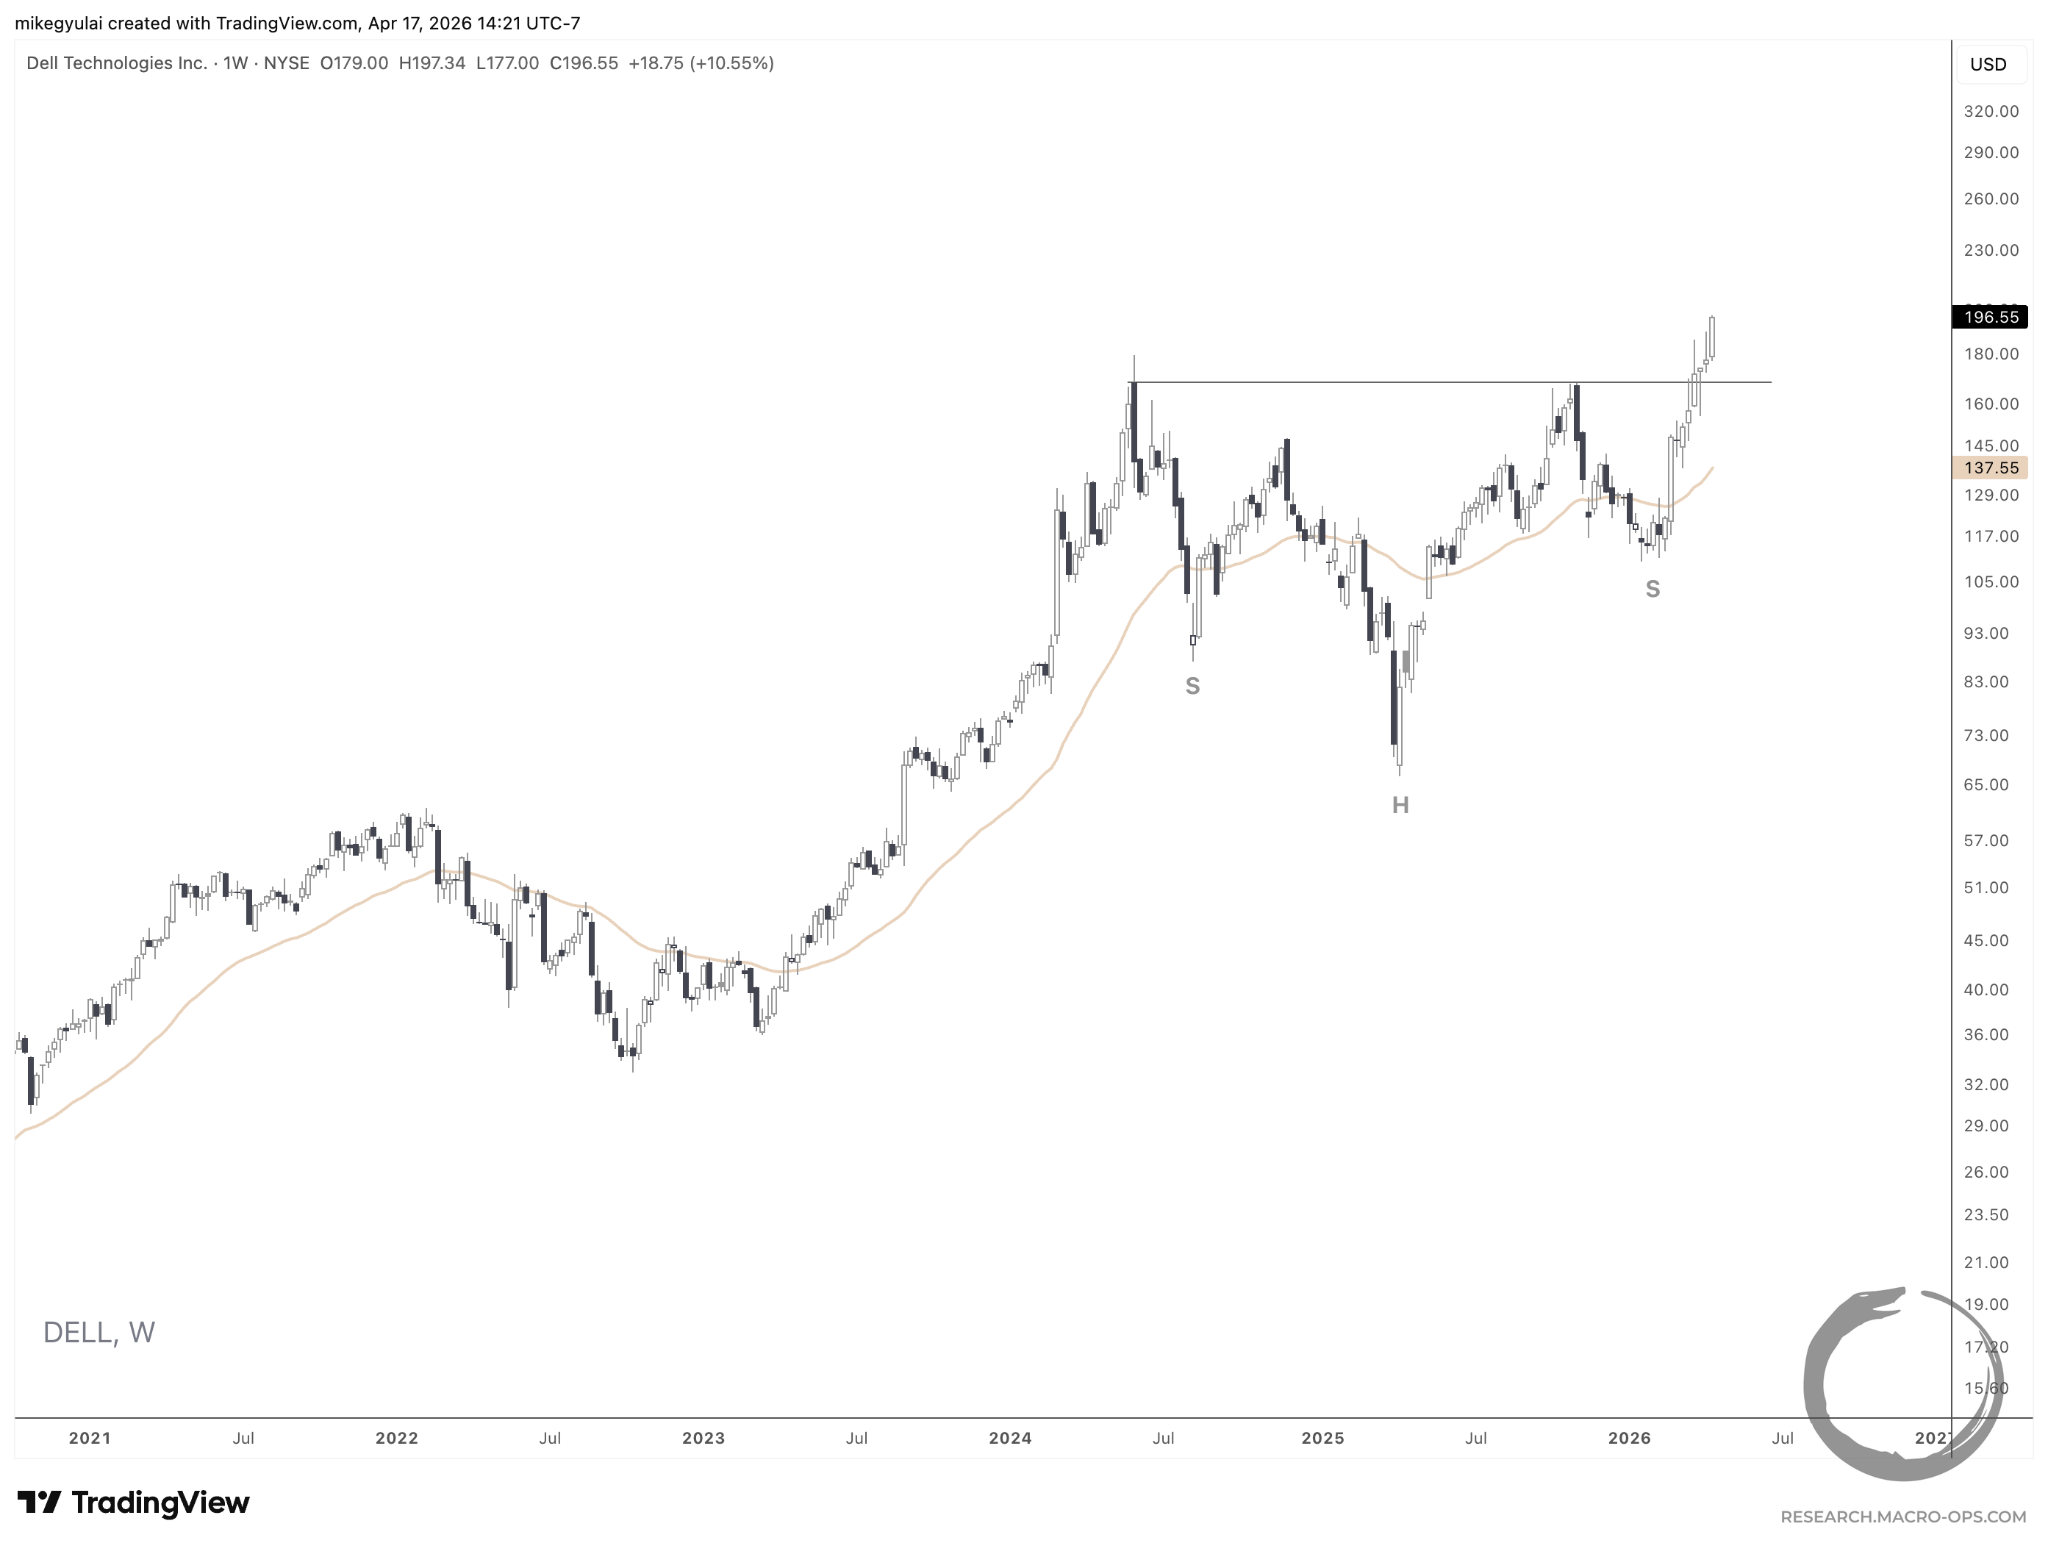
Dell encountered initial selling pressure but pushed into new All-Time Highs:
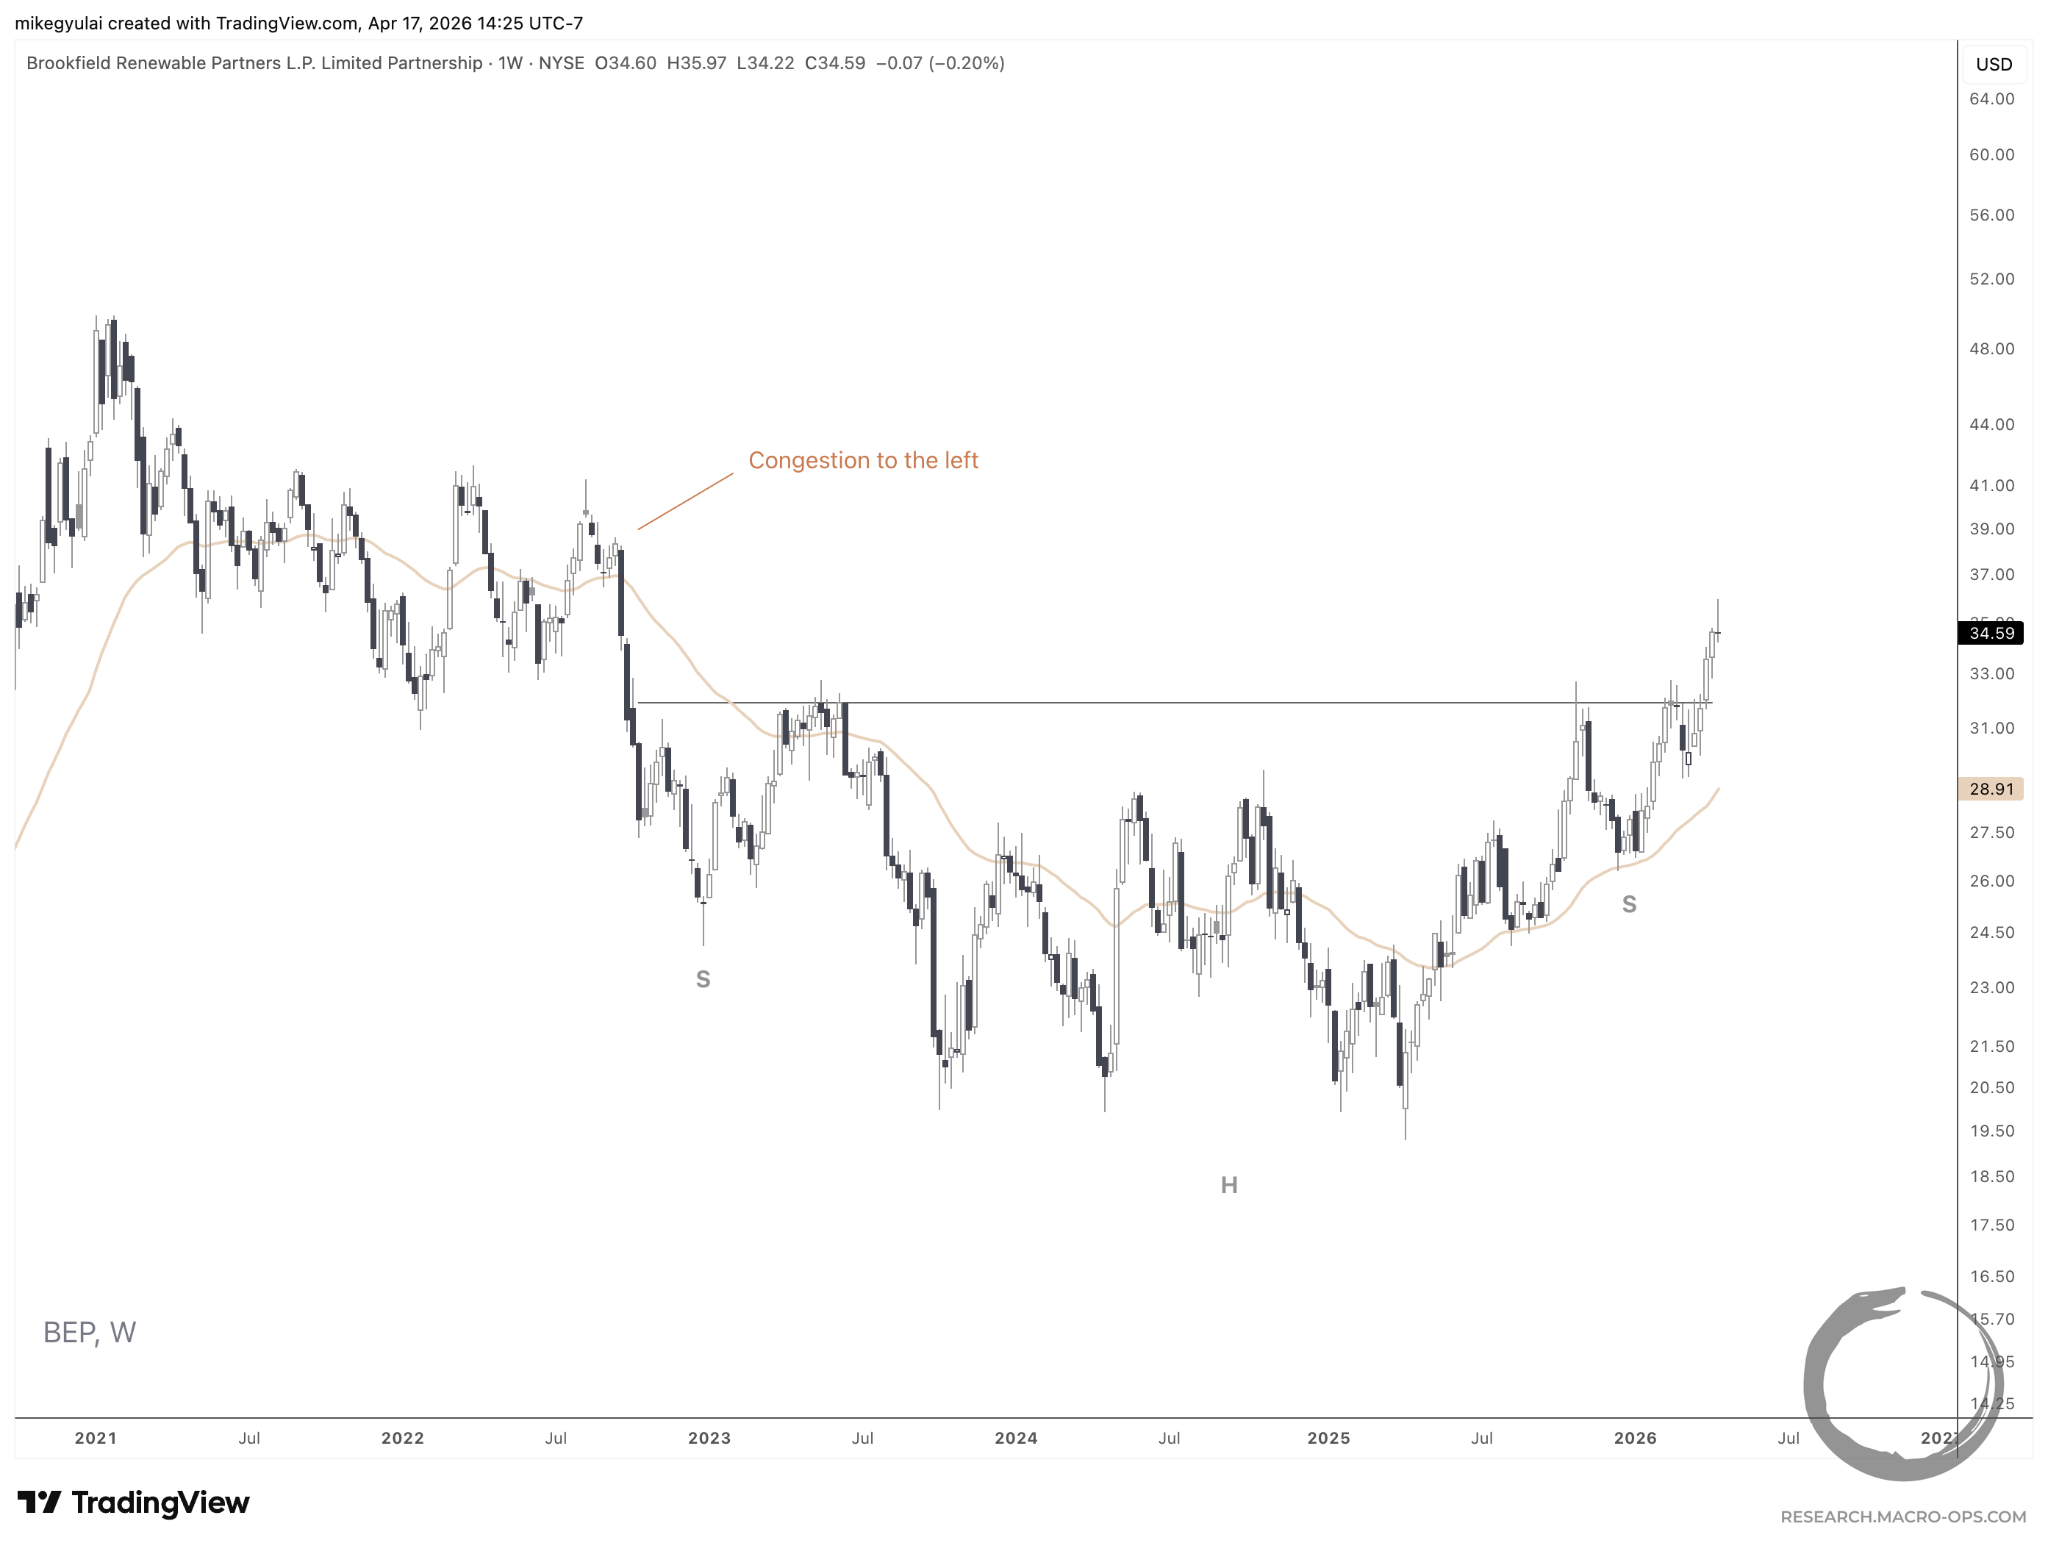
Brookfield Renewable Partners pulled away from its Cup & Handle Continuation boundary on the daily timeframe, which can act as a launching pattern completing the massive Head & Shoulders Bottom on the weekly timeframe:
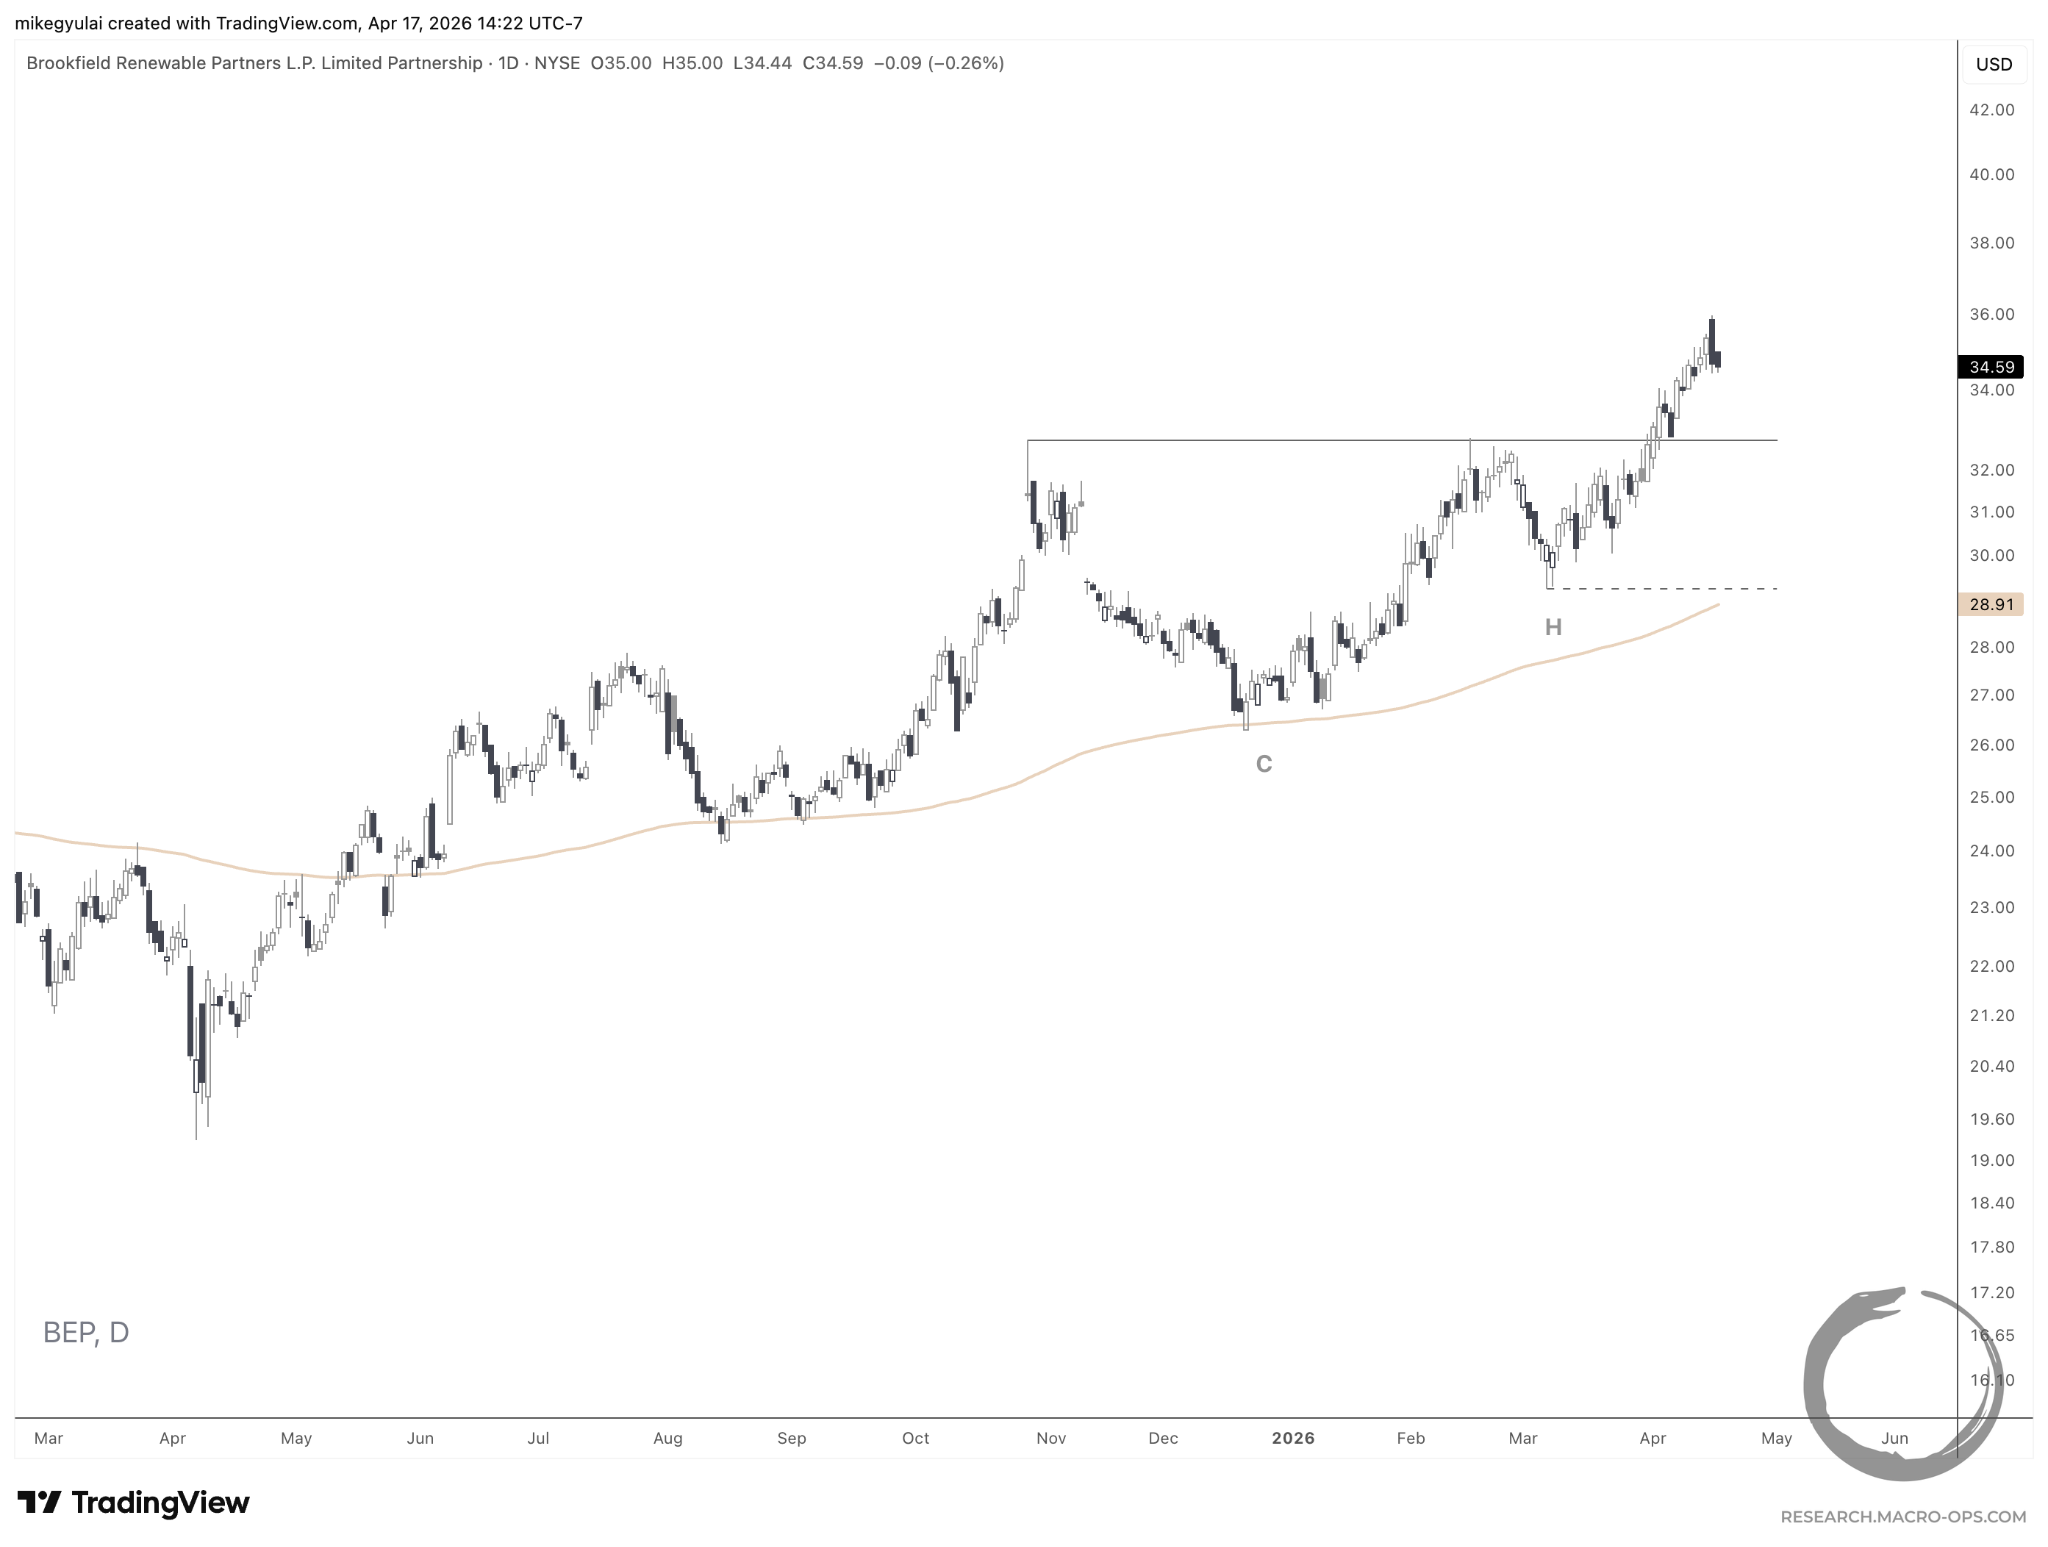
Of note: there is a boatload of overhead resistance to the left on the weekly chart:
Futures in Focus
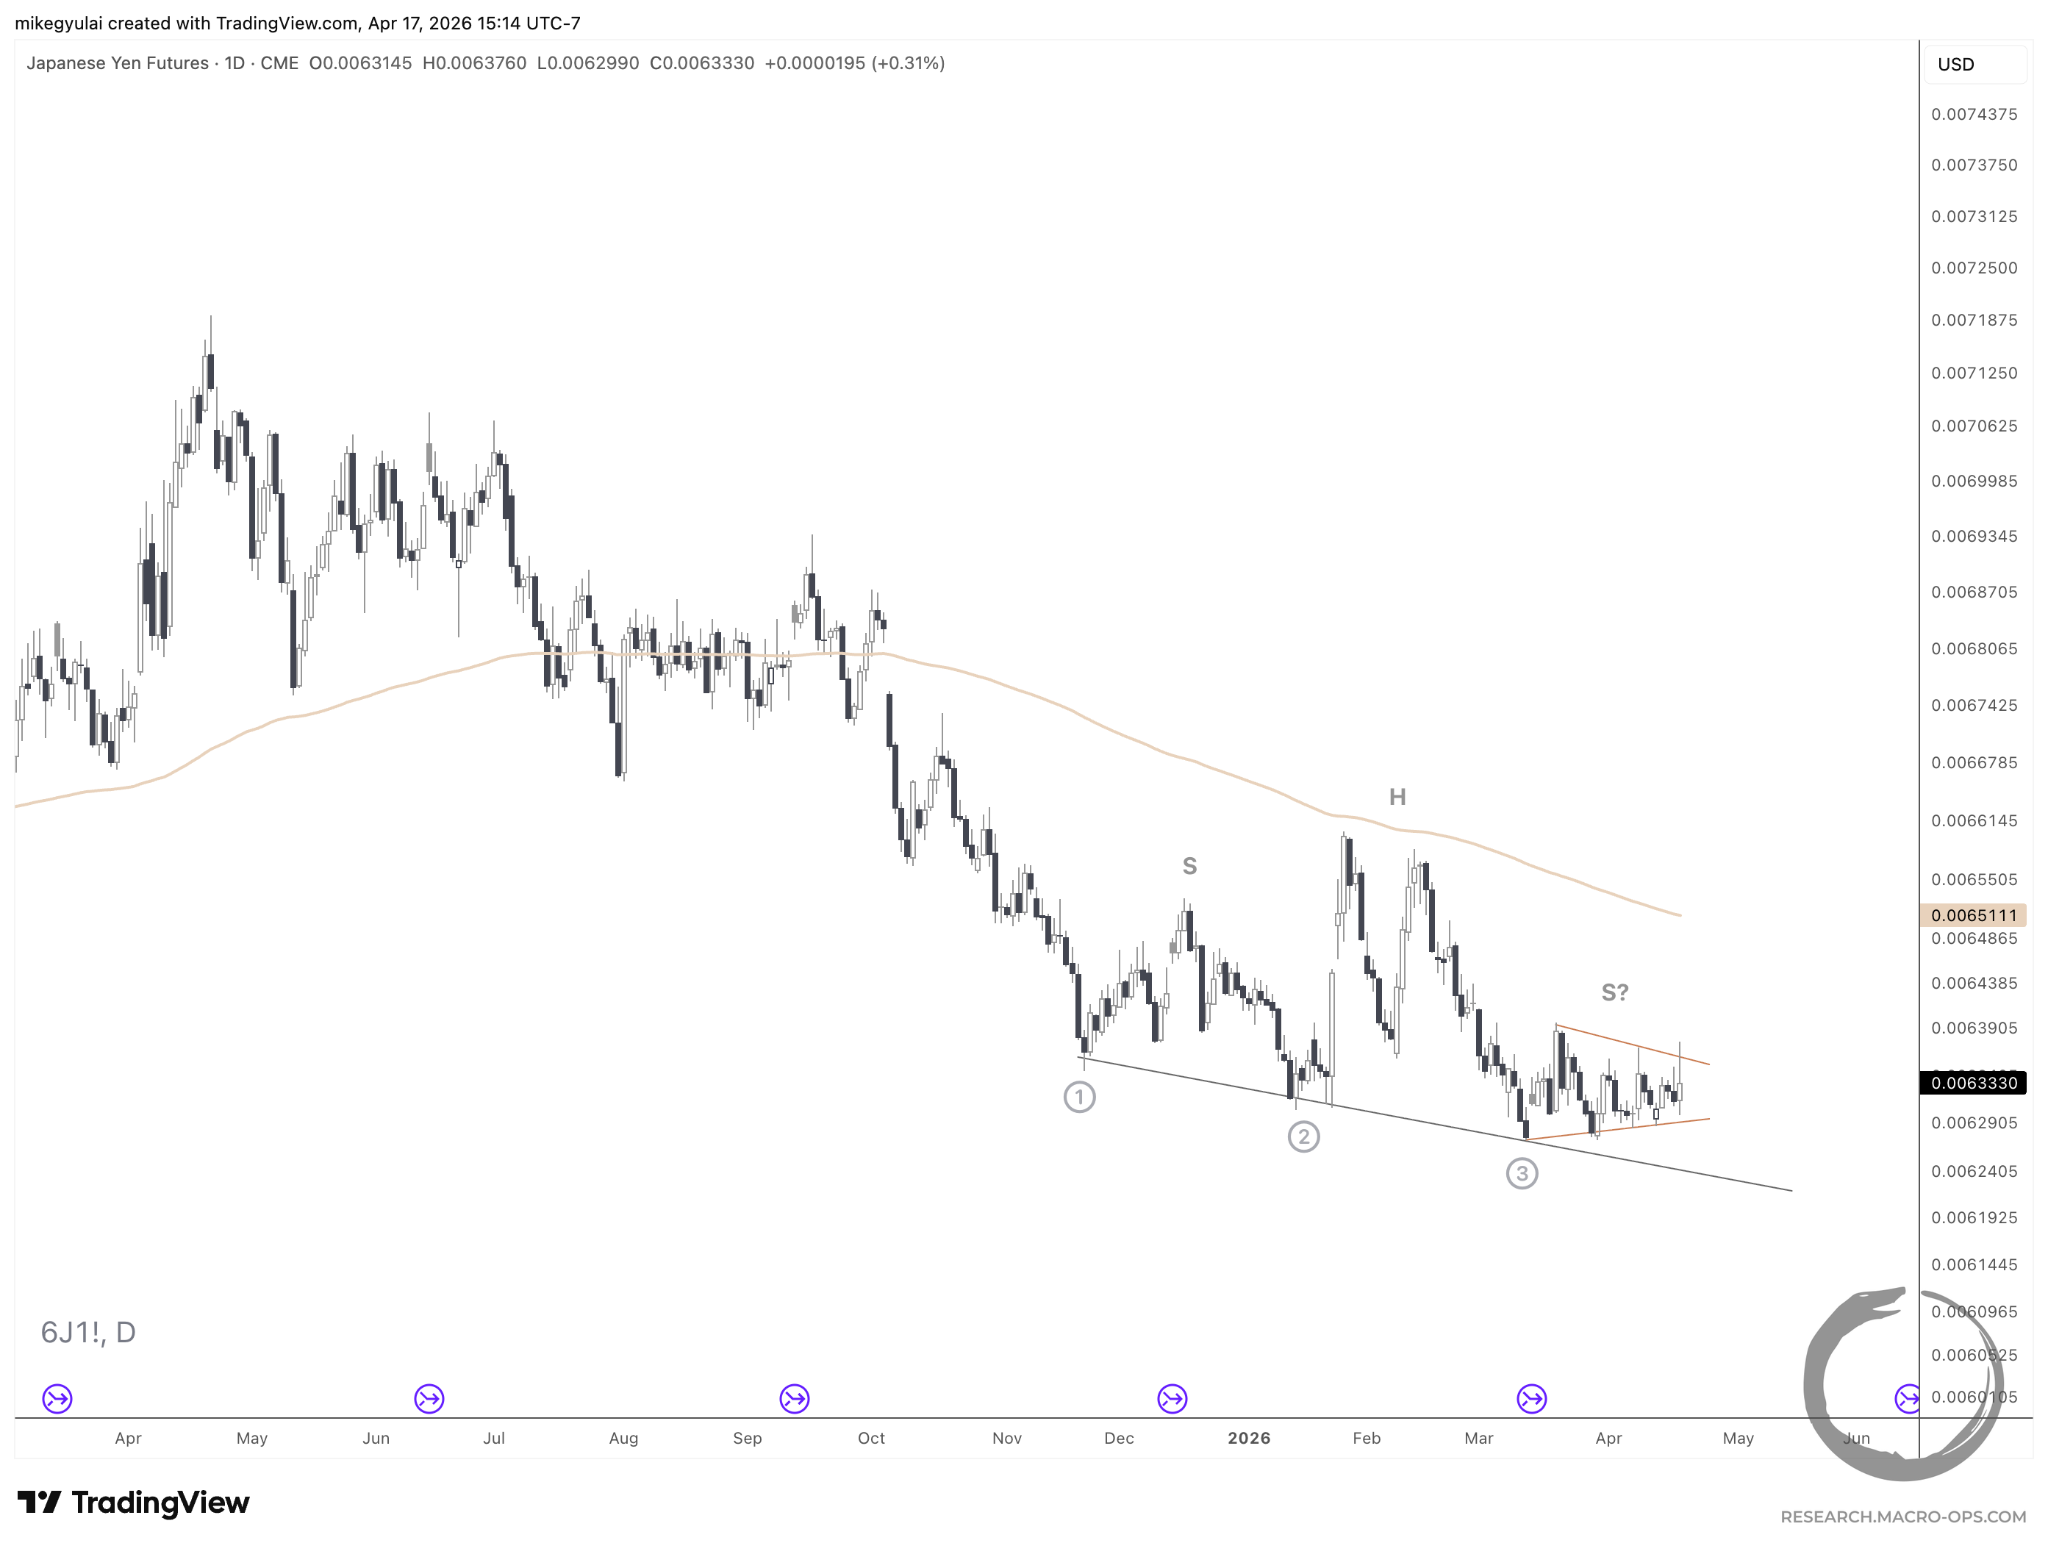
Japanese Yen Futures looked like they were forming a Head & Shoulders Continuation, but volatility is contracting above the neckline. It’s a small pattern with potential to break either direction.
I’ll be watching to see if the upper boundary can clean itself up (I’m not thrilled with boundaries defined more by wicks than closes).
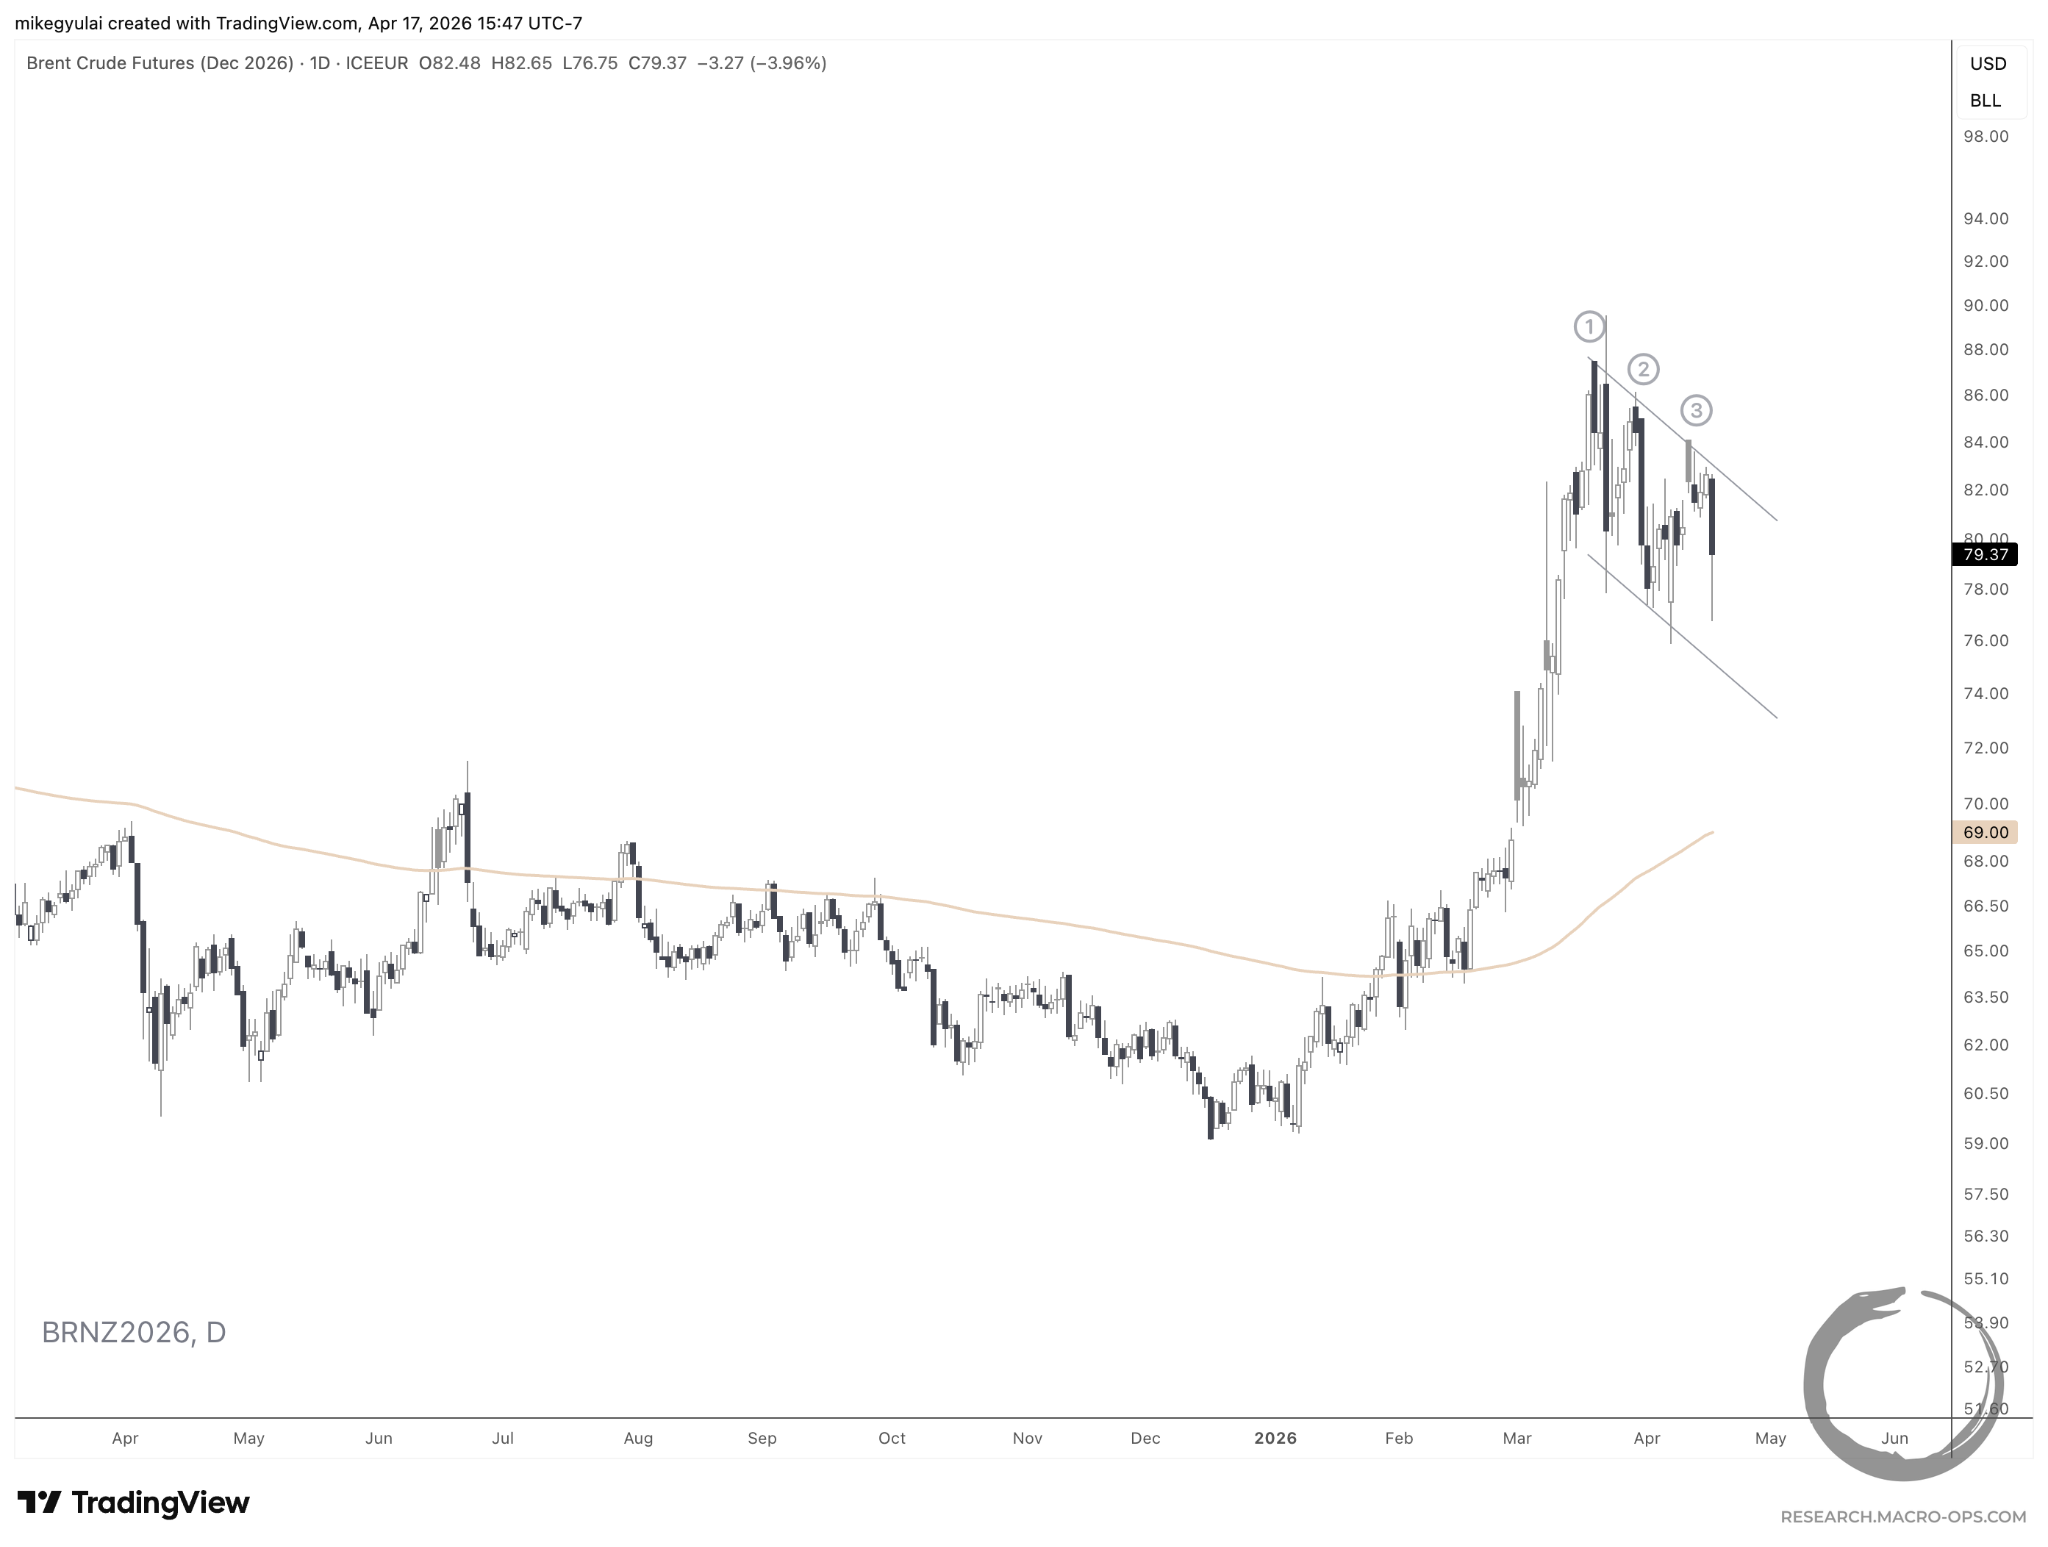
Brent Crude is flagging after the impulsive move up in energy. Brent Crude is a cleaner pattern than Light Crude if looking to play continuation in energy prices. December contract shown here.
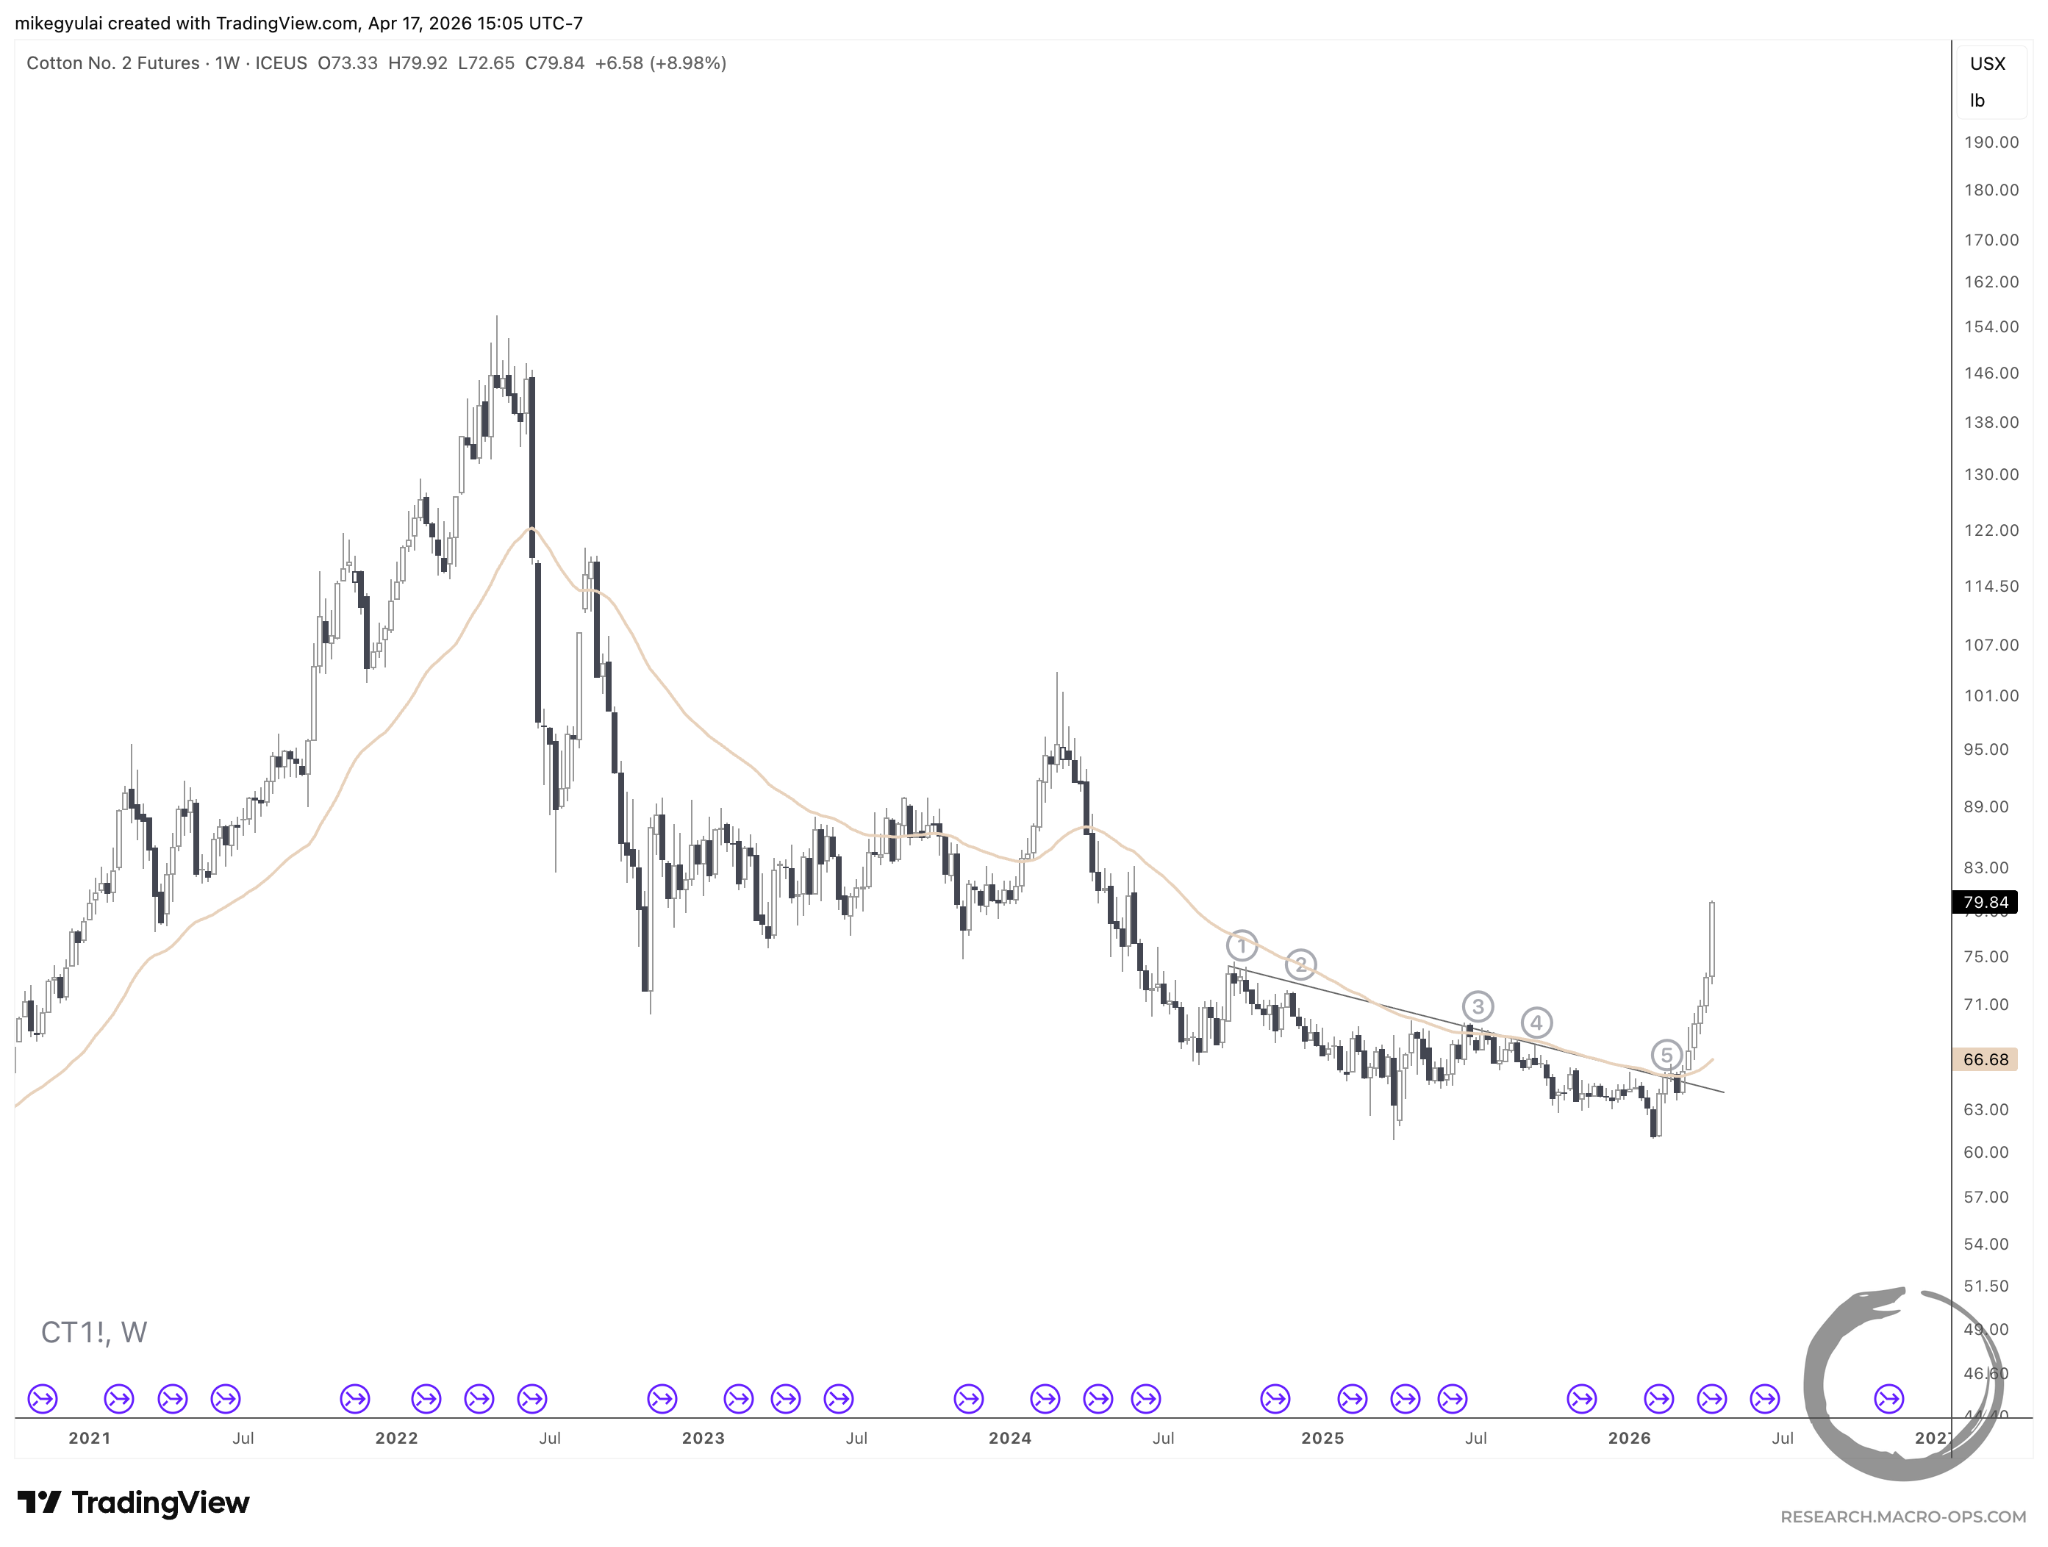
I’ve been following the breakout in Cotton since initiating work on my commodities playbook earlier this year. The March break of the Declining Channel on the May contract kicked off a huge rally.
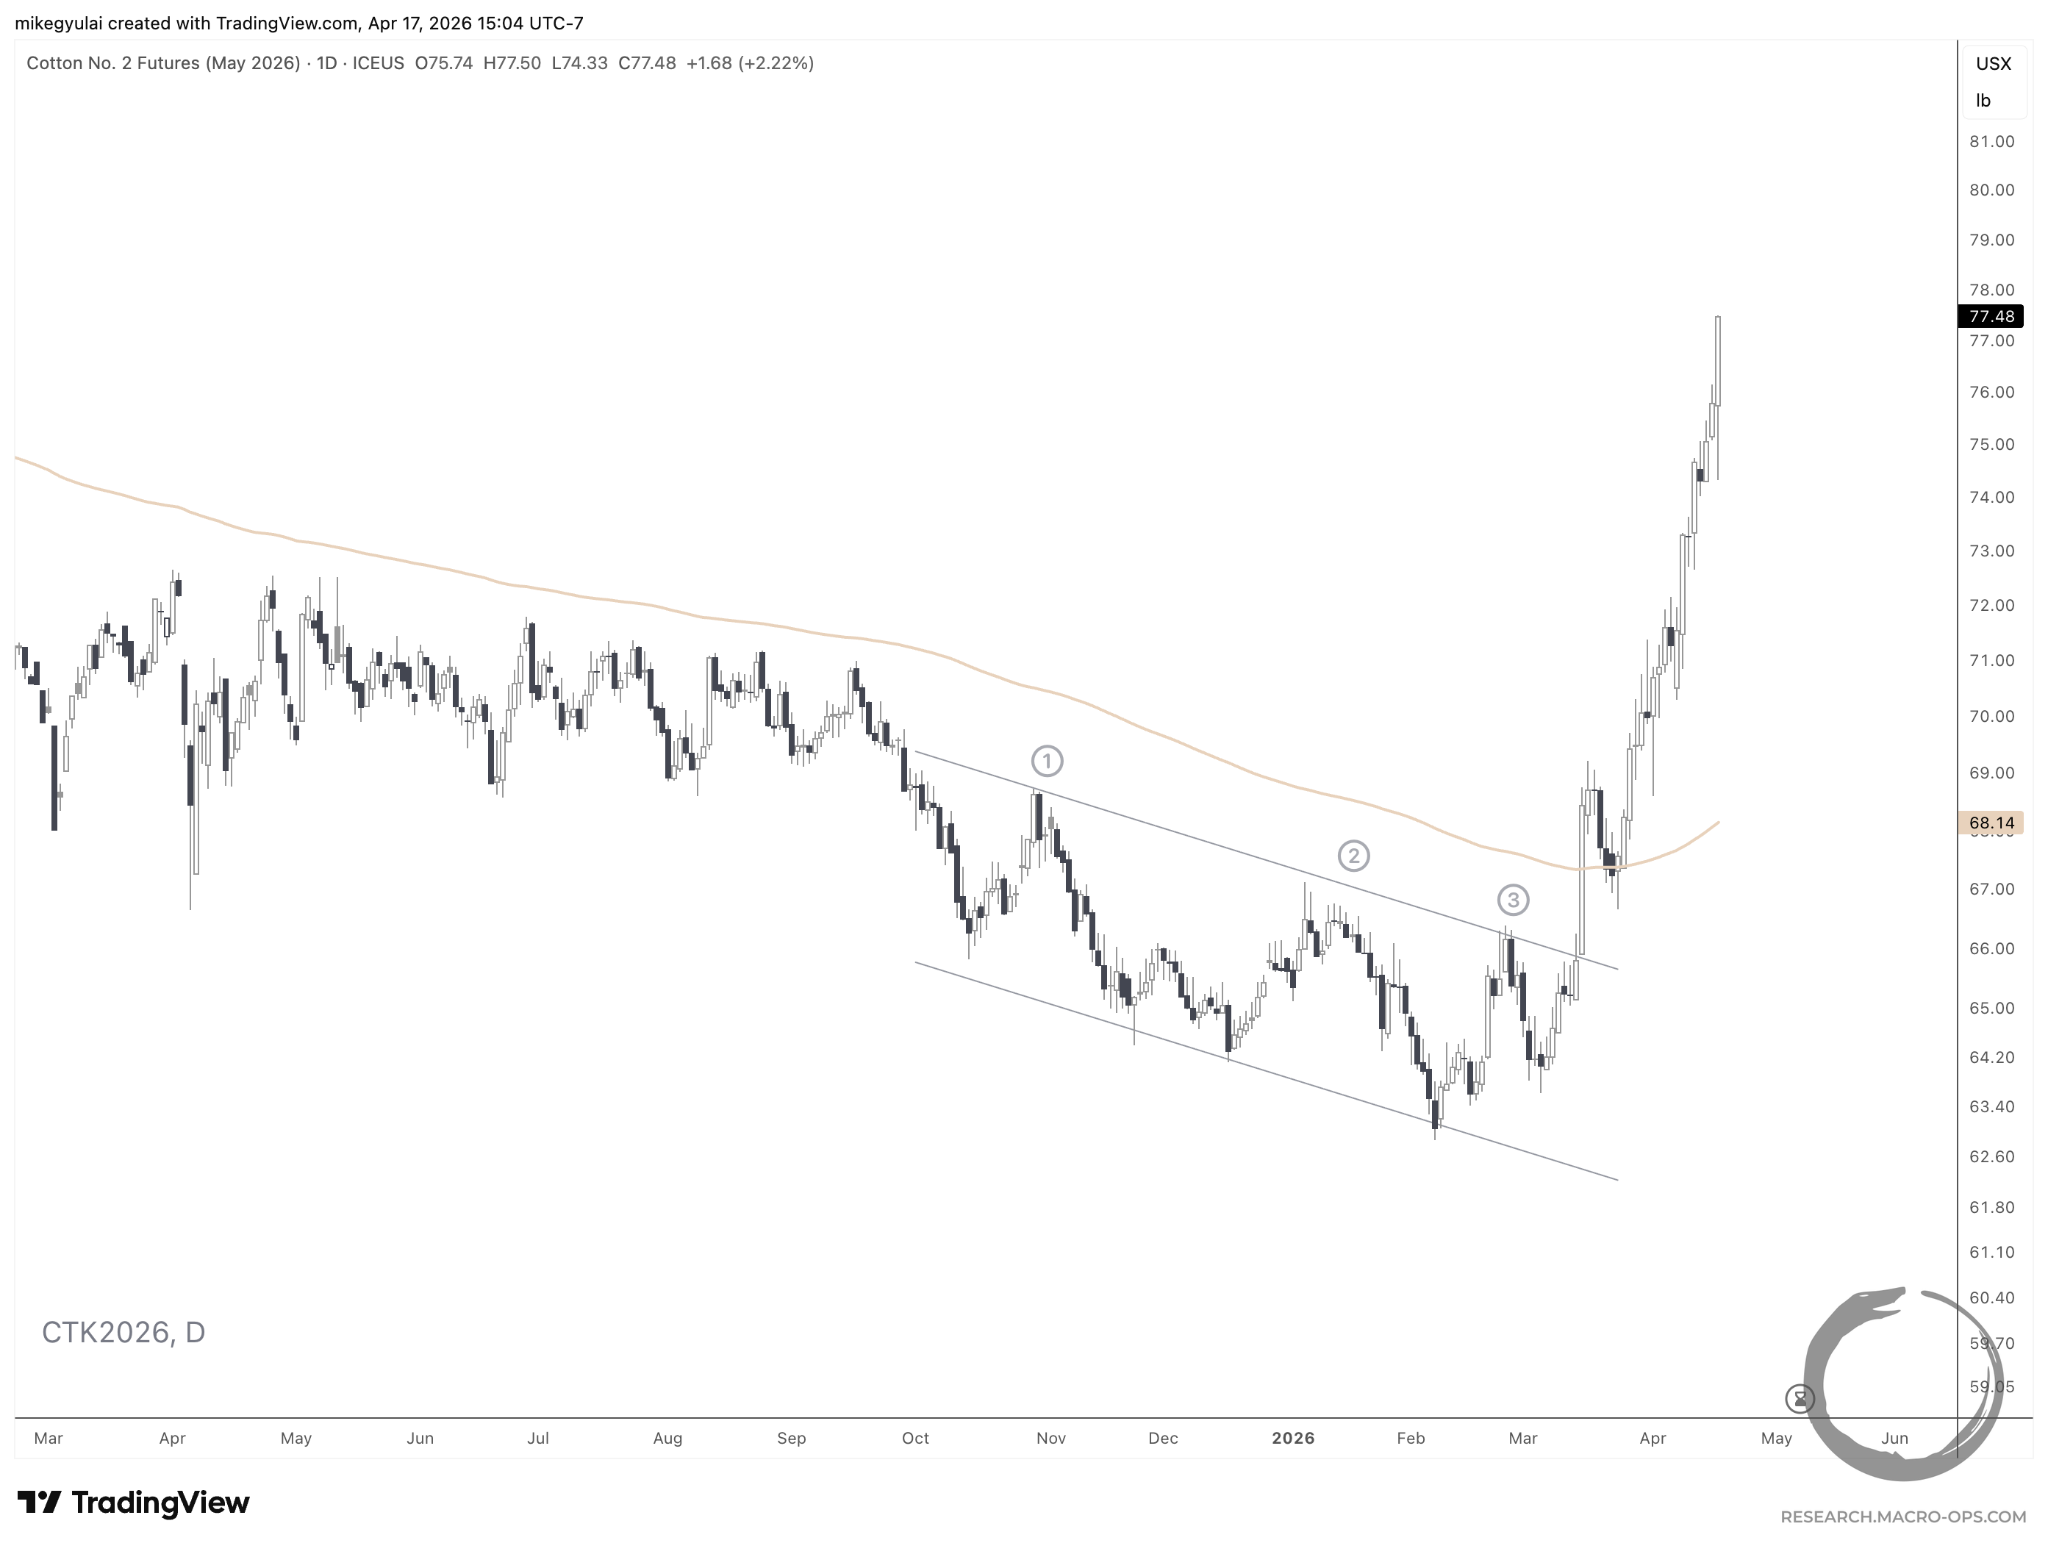
That breakout on the daily coincided with a breakout from a multi-month trendline on the continuation chart.
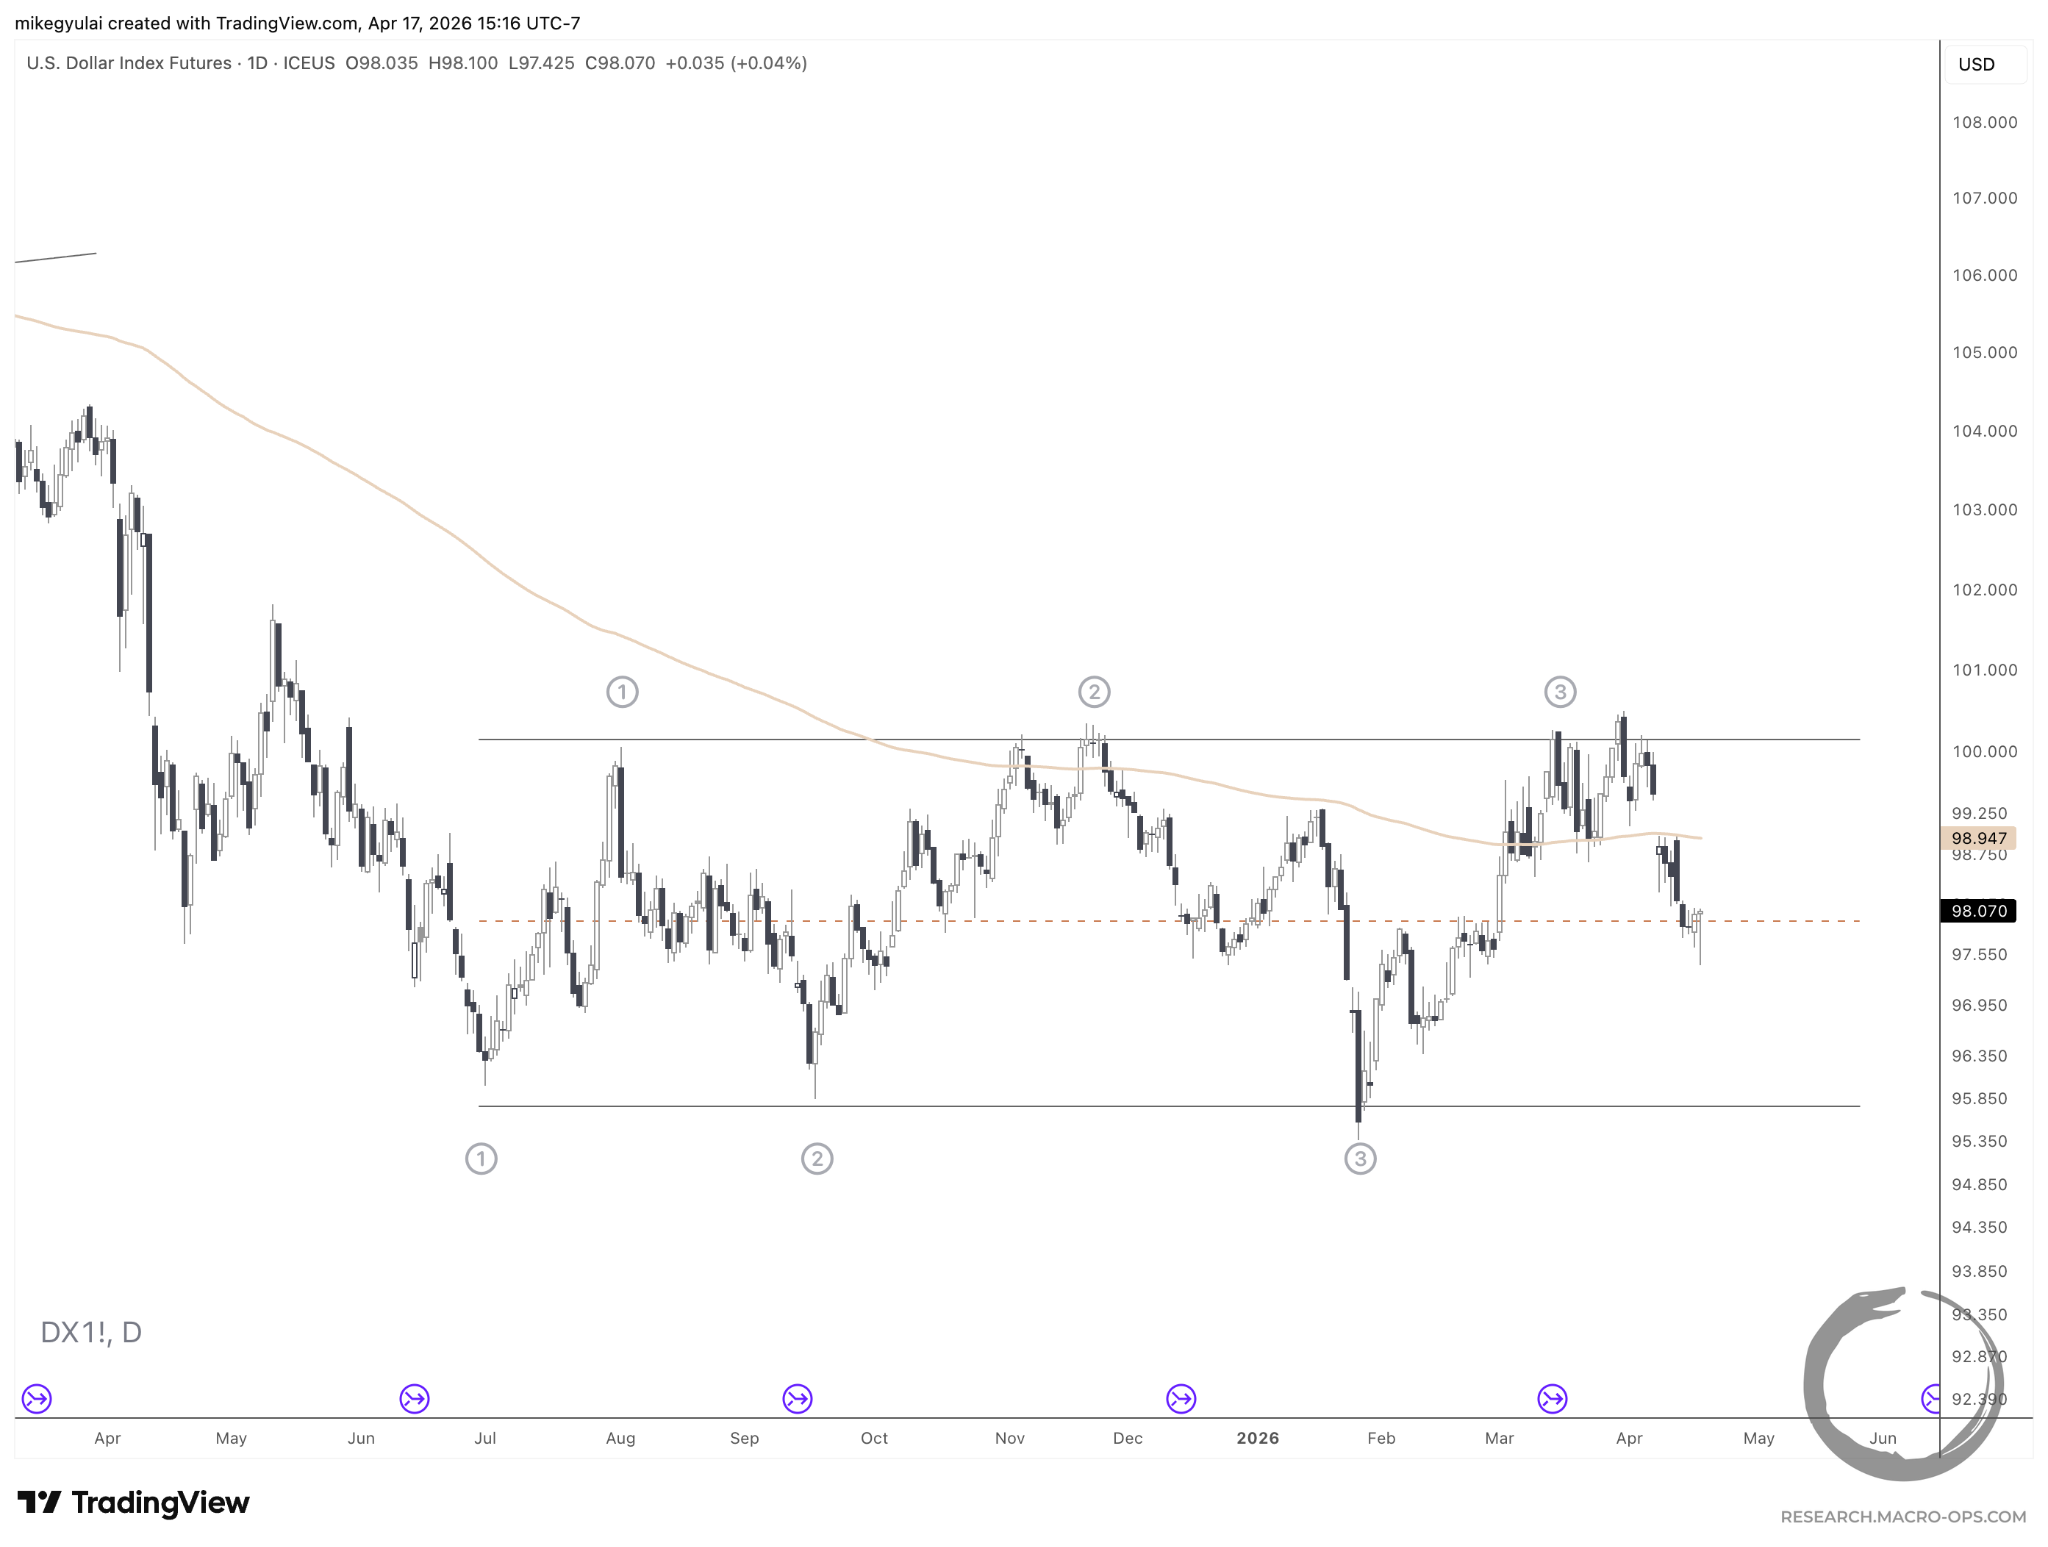
The Dollar continues its rangebound action between ~96 and ~100. It’s currently smack in the middle of the range. Both boundaries have been tested multiple times.
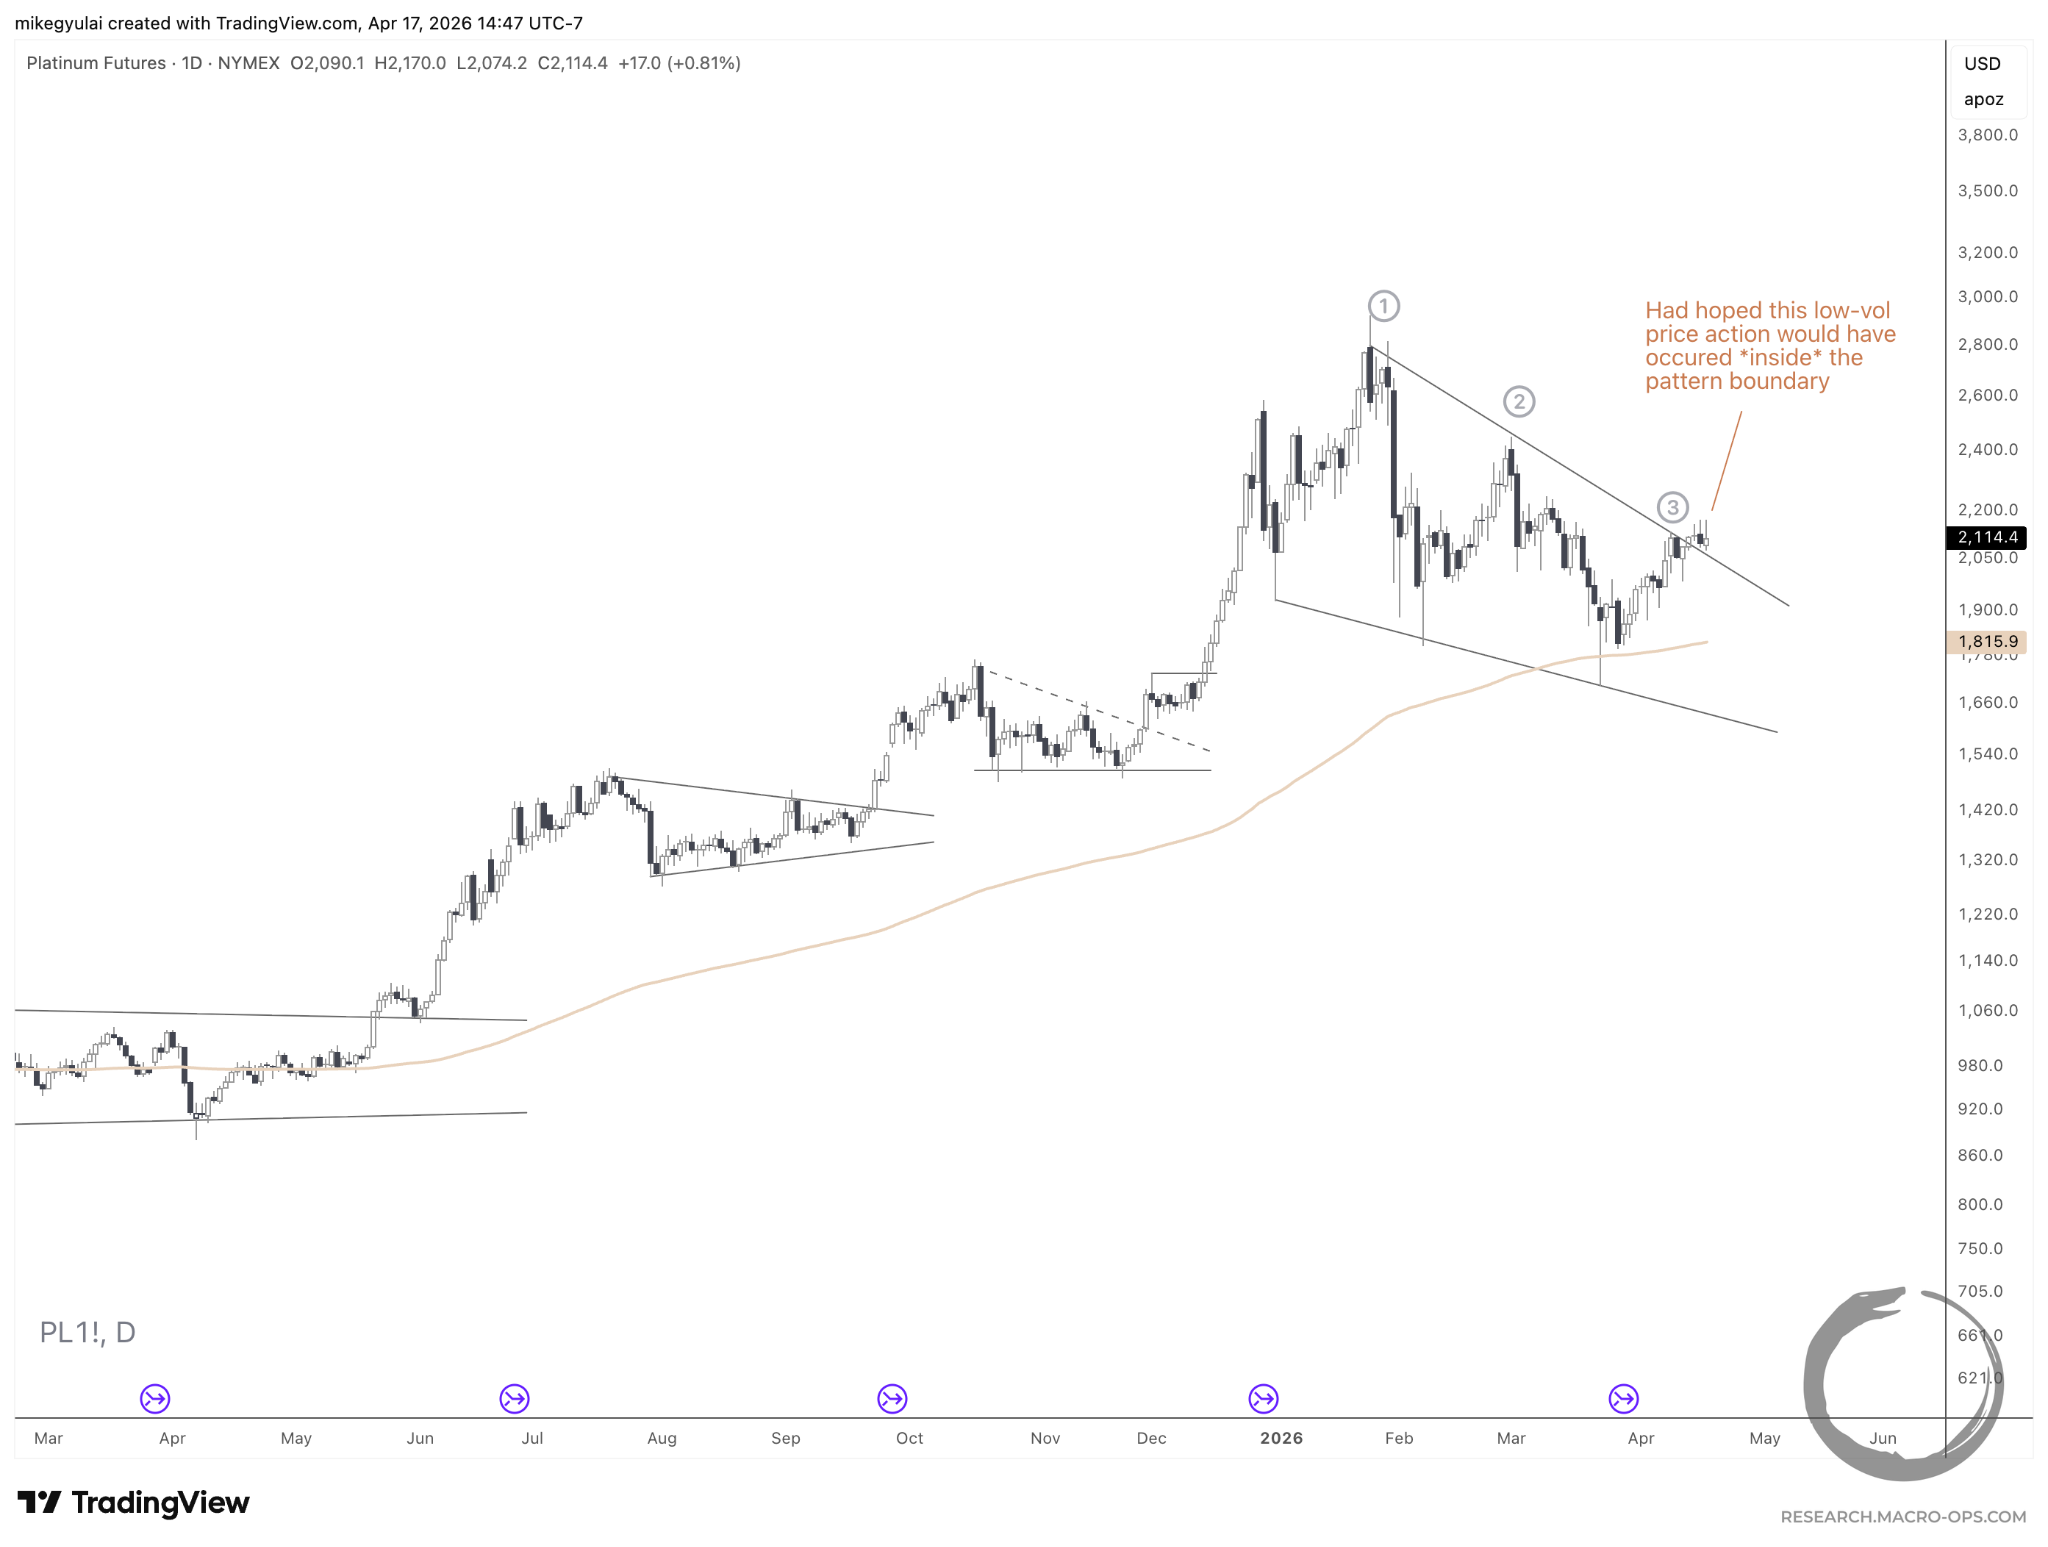
The ideal scenario for Platinum would have been a low-volatility contraction along the upper boundary of this Falling Wedge. This would have allowed energy to build for a breakout.
Instead, price bled right through the boundary, which tells me this boundary is not significant to market participants and the pattern as I labeled it is likely to morph.
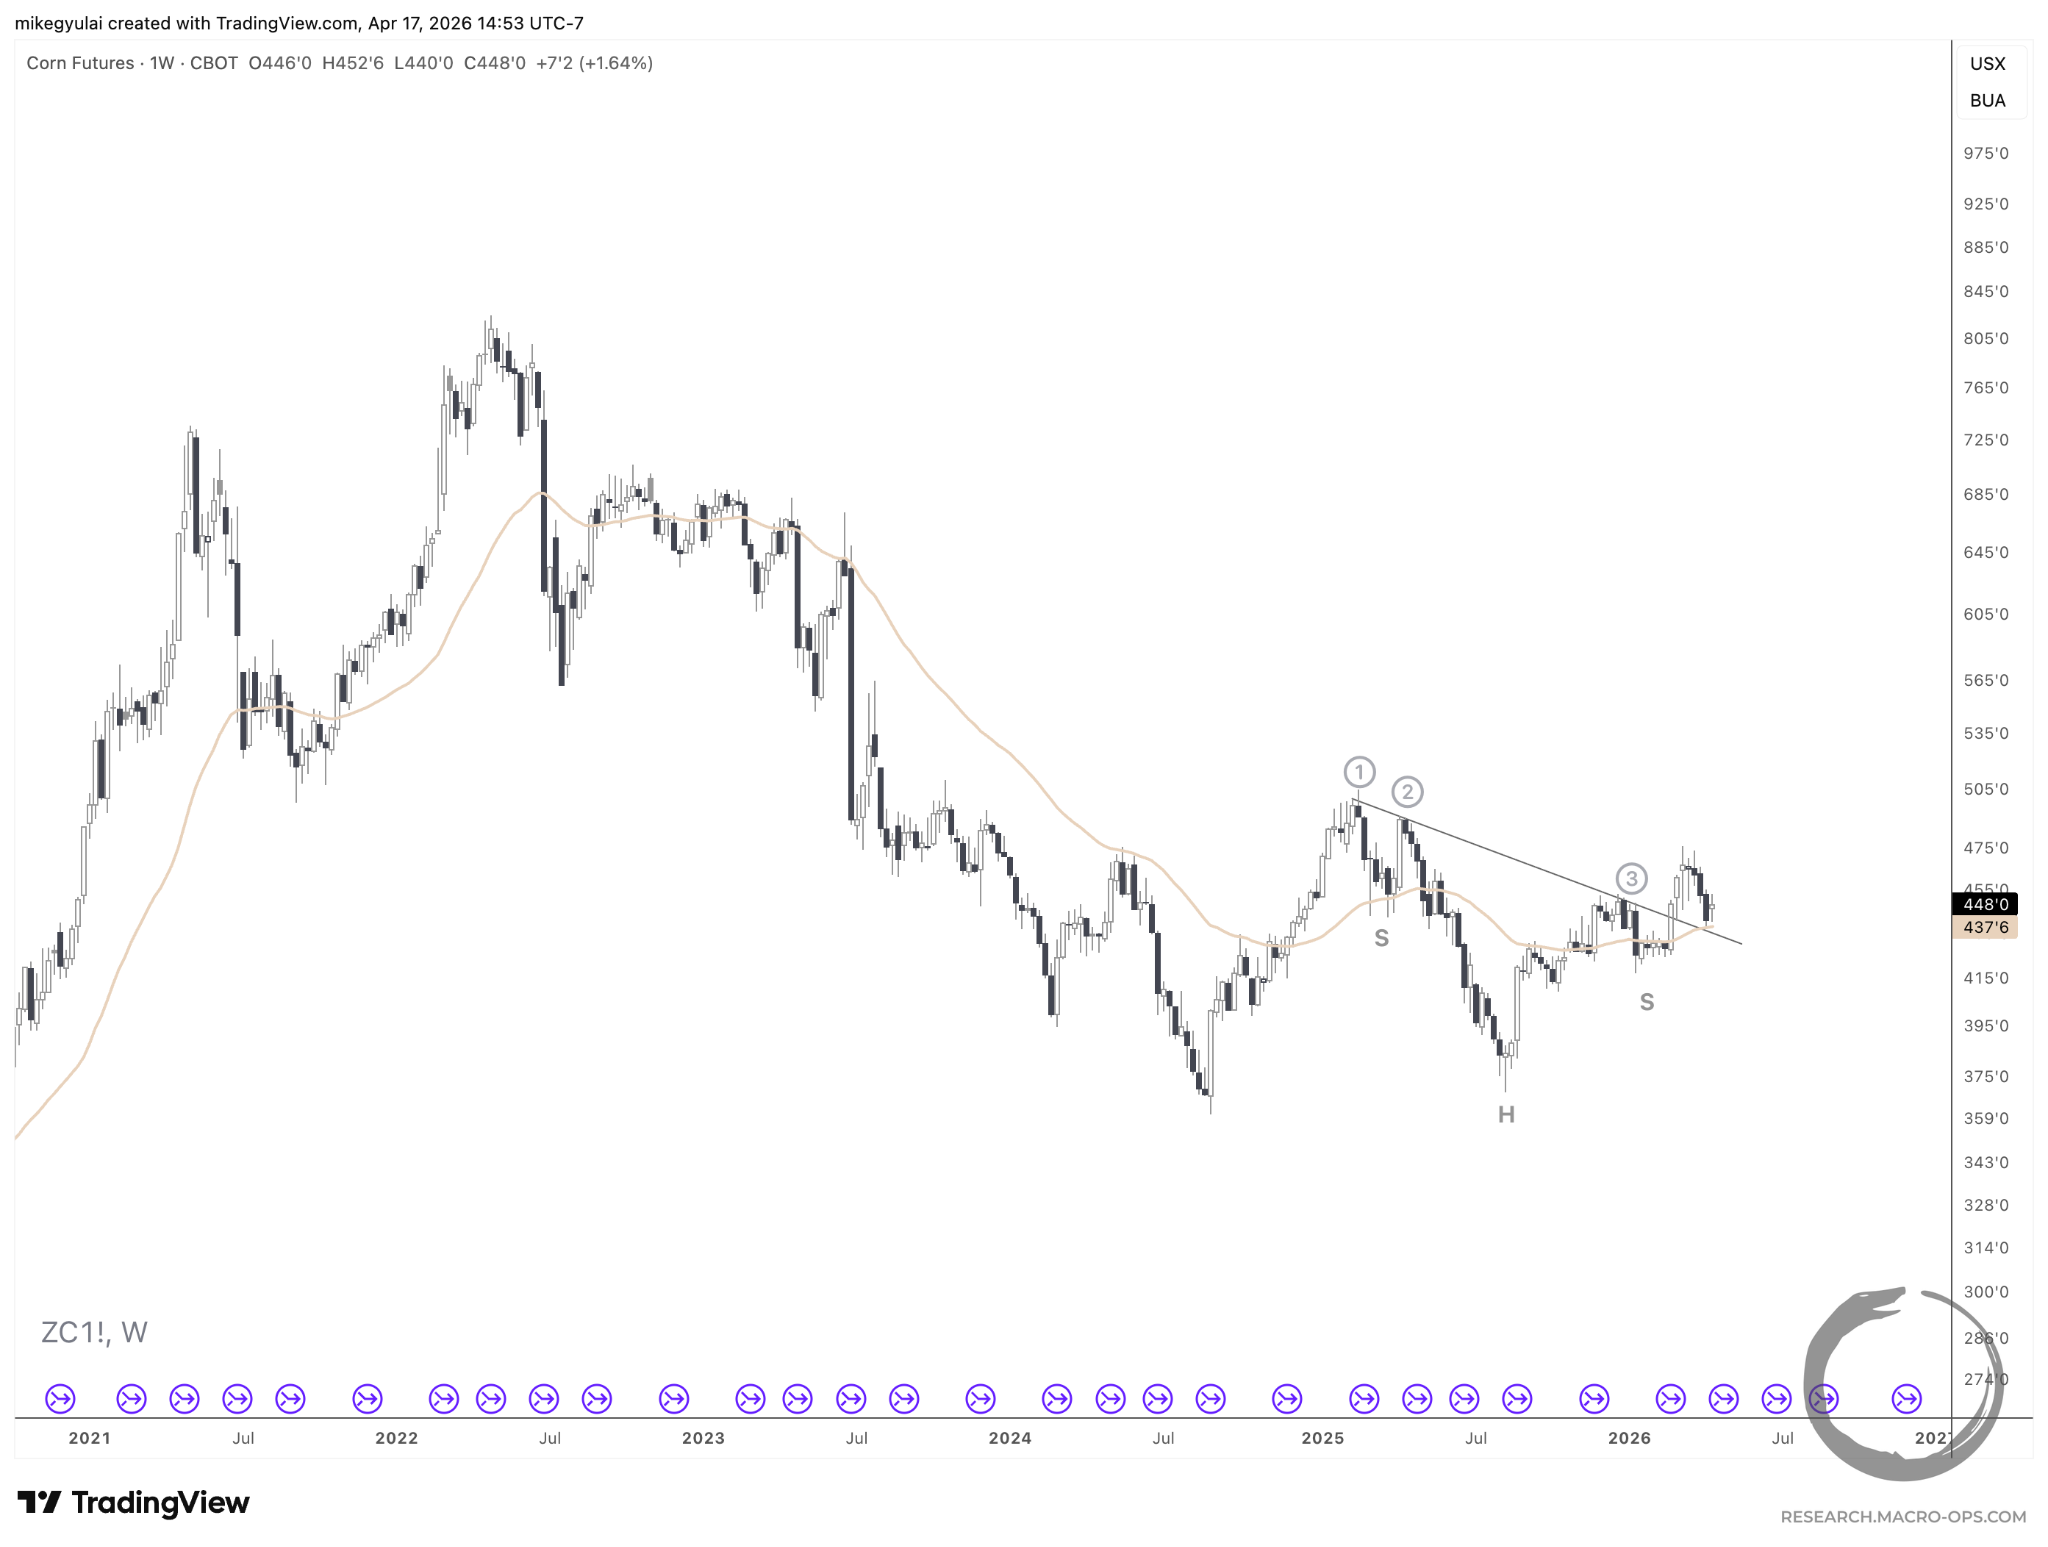
Corn is trying to hold a retest of a multi-month Head & Shoulders Bottom breakout.
Note: Head & Shoulders with necklines slanted in the opposite direction of the breakout are considered weaker than those where the slant of the neckline aligns with the direction of the breakout.
A continuation pattern forming on the daily would be an ideal setup from here.
The Pauses That Refresh
A month ago, many of these same equity setups appeared ready to break out. The conflict in Iran sent them to the opposite sides of their ranges. Now, they are looking back in play.
Here’s what rose to the top of my equity screen this week:
Active watchlists, real-time trade alerts, and live portfolio tracking are reserved for members of The Collective, our premier service offering discussions on high-level theory and performance, differentiated research, and a global community of serious traders and investors dedicated to mastery. Learn more about The Collective here.