


Most retail traders catch the bug the same way: chasing fast money on the side. A good portion burn through their cash at the starting line. A smaller portion survive long enough to build something meaningful.
And for those who do, the goalposts shift. Trading is no longer about extra cash alongside a primary income. It transforms into a pathway to freedom.
But here’s what goes unseen: this idea of freedom gets misattributed to external circumstances, seen as manipulable by money. Traders convince themselves that hitting a certain account balance will resolve a restlessness inside them.
Some get stuck in this loop forever. The felt sense of arrival keeps receding. They hit their number, move the goalposts, hit the new number, move them again. Because freedom is overwhelmingly an internal state, not an external one.
But a small fraction—true outliers—either last long enough or hit a number so stunning, they actually pause. And in that strange space of having money concerns covered while witnessing all that money cannot solve, they ask: “What is the purpose of trading beyond individual financial gain?”
Here’s what I ask them to consider: trading has no purpose. Just as no professional title grants its holder a purpose. Instead, it’s the qualities we develop through the experience of trading that enable us to deliver on our deeper calling in the world.
Dr. Brett Steenbarger writes, “In mastering risk and uncertainty; in cultivating the ability to pursue opportunity in effortful ways; in making ourselves better as decision makers; in becoming more disciplined actors; we seize the opportunity not only to become better traders, but also to become better human beings.”
These qualities spill into every area of life. They make us better business partners, spouses, parents, and friends. And those relationships, deepened by who we become through trading, nourish us in ways money and market speculation never can.
This is where freedom actually lives. Not in trading, but in what striving for mastery builds within us.
Building a Commodities Playbook
For the last few issues, I’ve shared that equities have moved into a risk-off posture. So long as this condition remains, my primarily long equity breakout system is on pause.
When pauses such as this occur, it offers the opportunity for rich, in-depth post-analysis, and the development of new trading playbooks and complementary strategies. It was, in fact, just such a pause last year that allowed me to refine my breakout regime filters, and develop the intraday version of my end-of-day strategy.
This time, I’m turning my focus to futures, with a major focus on commodities.
Commodities have not played a major role in my trading since 2022. At that time, I traded them using the same framework and trade management as my equity trades.
Since then, my focus has been lasered in on equities: the specific patterns they form, how they move, the regimes they cycle through as definable by indices such as SPY.
And because of the intimacy I’ve developed with this asset class, the foundation I’ve used for approaching commodity futures is, ironically, equities. What attributes do they share? And, more importantly, where do they differ?
There is a single, often-overlooked page in Edwards and Magee’s Technical Analysis of Stock Trends that speaks directly to these questions. Here is what they write (emphasis mine):
“News about weather, drought, floods, etc., that affect the growing crop, if we are dealing with an agricultural commodity, can change the trend of the futures market immediately and drastically [...] Analogous developments in the stock market are extremely rare.
Under what might be called normal market conditions, those chart patterns which reflect trend changes in the most simple and logical fashion work just as well with commodities as with stocks. Among these we would list Head-and-Shoulders formations, Rounding Tops and Bottoms, basic trendlines. Trendlines, in fact, are somewhat better defined and more useful than in stocks.
Other types of chart formations which are associated in stocks with short-term trading or with group distribution and accumulation, such as the Triangles, Rectangles, Flags, etc., appear less frequently in commodities and are far less reliable as to either direction or extent of ensuing move. Support and resistance levels, as we have already noted, are less potent in commodities than in stocks; sometimes they seem to work to perfection but just as often they don’t. For similar reasons, gaps have relatively less technical significance.”
Whereas in equities, trends tend to build and reversals are rare, the opposite is true in commodities, where “immediate and drastic” reversals are commonplace.
Whereas in equities, the polarity principle—that prior horizontal resistance turns into new support and vice versa—can be used to protect stops, in commodities horizontal support is rarer and less reliable.
Whereas in equities, diagonal trendlines should be viewed with suspicion, in commodities they should be viewed with greater confidence.
An initial playbook can therefore adapt setups in equities with these differences in mind.
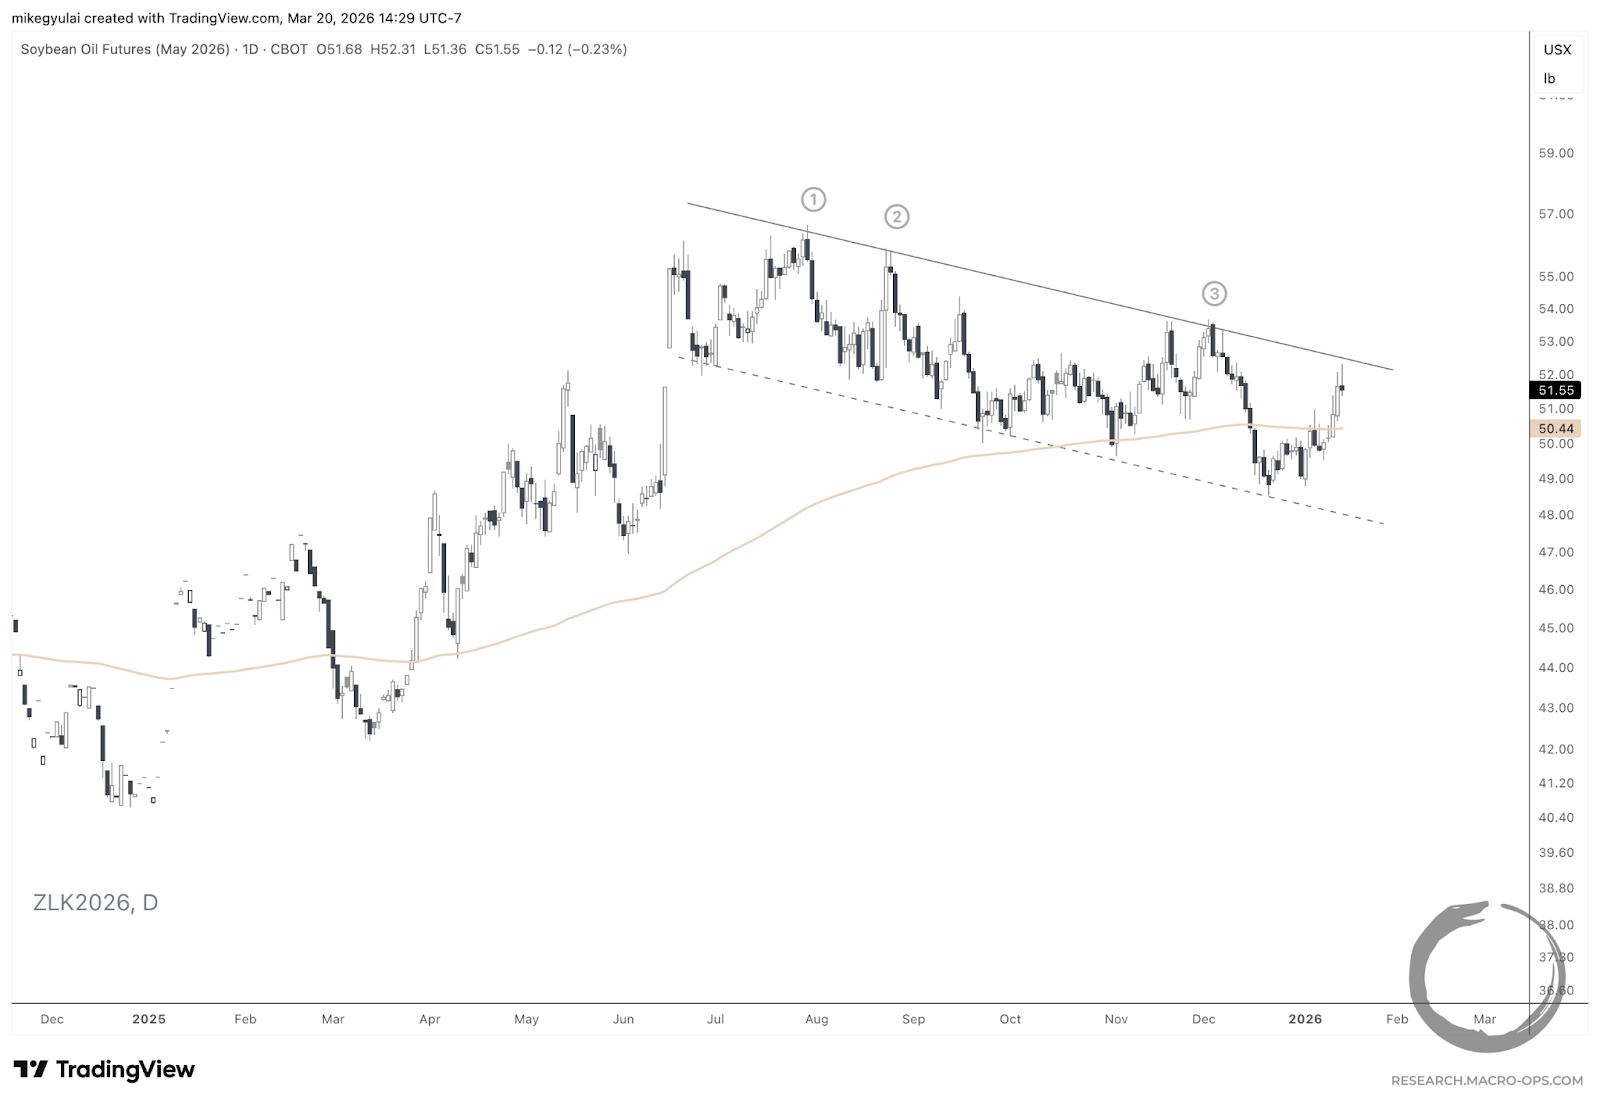
For my personal equity setups, two price pivots at the same horizontal level allows me to draw a support or resistance line. Three price pivots make that level tradeable. For commodities: two price pivots along the same diagonal level allows me to connect them as a trendline. Three price pivots make that trendline treadable.
Drop the rigidity of the 200EMA trend filter, as reversals are common.
Manage trades for “immediate and drastic” changes in price, rather than for the choppy backing and filling of equity trends.
The polarity principle should not be relied upon to protect stops.
Let’s look at some examples from my early chart model playbook:
A valid trendline in Soybean Oil Futures, May 2026 contract.
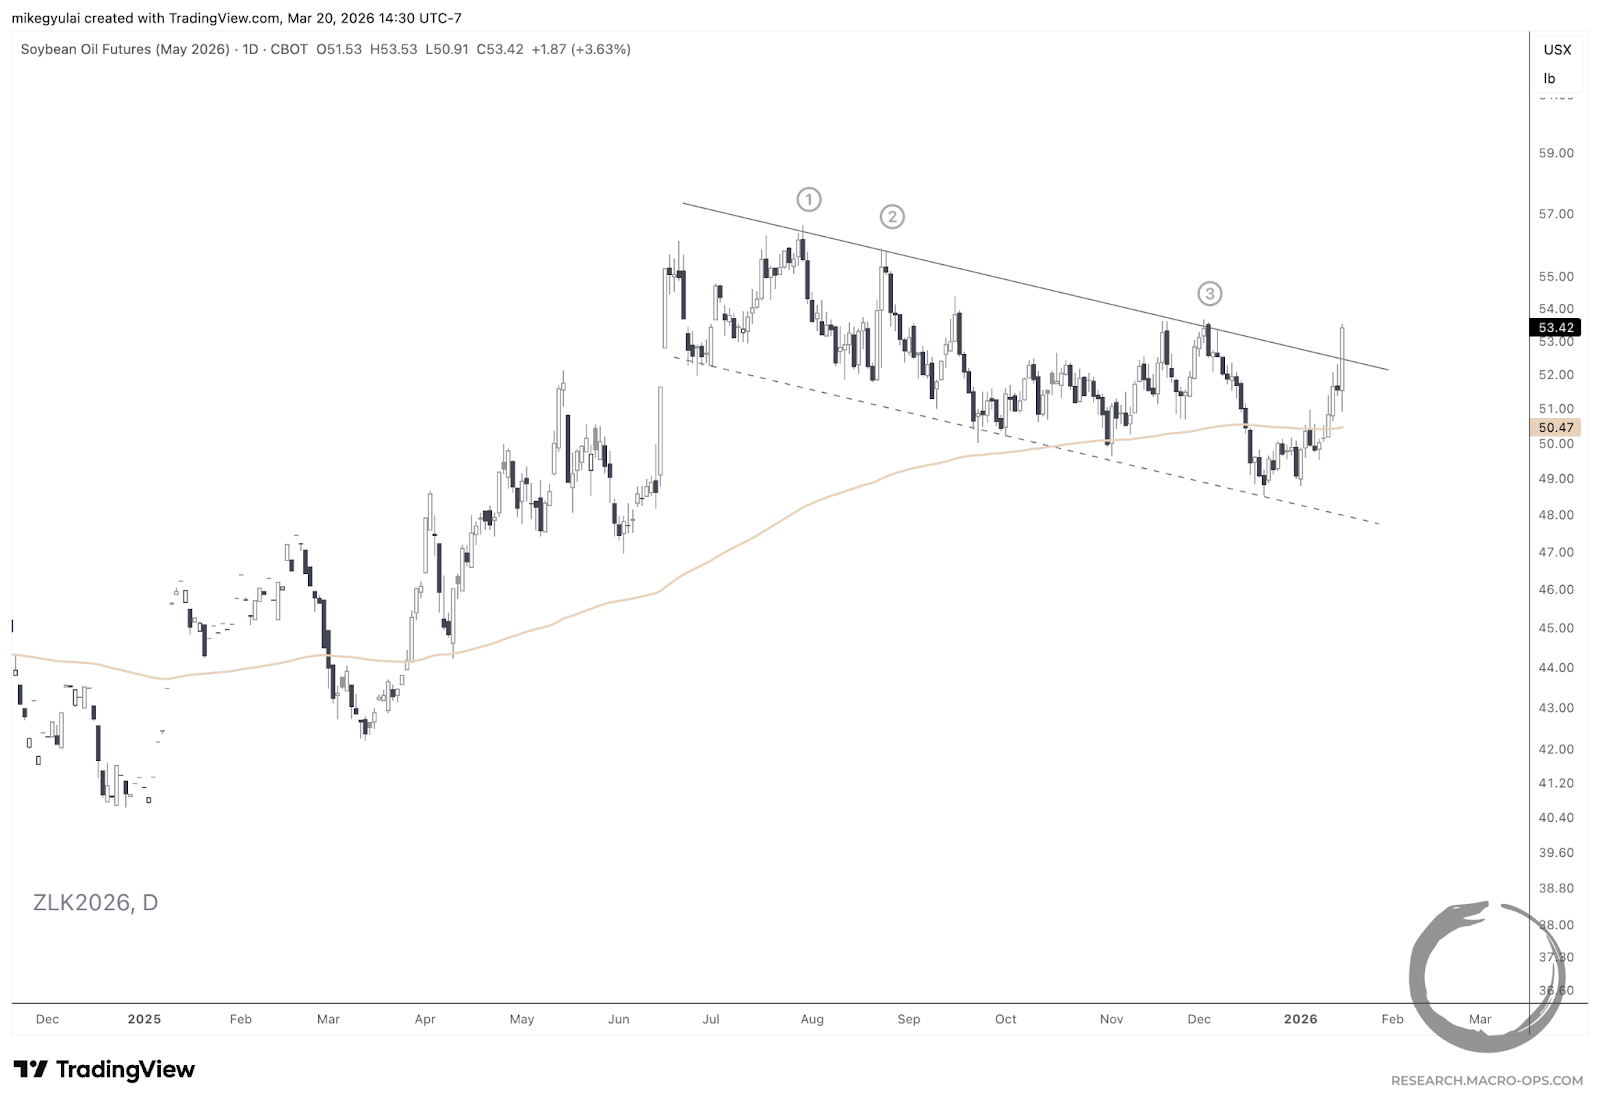
A decisive breakout through that trendline.
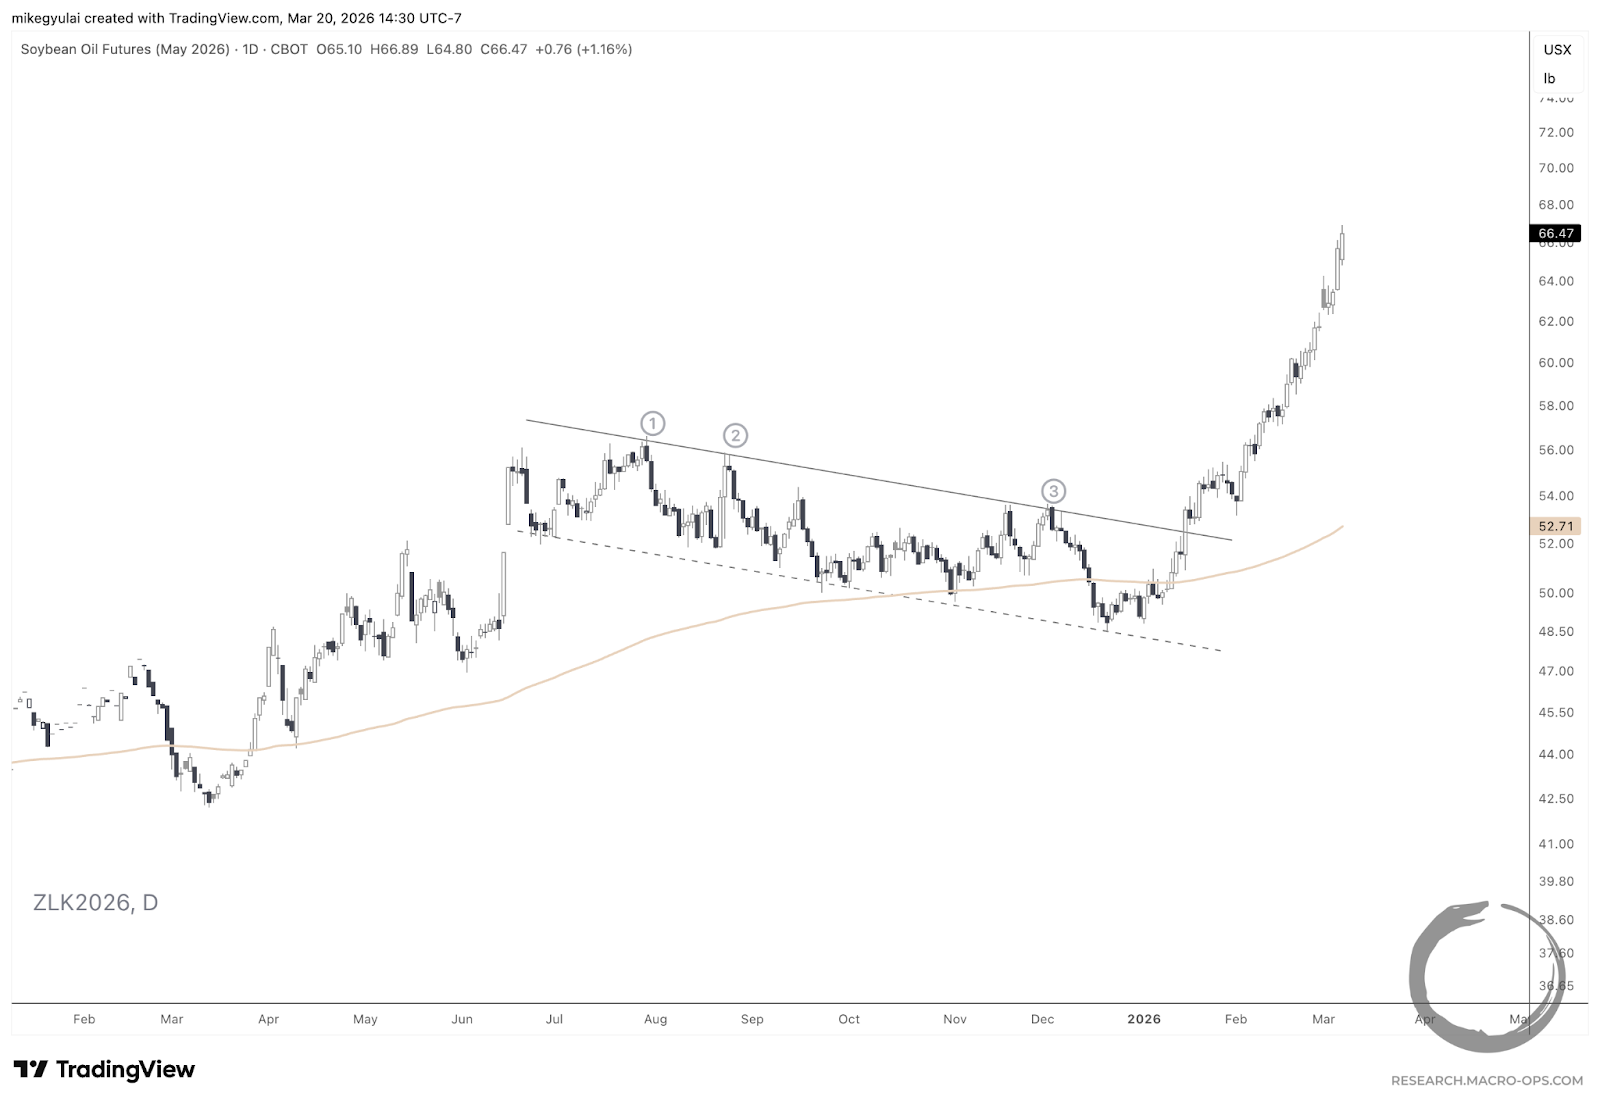
An immediate trend period.
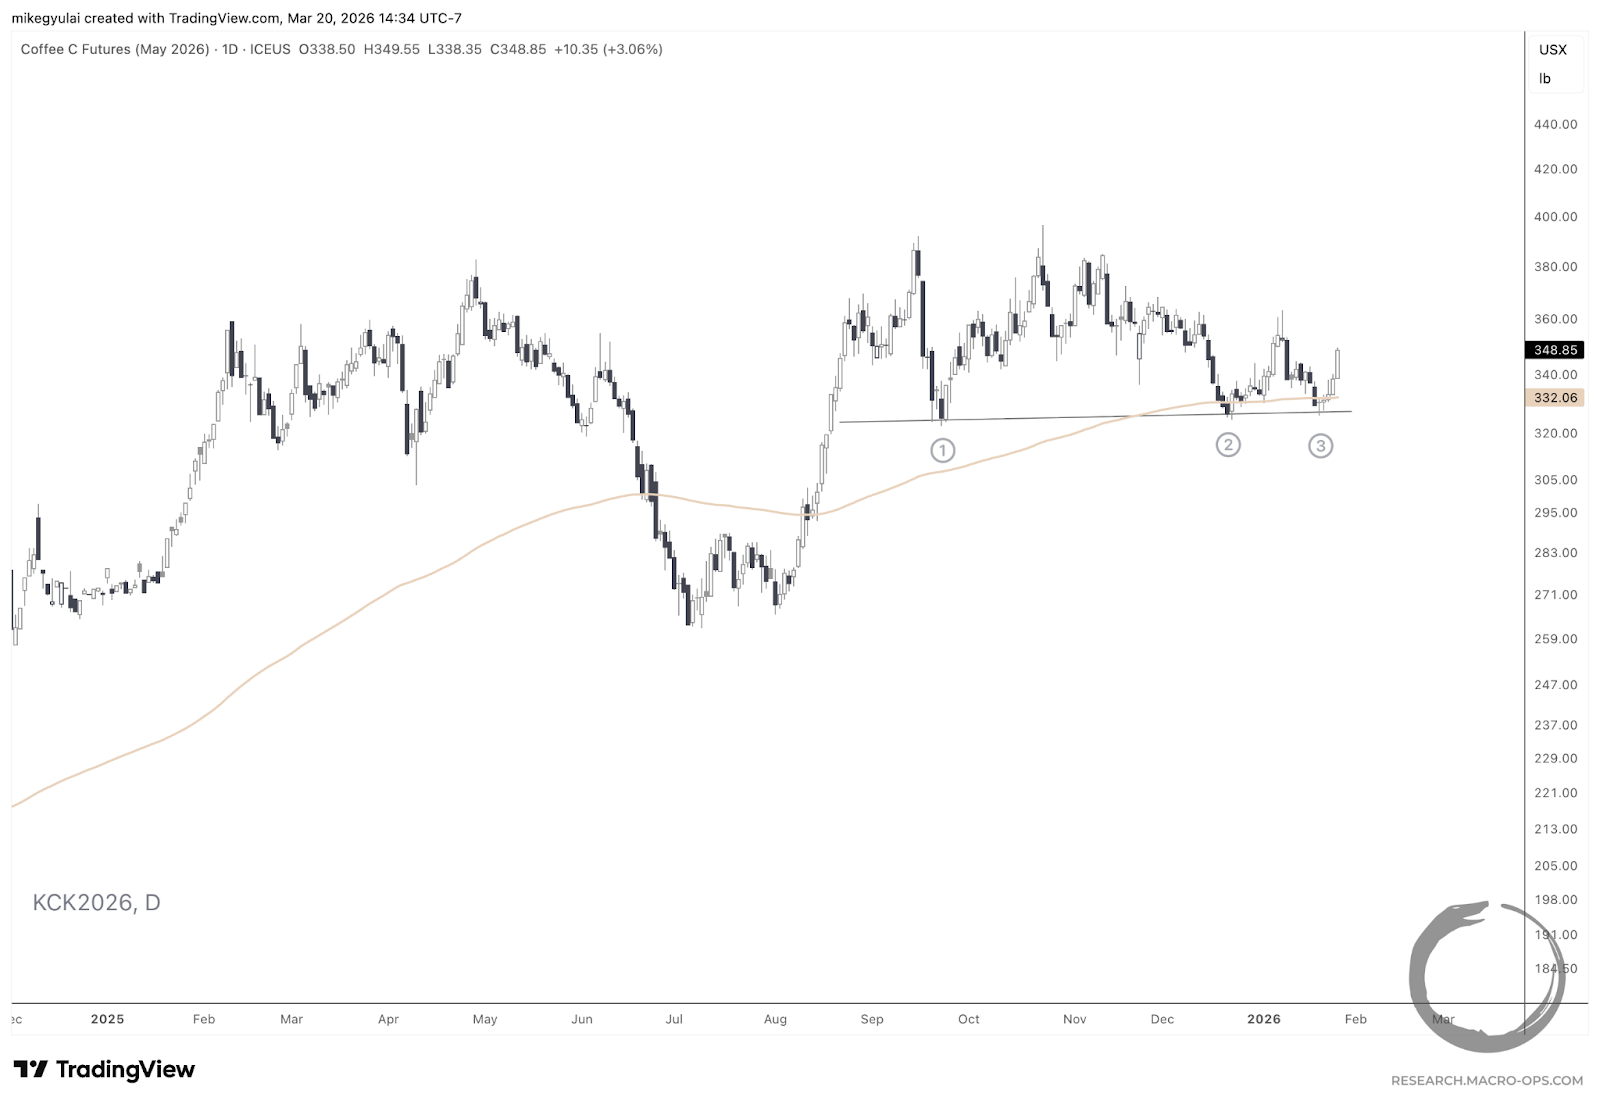
A valid trendline in Coffee Futures, May 2026 contract.
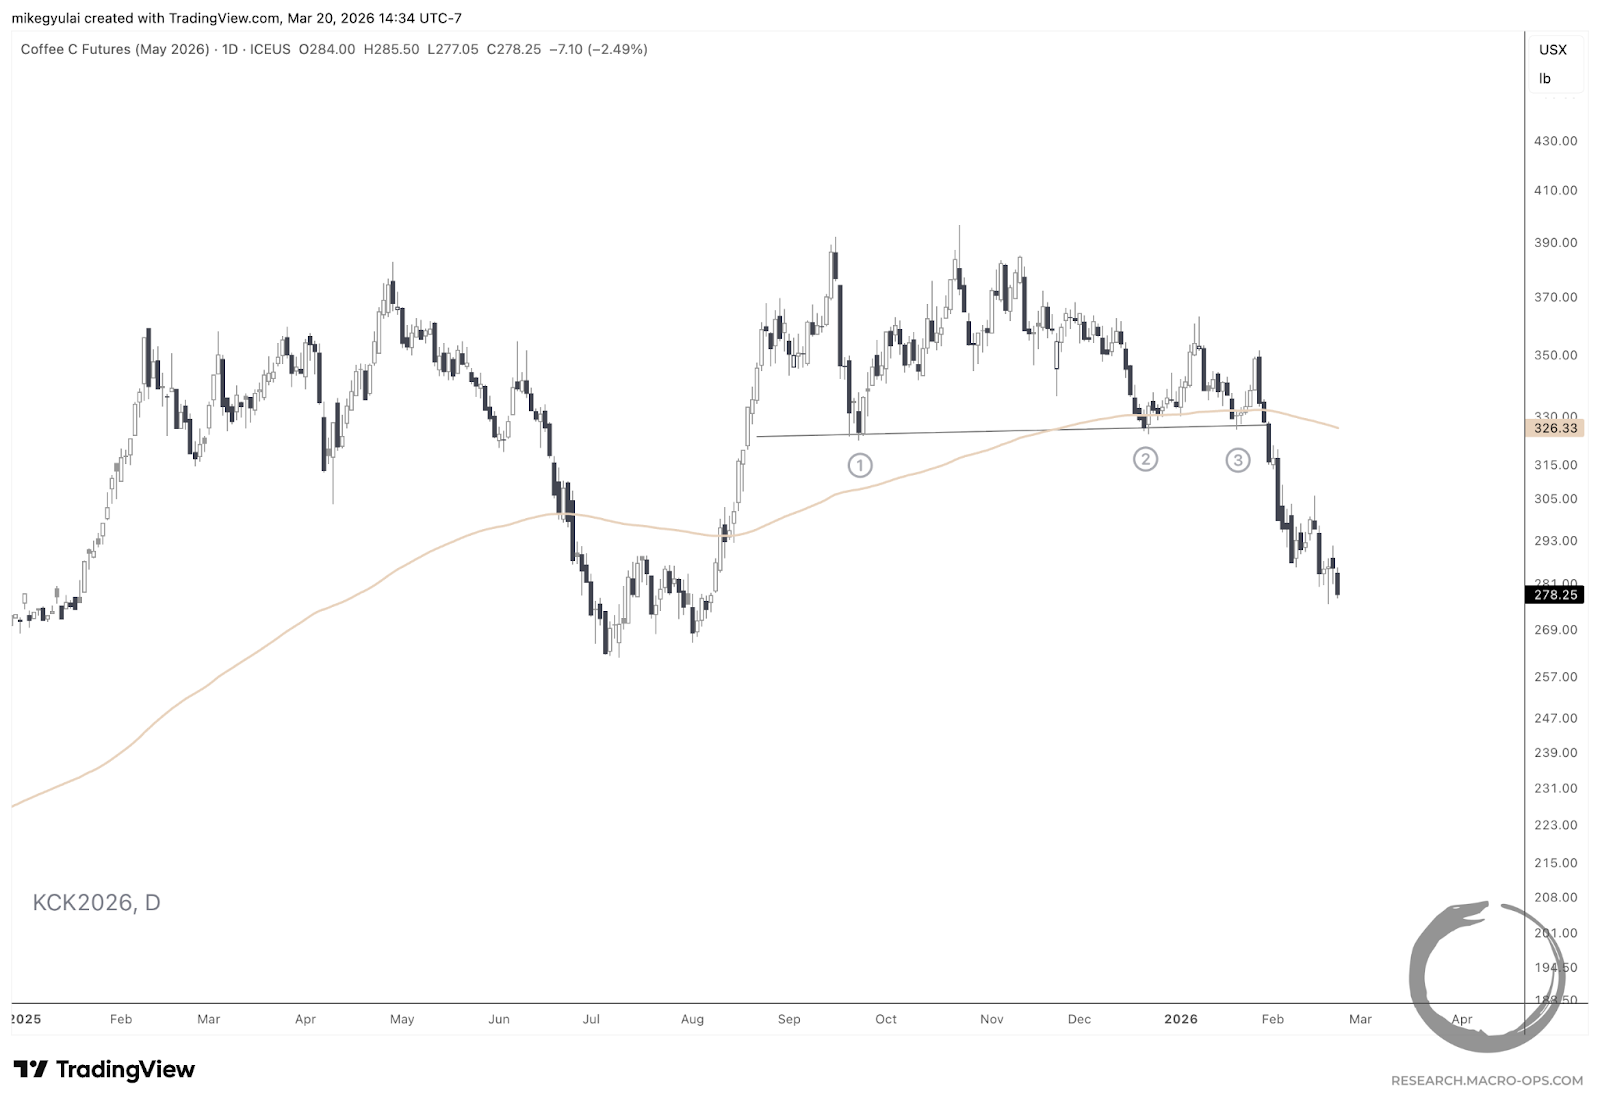
A decisive breakout through that trendline.
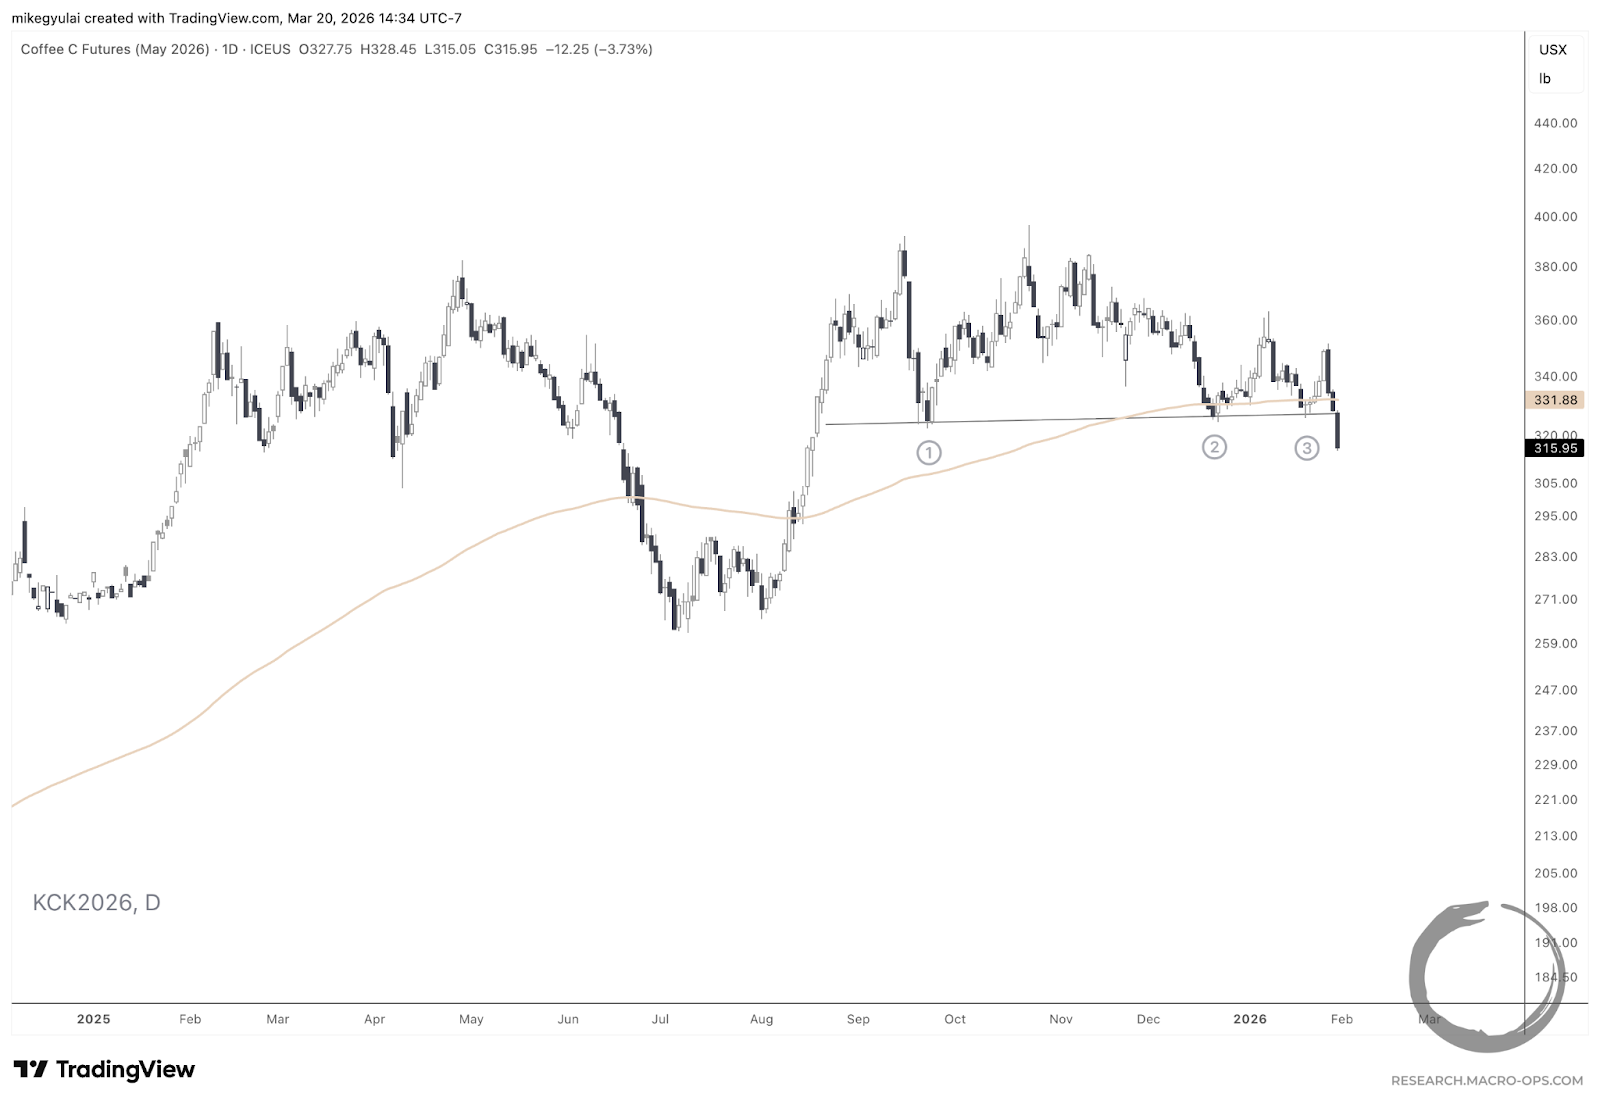
An immediate trend period.
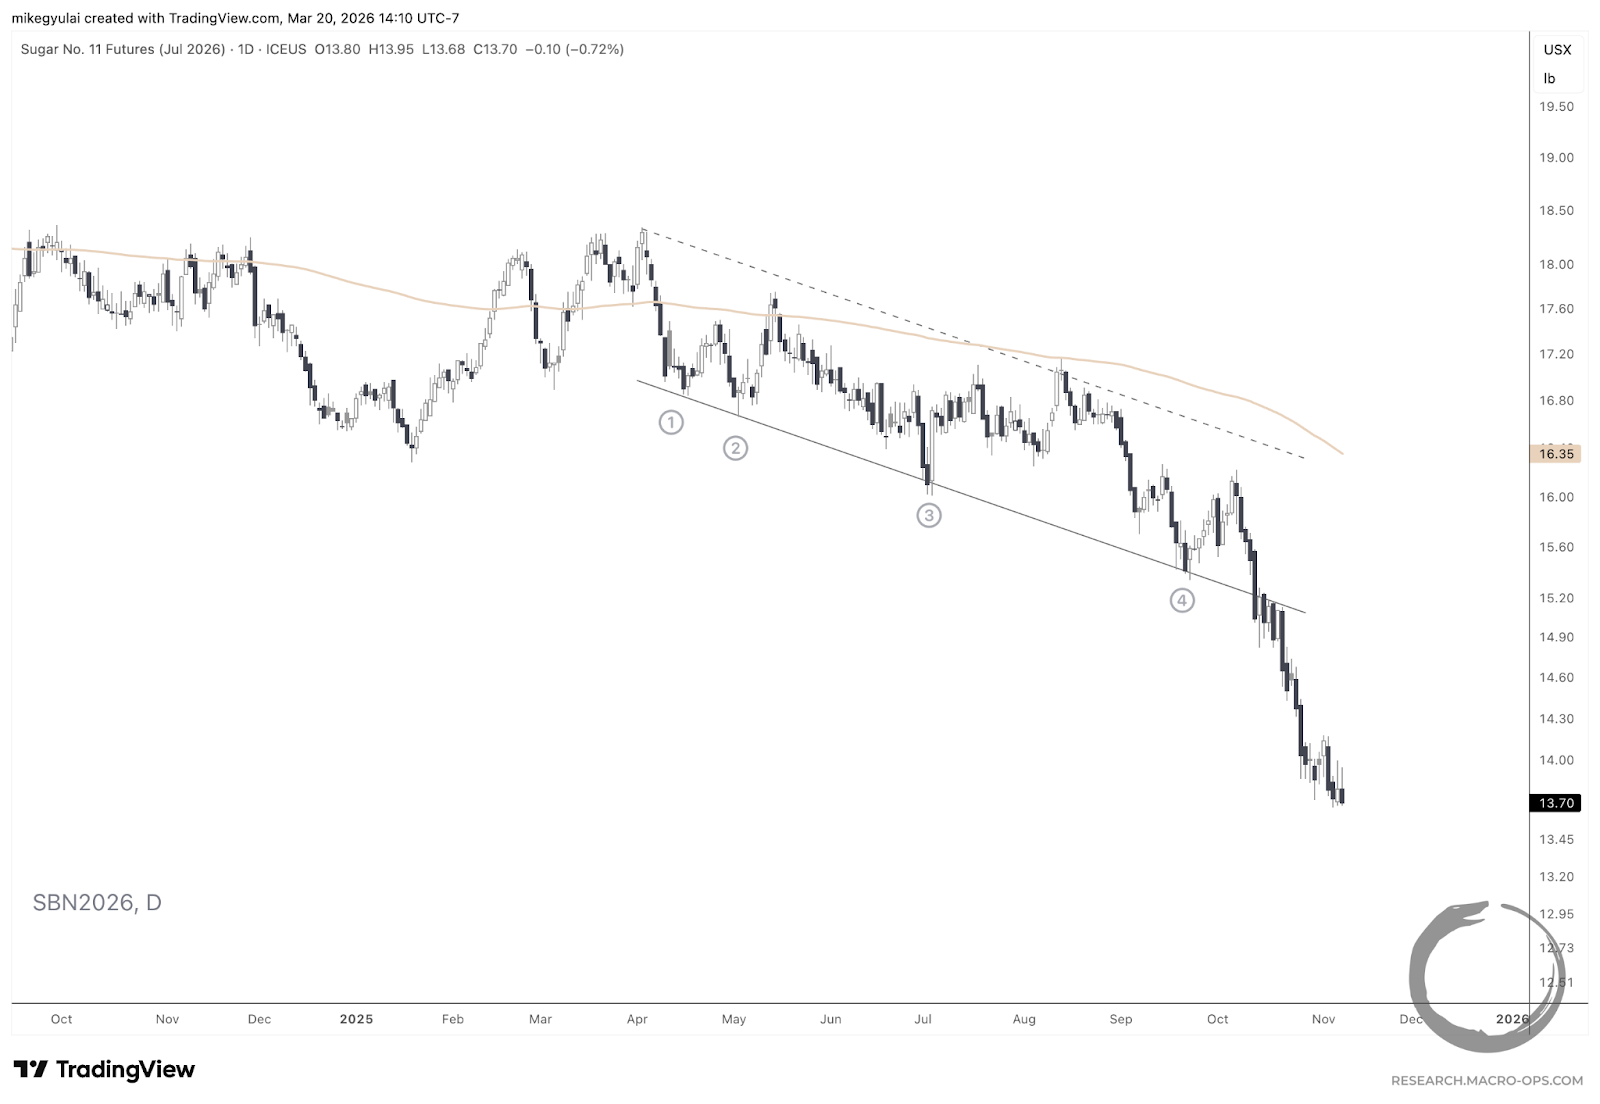
A valid trendline in Sugar No. 11 Futures, Jul 2026 contract.
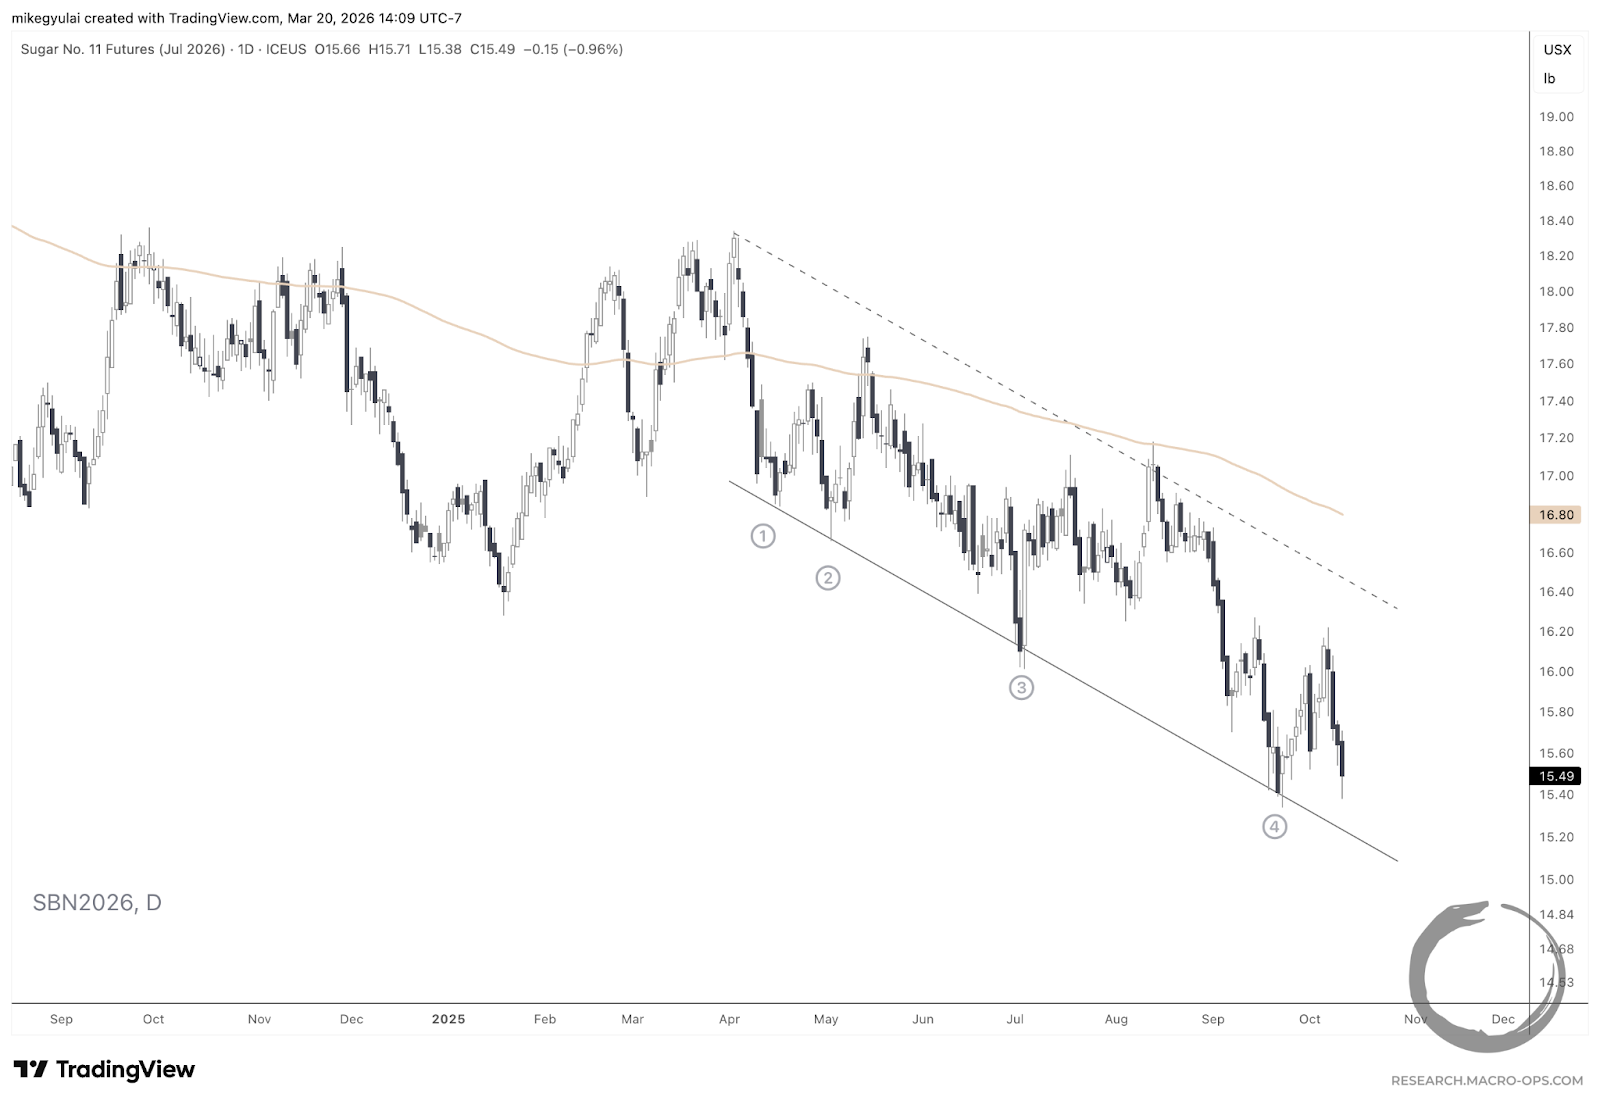
A decisive breakout through that trendline.
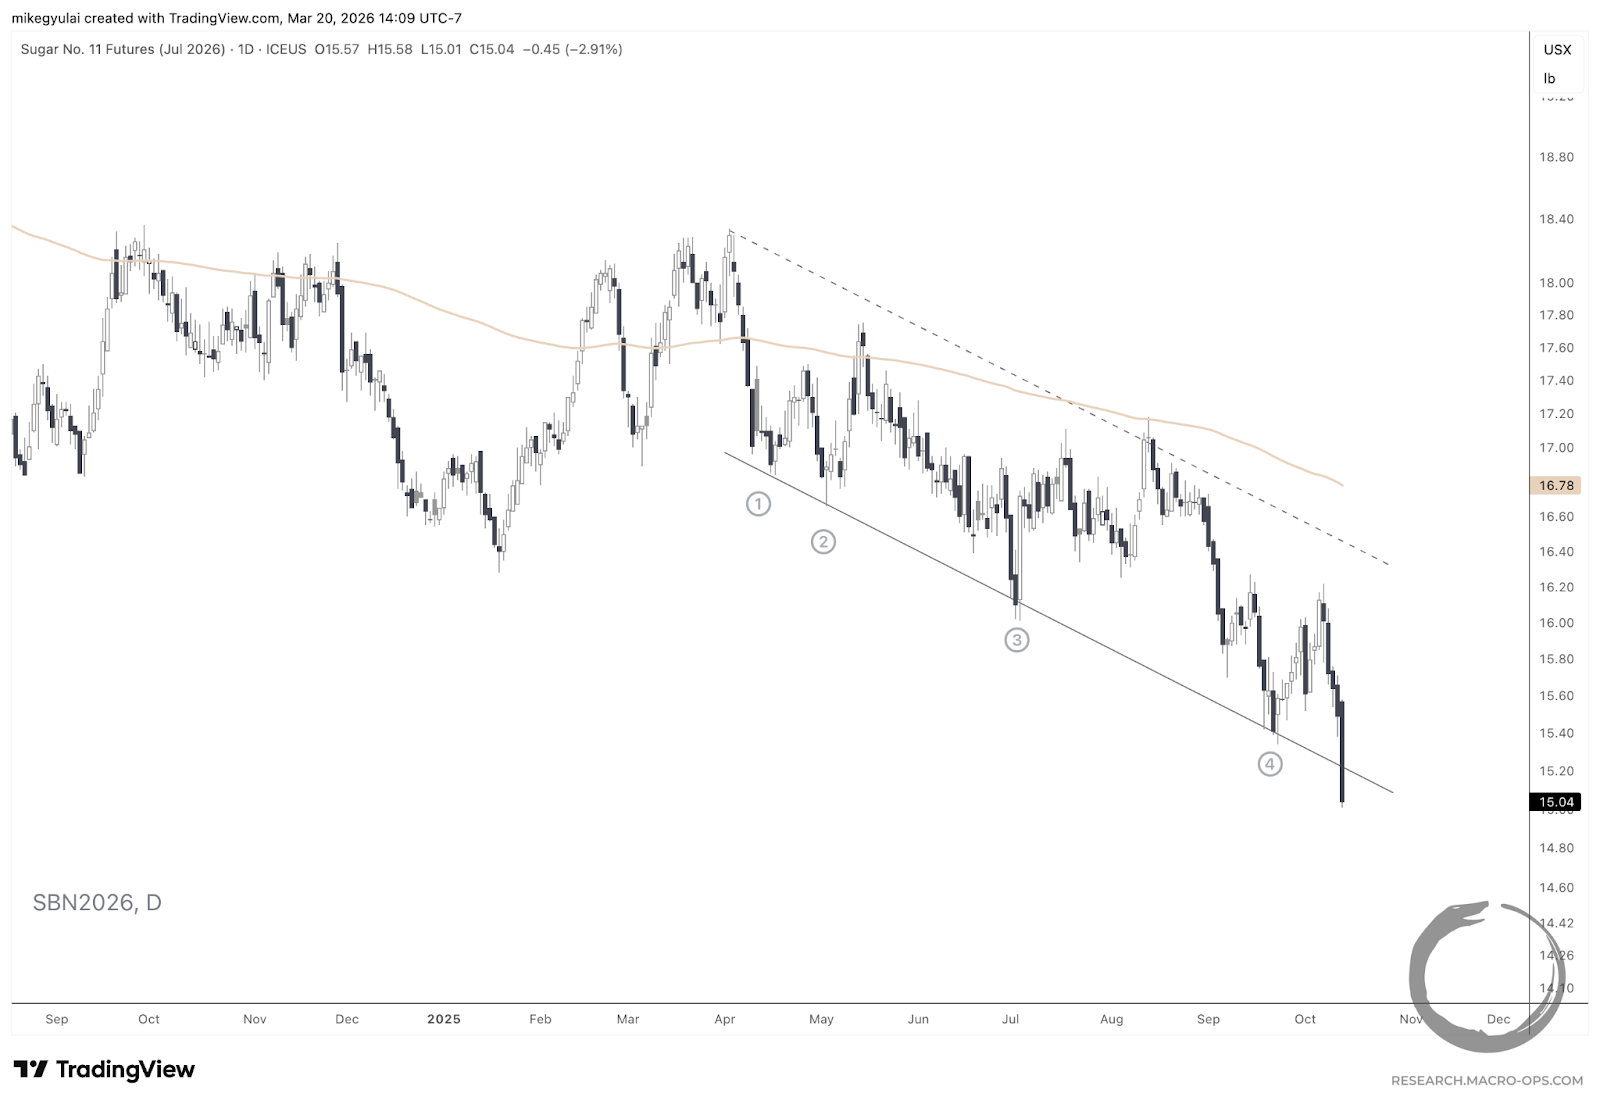
An immediate trend period.
These are best-case scenarios: model charts that will live in my futures playbook.
They represent price action that is repeatedly identifiable, allows for a logical risk-defined entry, and offers asymmetric reward-to-risk.
Doing further work on the entry, stop and trade management techniques that fit my personal psychology, risk tolerance, and trading objectives is something I very much look forward to exploring over the coming months.
The Pauses That Refresh
There are a handful of patterns that have held their consolidations, as well as a number of opportunities to play on the short side or between range boundaries. If these are playbooks that you have yet to develop, now could be the perfect time to do so.
Here are the names that grabbed my attention:
Active watchlists, real-time trade alerts, and live portfolio tracking are reserved for members of The Collective, our premier service offering discussions on high-level theory and performance, differentiated research, and a global community of serious traders and investors dedicated to mastery. Learn more about The Collective here.