



My original major in undergrad was music. I knew just enough about writing songs on guitar to understand artists, and just enough about marketing and business to understand record labels. I sought to make a career at the intersection.
Writing music had always tantalized me.
Everything a song could need sat right there on the fretboard: every possible note, every possible combination of notes, laid out across the six strings running the length of the instrument’s neck.
And yet the melodies and chord changes… they’d hide, as if waiting for a time of their choosing to reveal themselves to me.
There were moments I’d stare at the steel strings and the cherry-stained wood beneath them and think: somewhere in there is a progression I’ll soon discover. A song I’ll write around it. An entire composition I’ll later play by heart.
Each time I’d pick up my guitar after that discovery, I would see the song’s patterns, and spot its changes mapped across the fretboard. Right there in plain sight, where they’d been all along.
But whenever I tried to force the patterns—to will them out of the strings—I could never find them.
Only when I shifted from searching to receiving, from trying to allowing, from determined to curious, would the songs allow themselves to be seen.
While my career in music was short-lived, the lessons songwriting taught me still return.
The next relationship that would hold for decades. The next role that would redirect my career. The next investment that would carry my portfolio.
Each was already there. Refusing to be willed into view.
Waiting, instead, for me to stop searching and start receiving.
Every Four Years
One monthly chart has anchored our read of Bitcoin’s cycles since inception: cycle lows spaced 47 months (roughly 4 years) apart, with cycle highs arriving 35 months (roughly 3 years) after each low. The framework comes from Bob Loukas, founder of The Financial Tap.
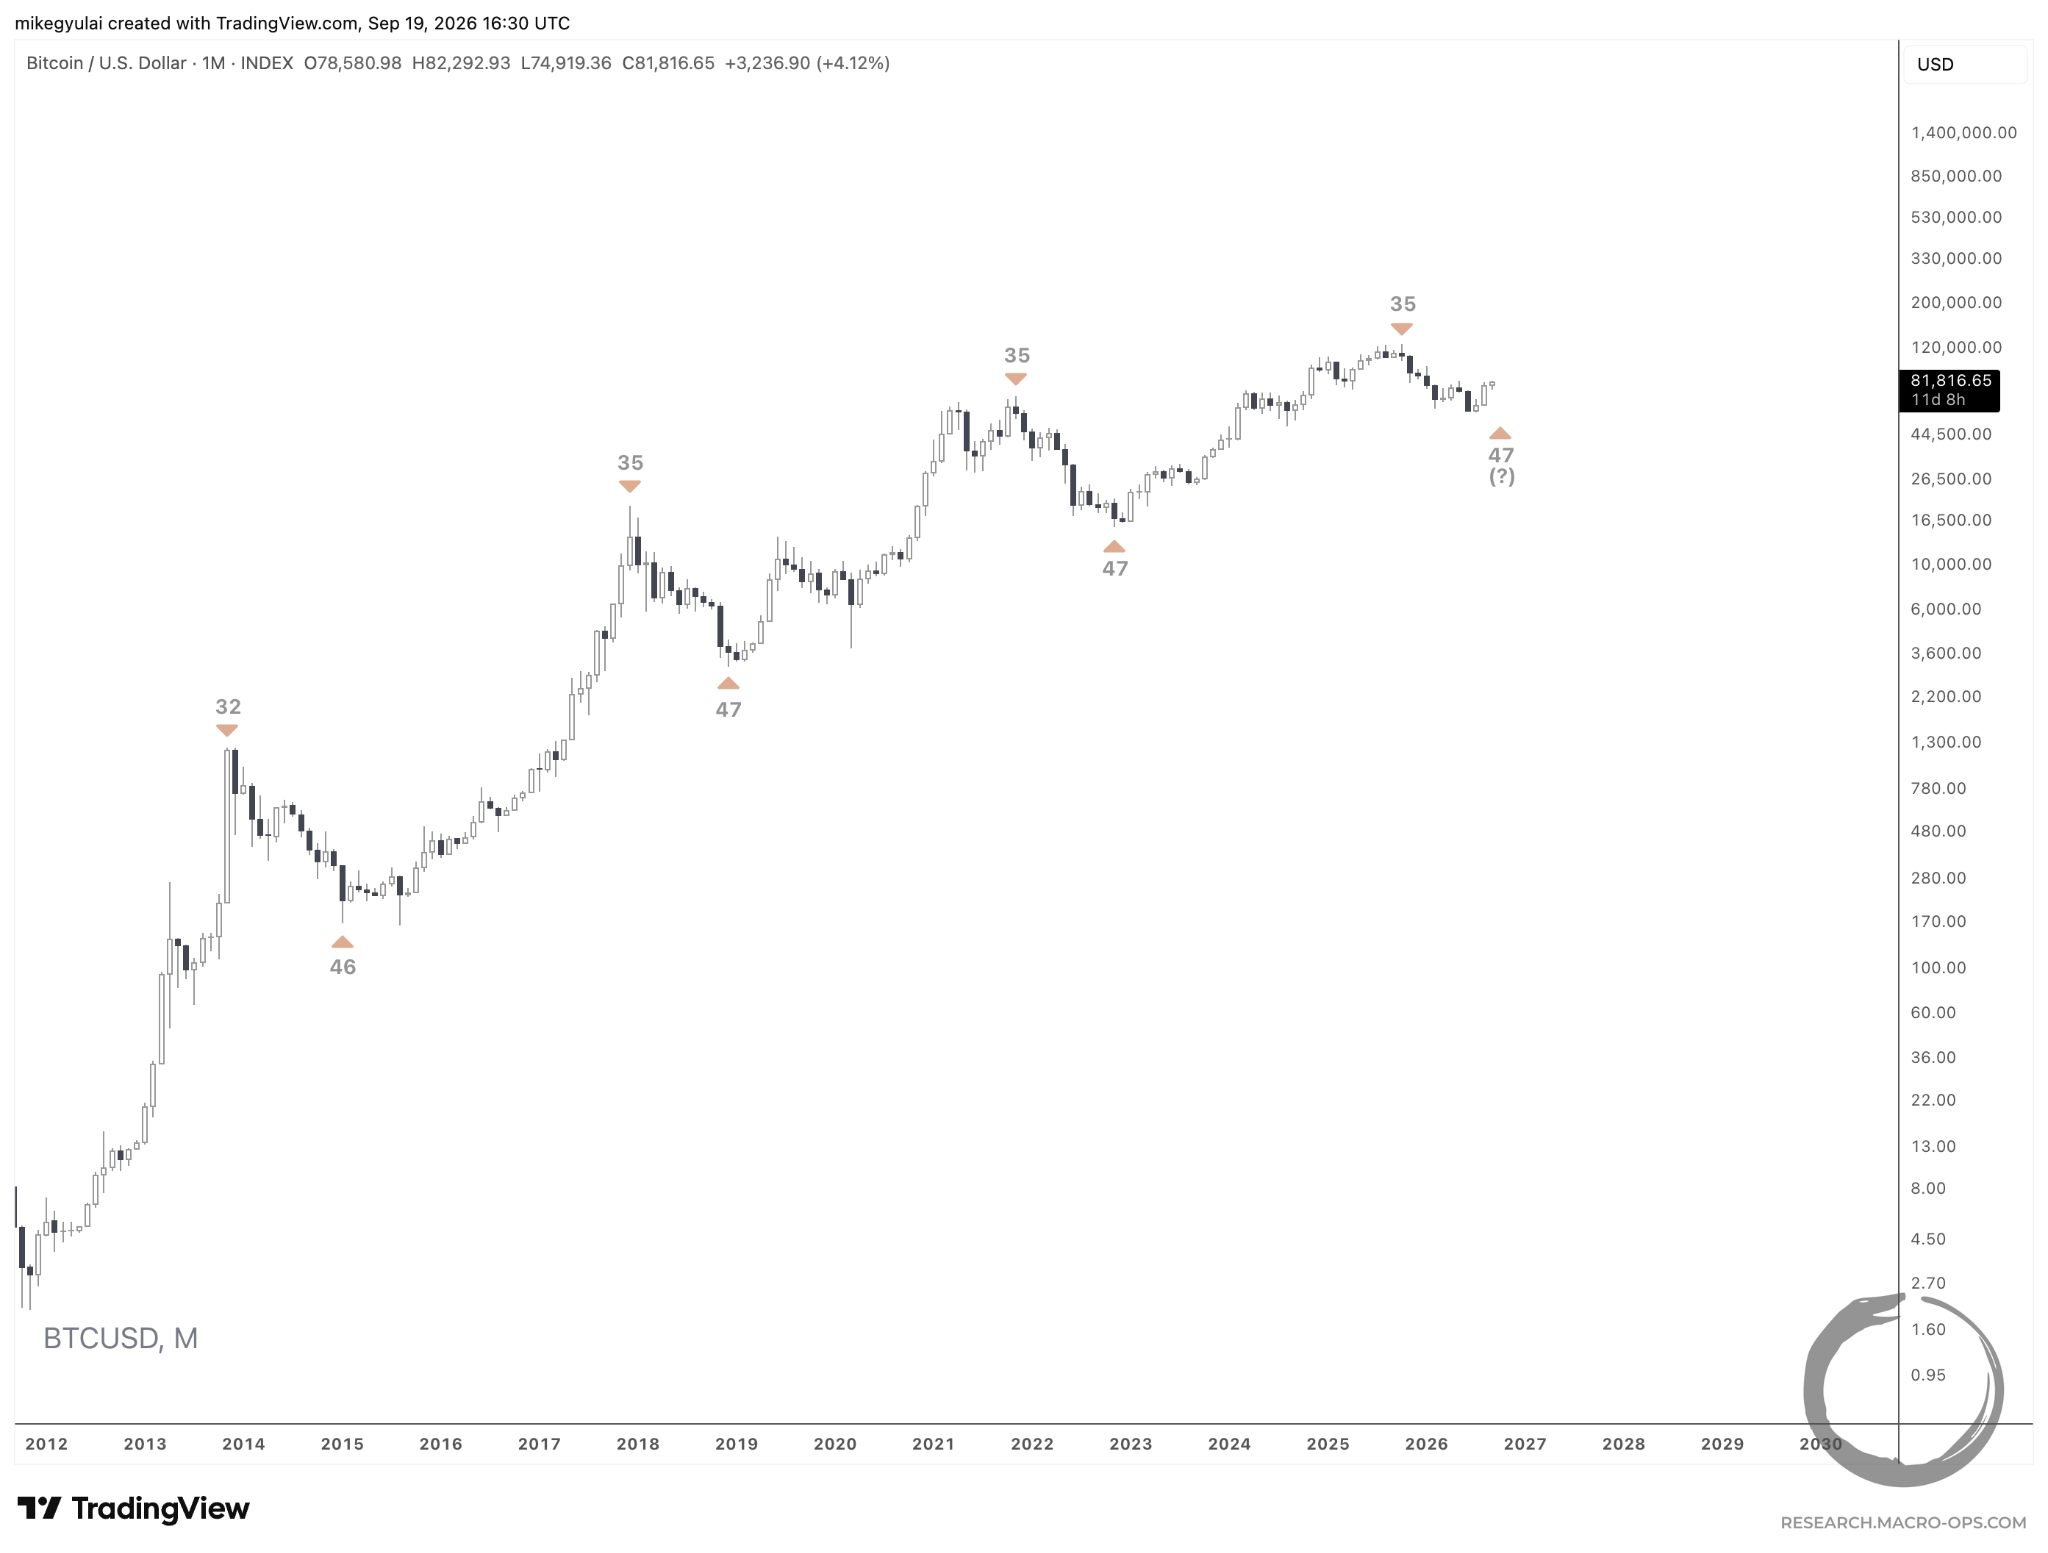
In Bob’s framework, the lows are the structural anchors. Highs can be “right translated” (price advances longer than it declines across the 4-year period, as in every cycle to date) or “left translated” (price tops early and spends most of the cycle falling). The lows stay fixed in time.
Standard cycle timing pointed to a bottom next month, in October. Instead, Bitcoin carved out a 2.5-month head-and-shoulders base over the summer and broke out impulsively, forming a potential double-walled bottom.
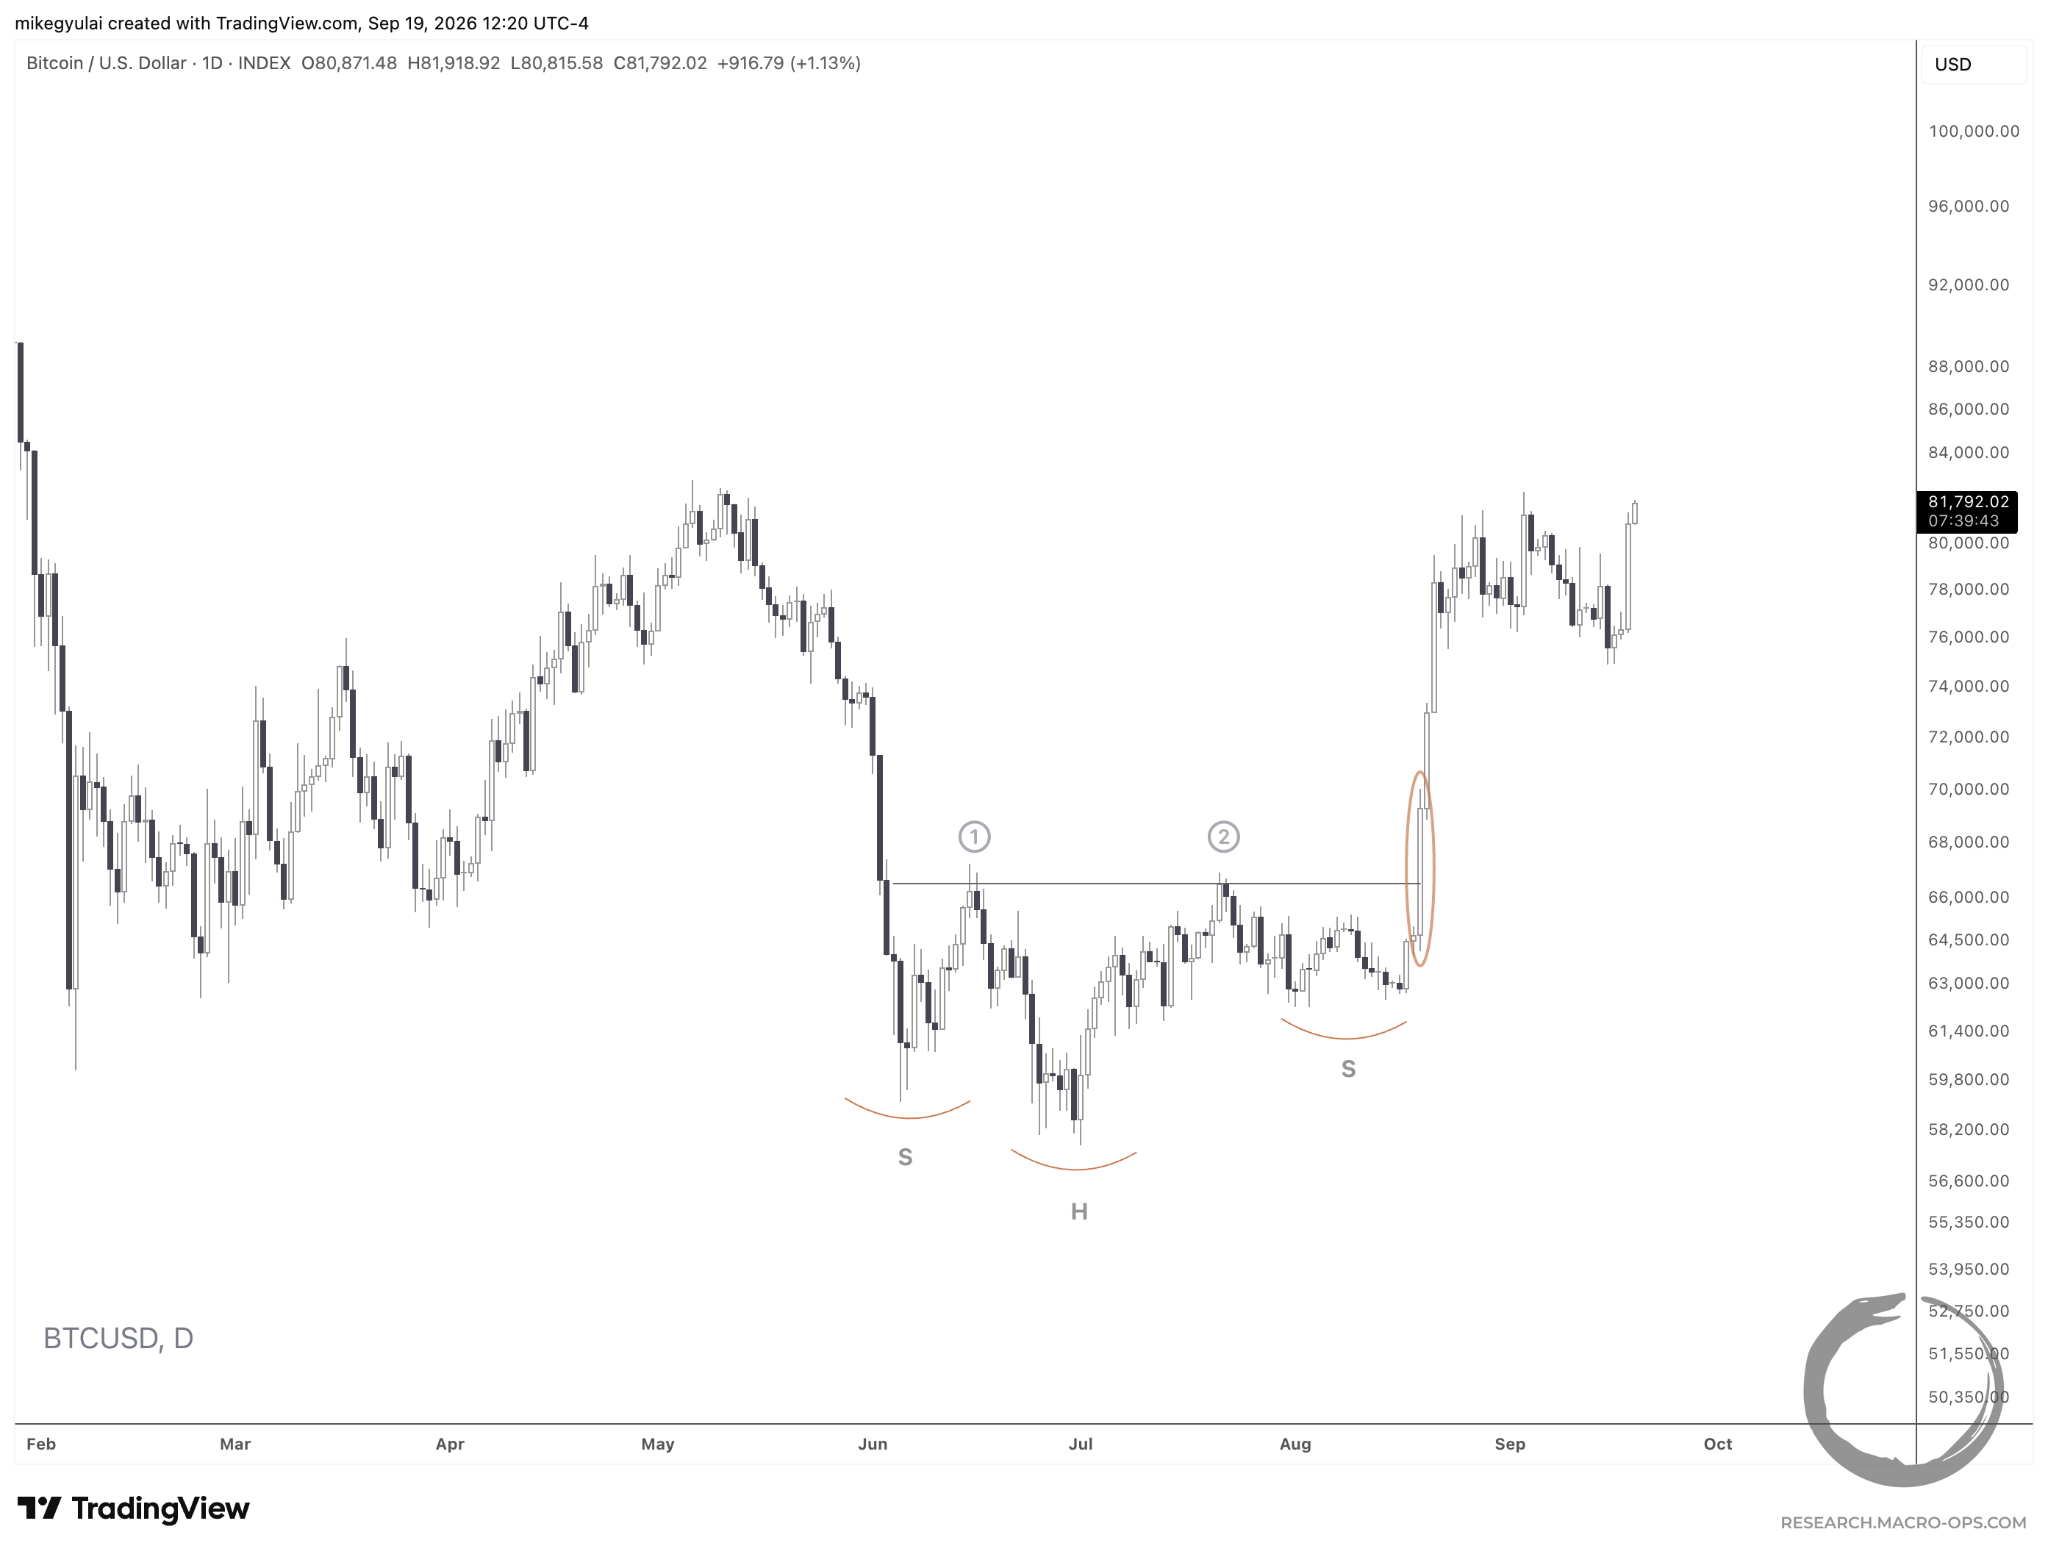
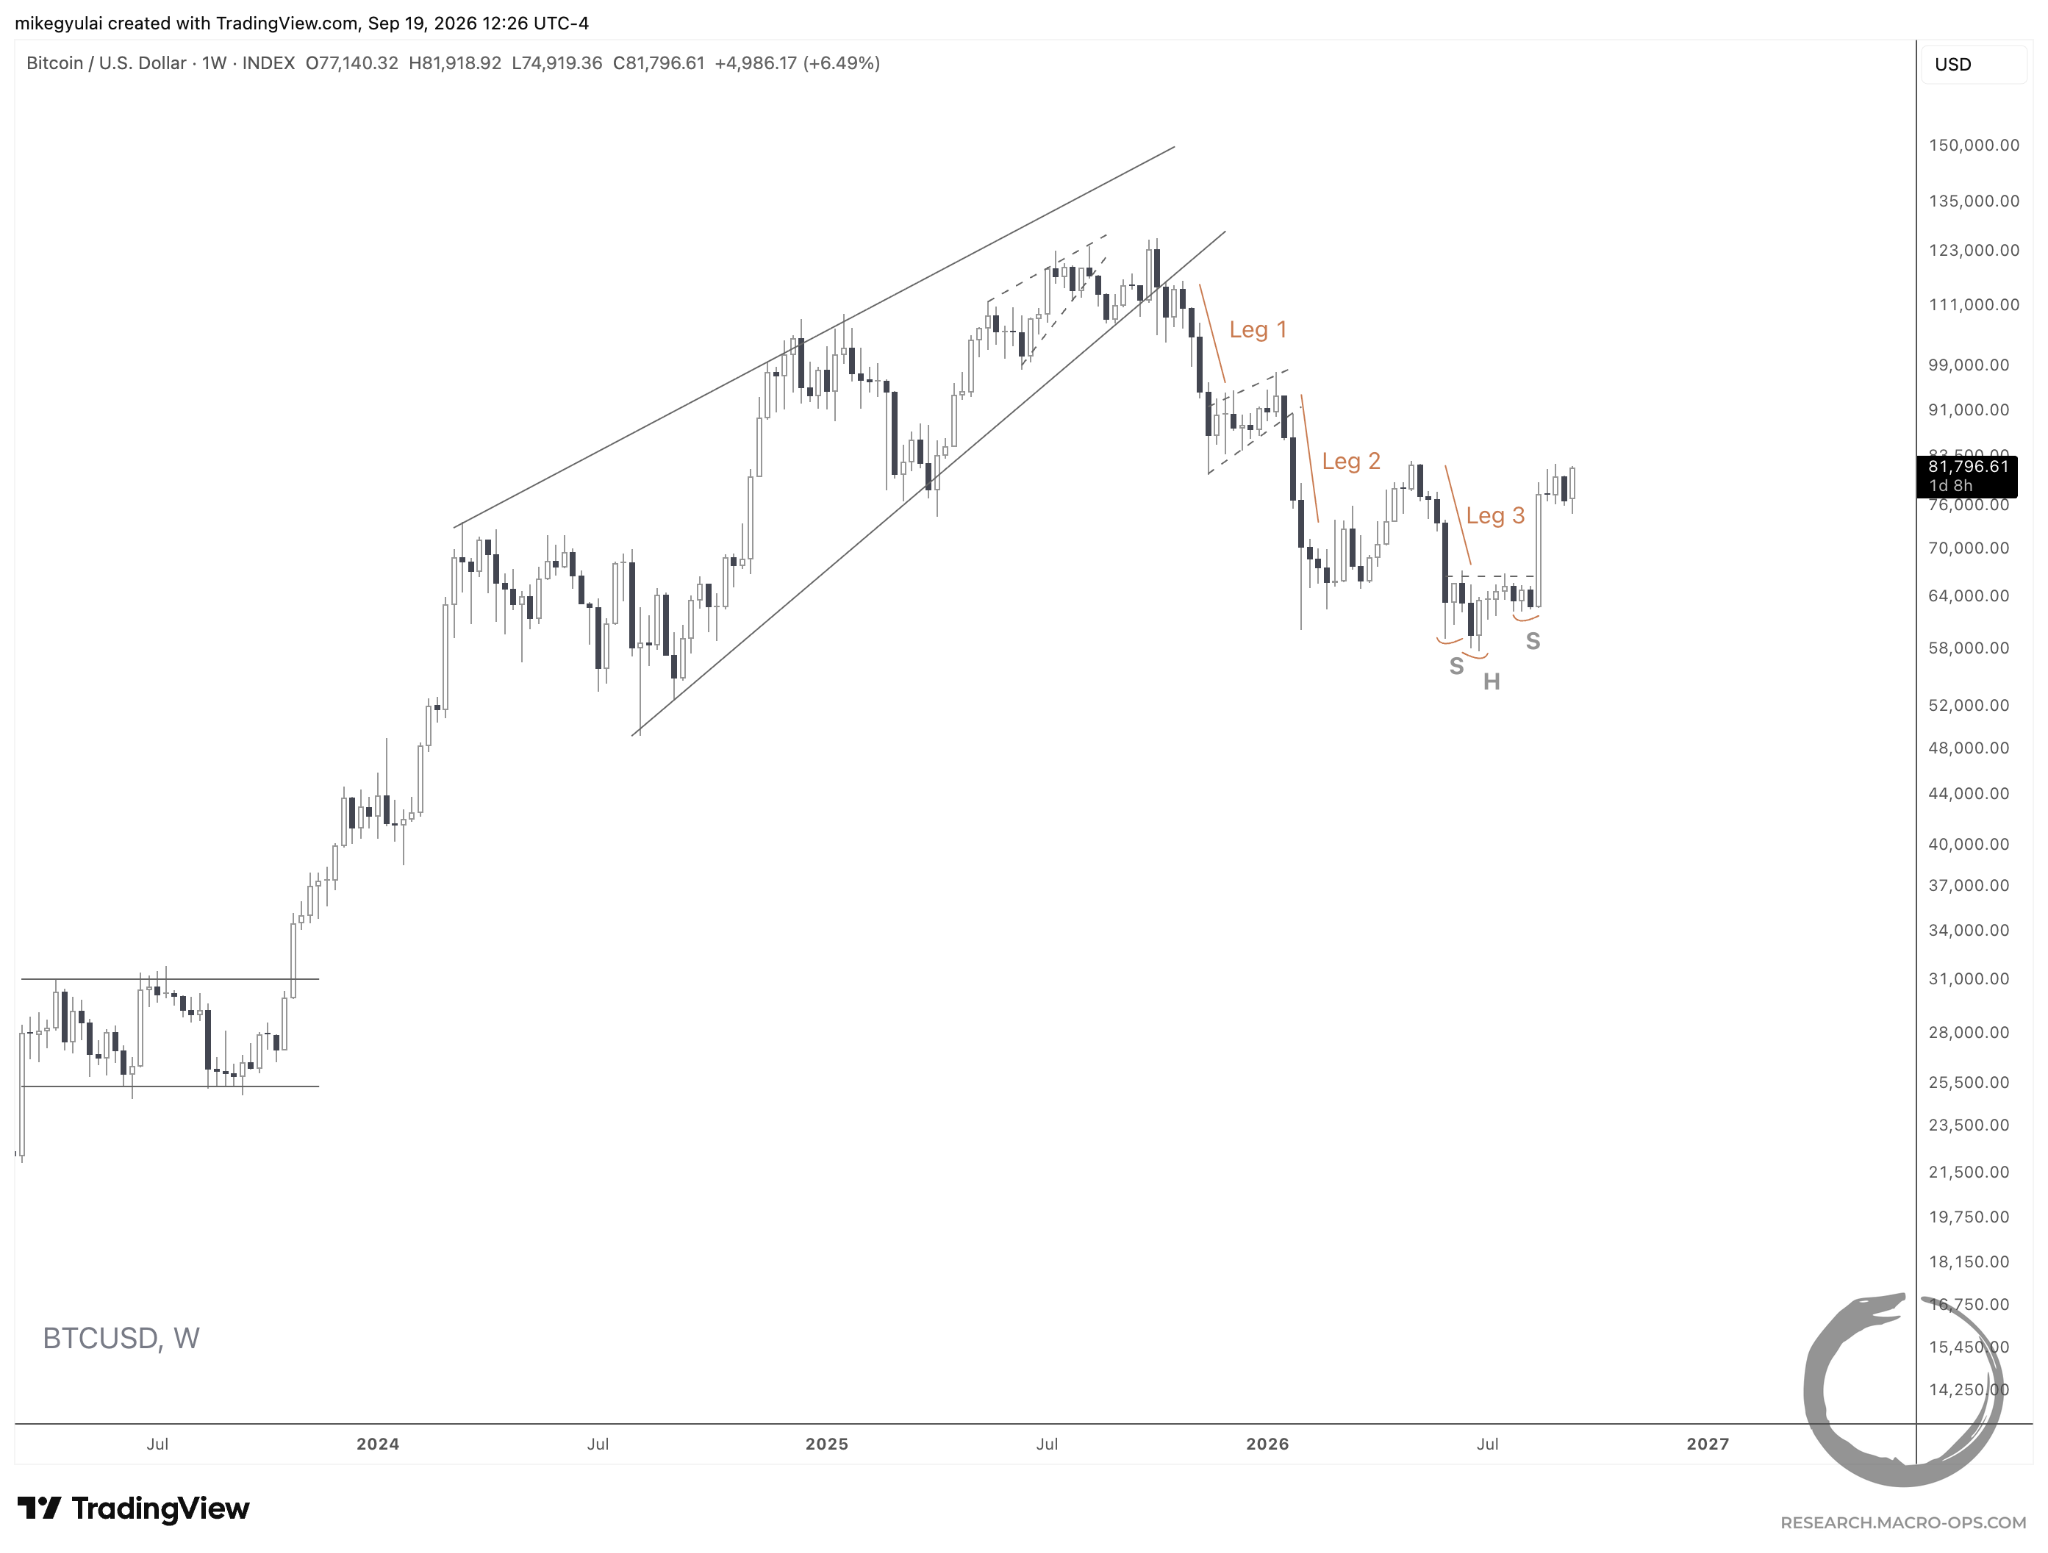
The base formed after a multi-month decline of three volatile legs lower and a bearish turn in sentiment. Price held without new lows through negative headlines, including Strategy’s initial Bitcoin sales (widely read as forced liquidation) and the failure of the Clarity Act. Volatility then compressed ahead of the breakout.
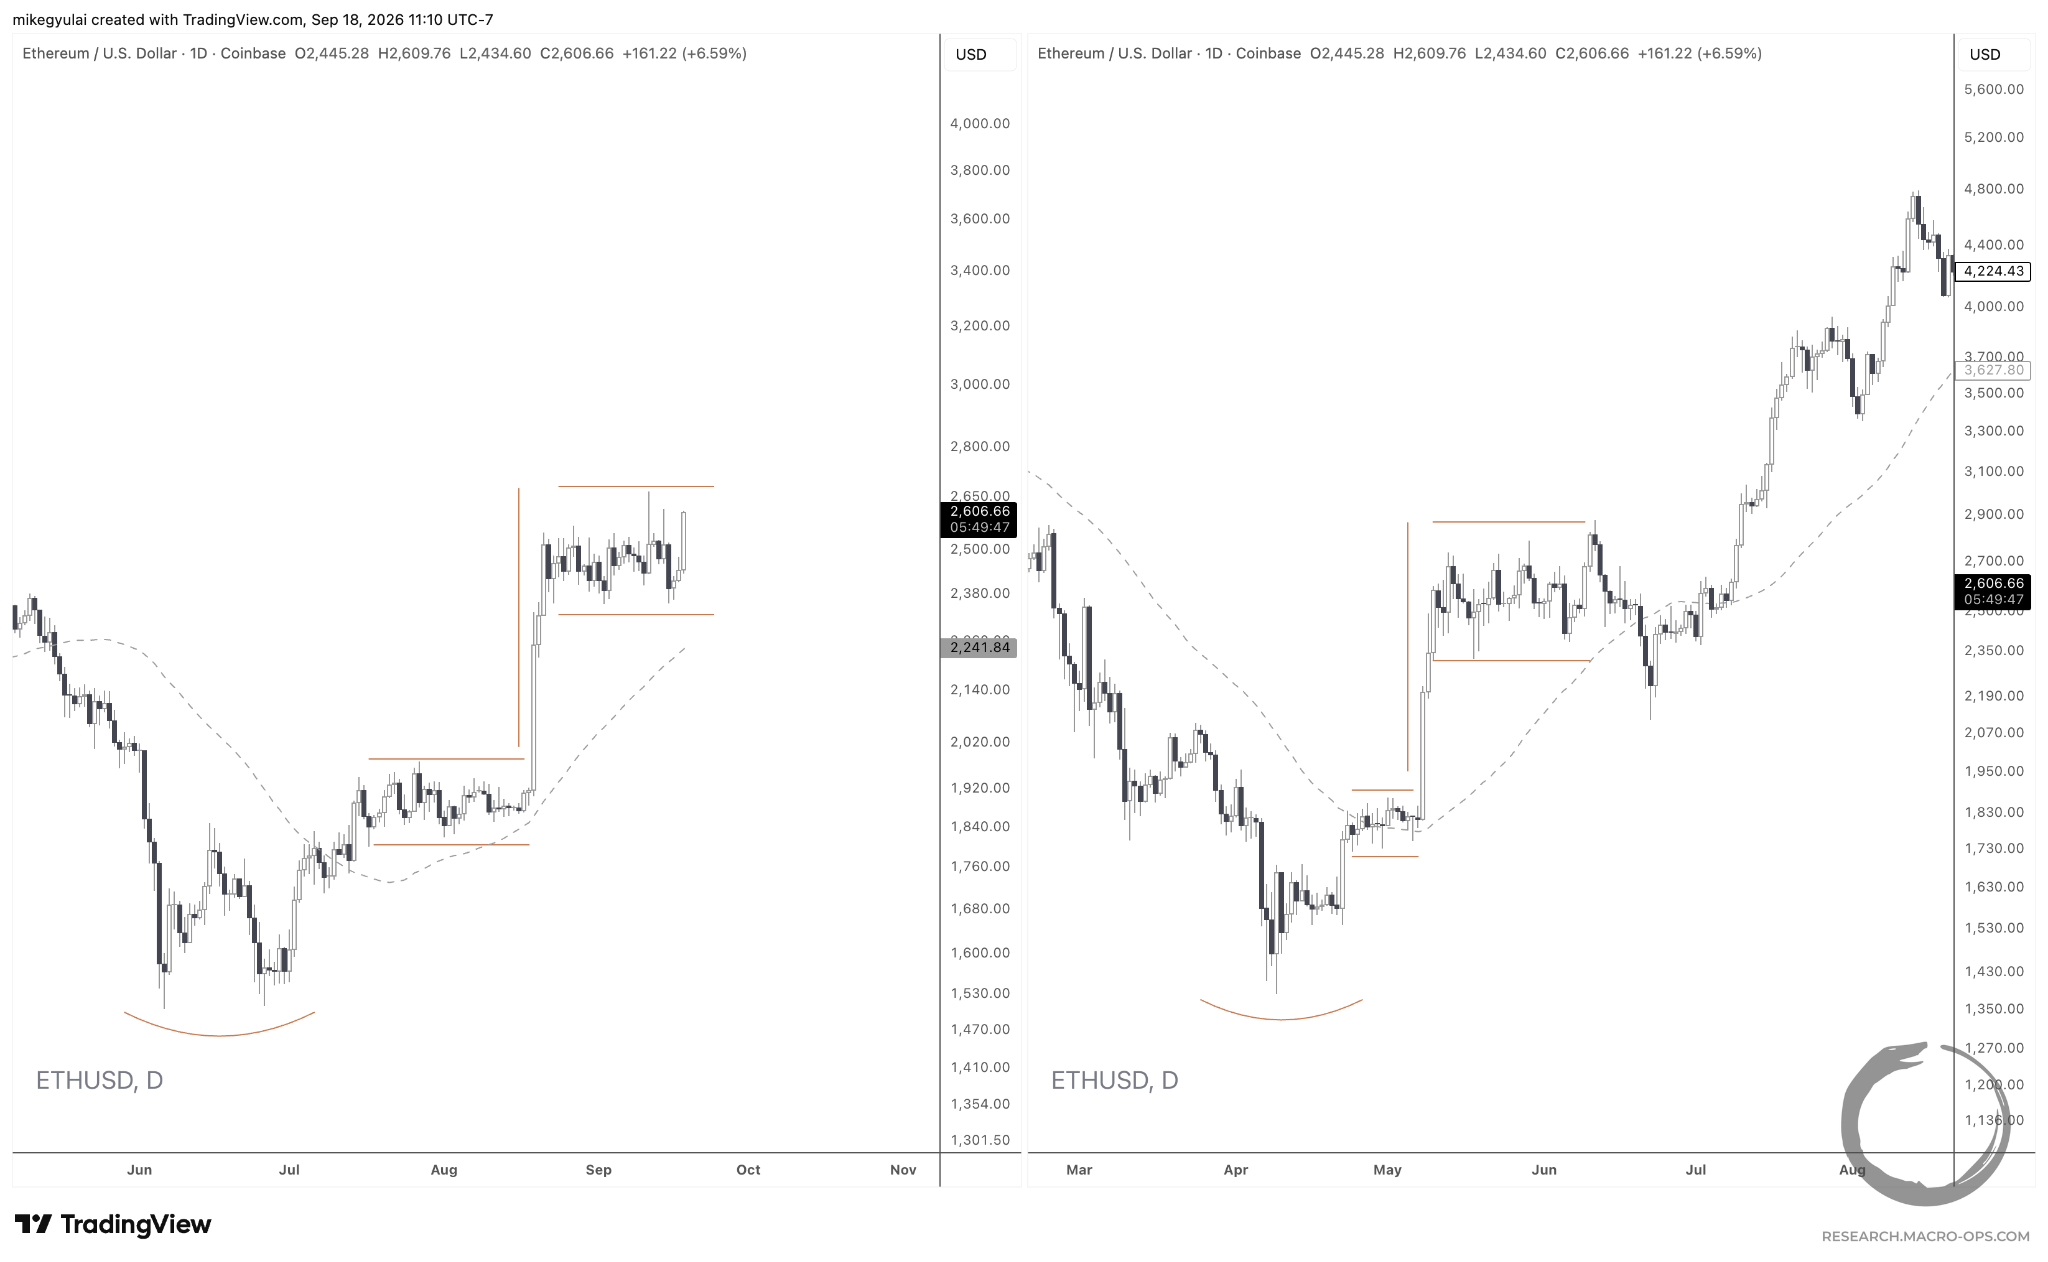
We have expressed the early-cycle-low thesis through Ethereum, which reclaimed the lower boundary of its 2-year ascending triangle after a June breakdown failed to follow through.
As covered in the August 22, 2026, issue, our expectation after a range reclaim was consolidation back at the range midpoint. We are now 4 weeks into it.
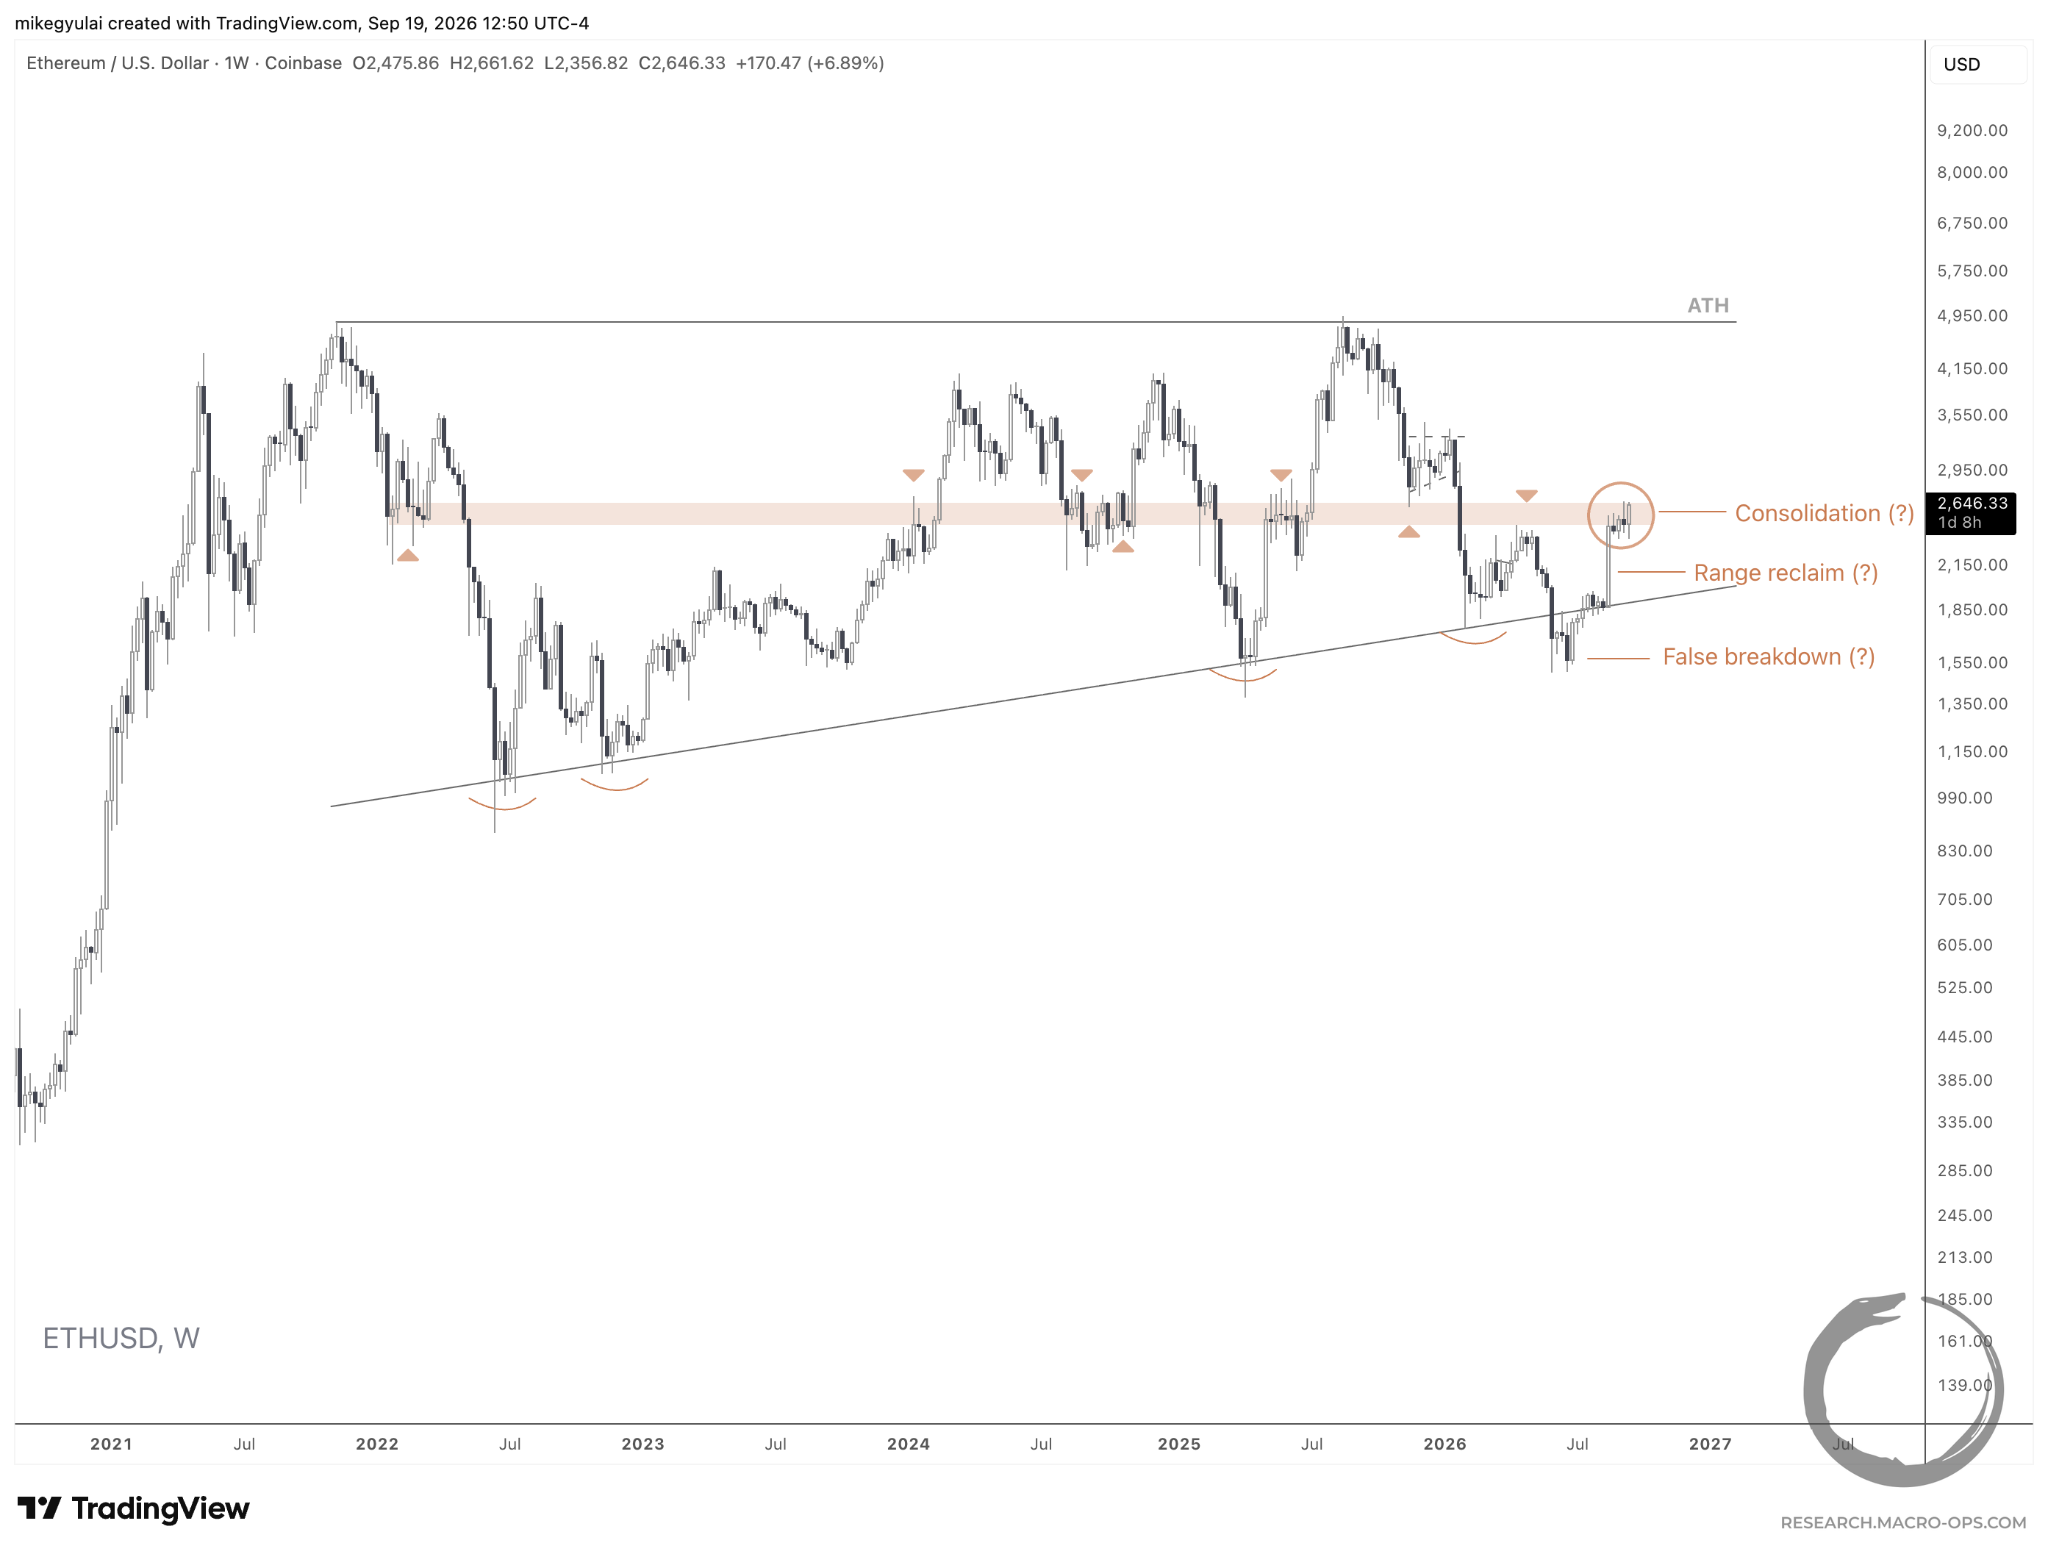
We remain long Ethereum in the Macro Ops portfolio. Its price action currently rhymes with spring 2025. Analogues hold only until they break, but this one gives us a map for a risk-defined, asymmetric add.
Indices, Energy & Ags
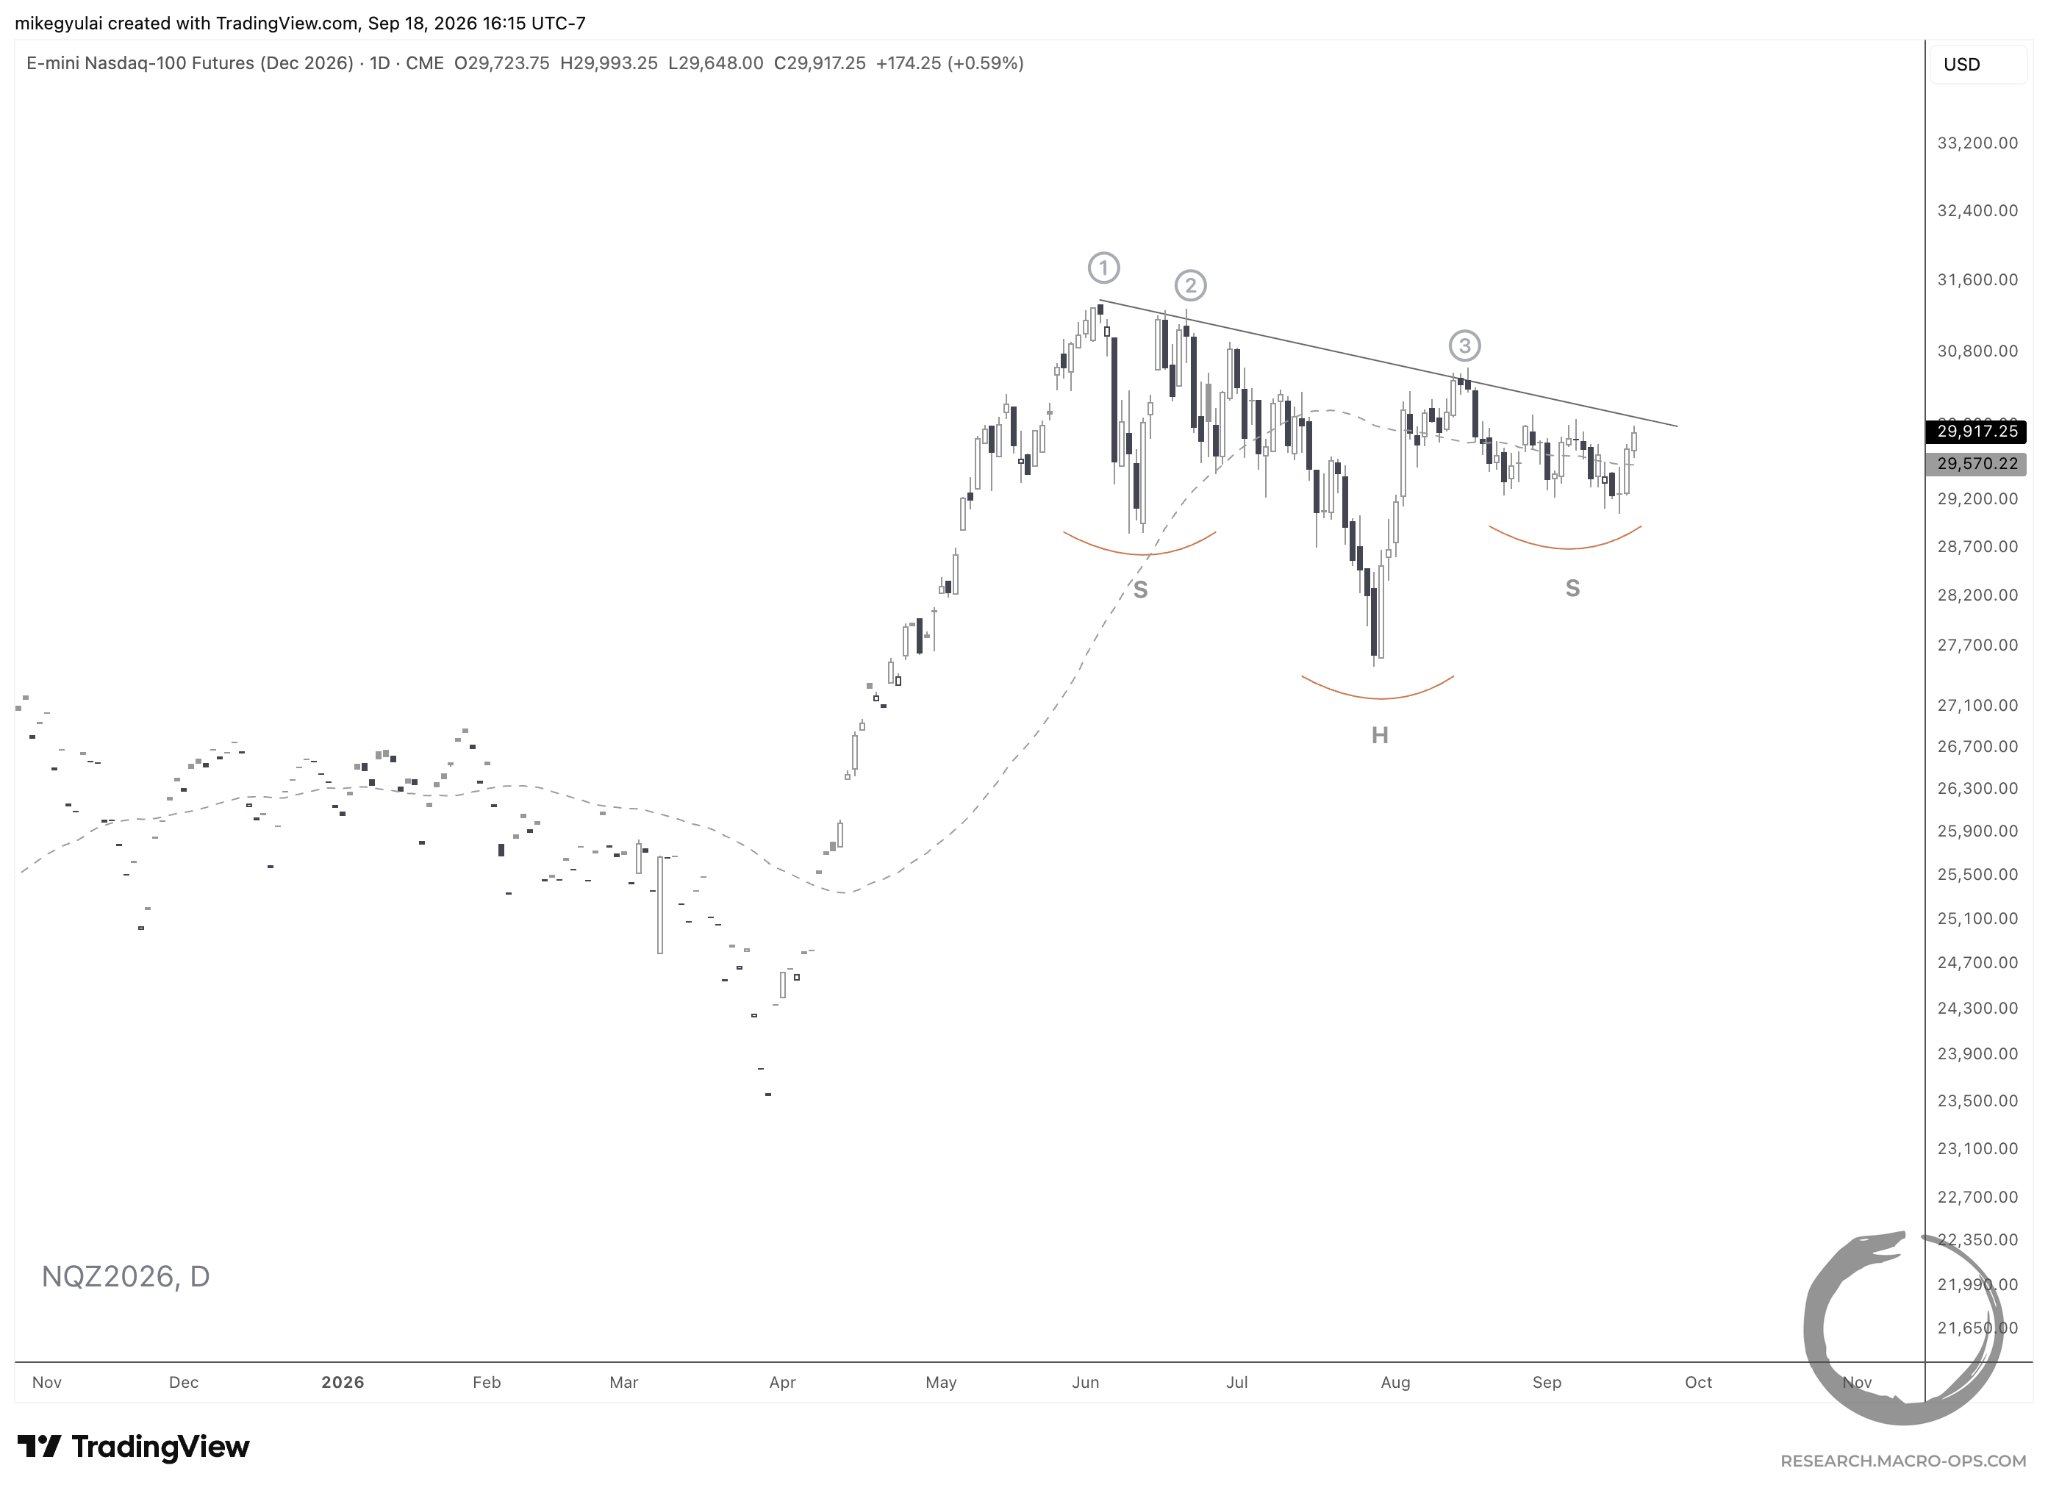
Despite higher oil and higher rates, equities have held up. The case could be made that the Nasdaq has formed a 3.5-month head-and-shoulders continuation on the daily timeframe. Equities are notorious for backing and filling. Add to that a downward-sloping neckline and this would make for a challenging pattern to trade.
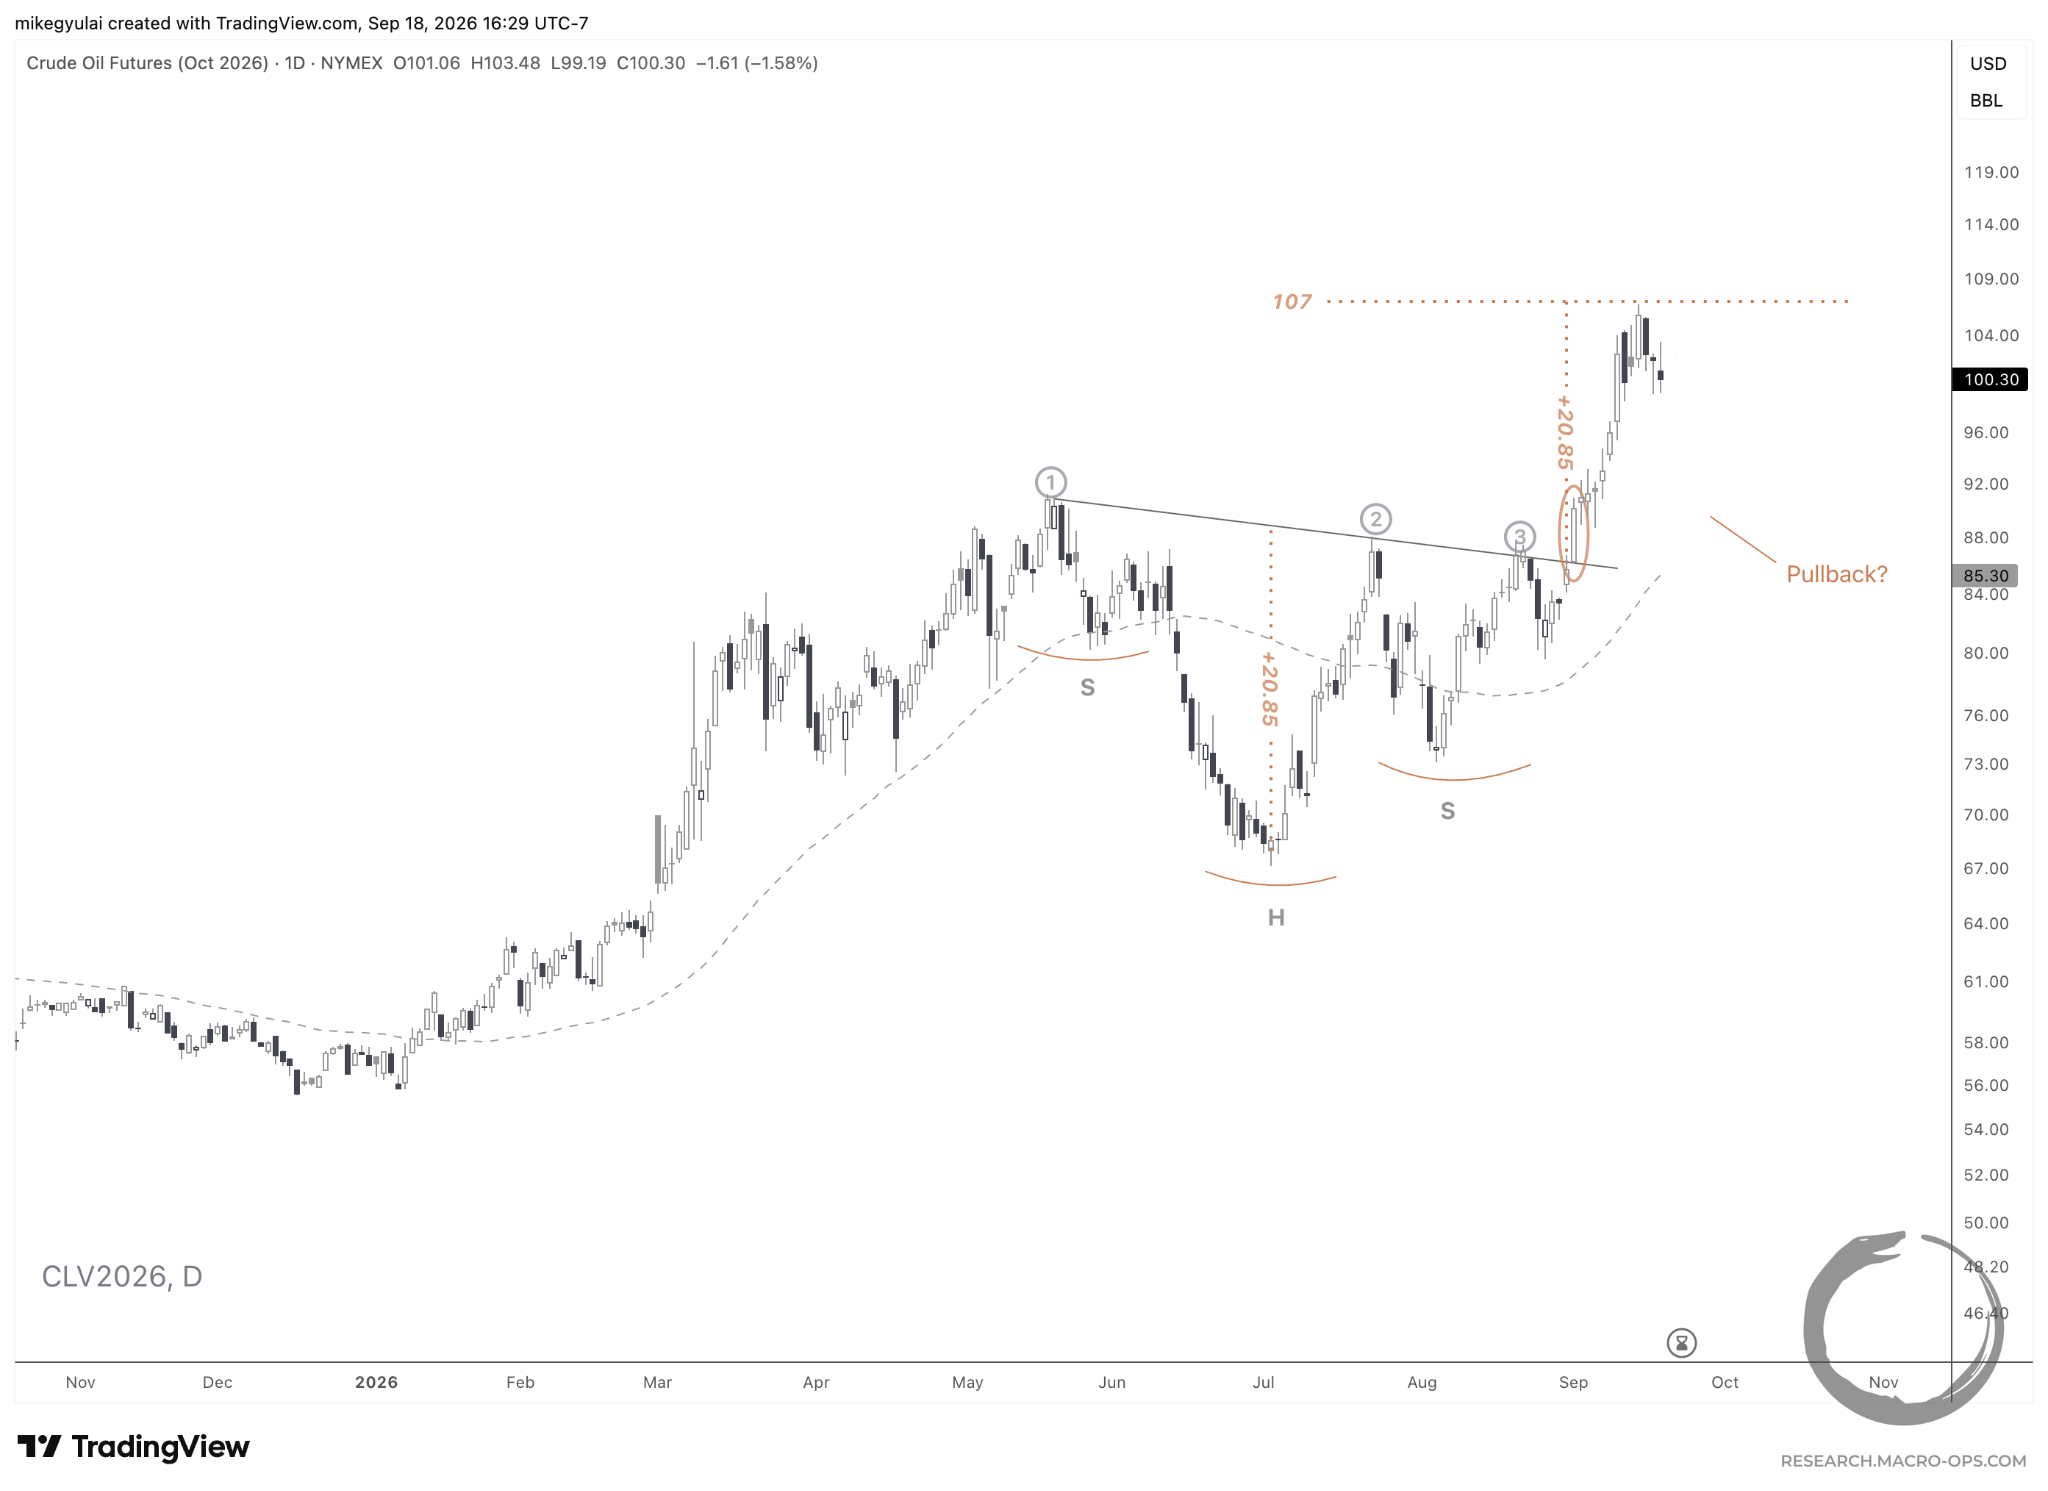
October crude oil inched higher to start the week before roundtripping the move into the week’s end. Price has remained sticky at the 100 level following crude’s September 1 breakout from its 3.5-month head-and-shoulders continuation. We are long December Brent in the Macro Ops portfolio.
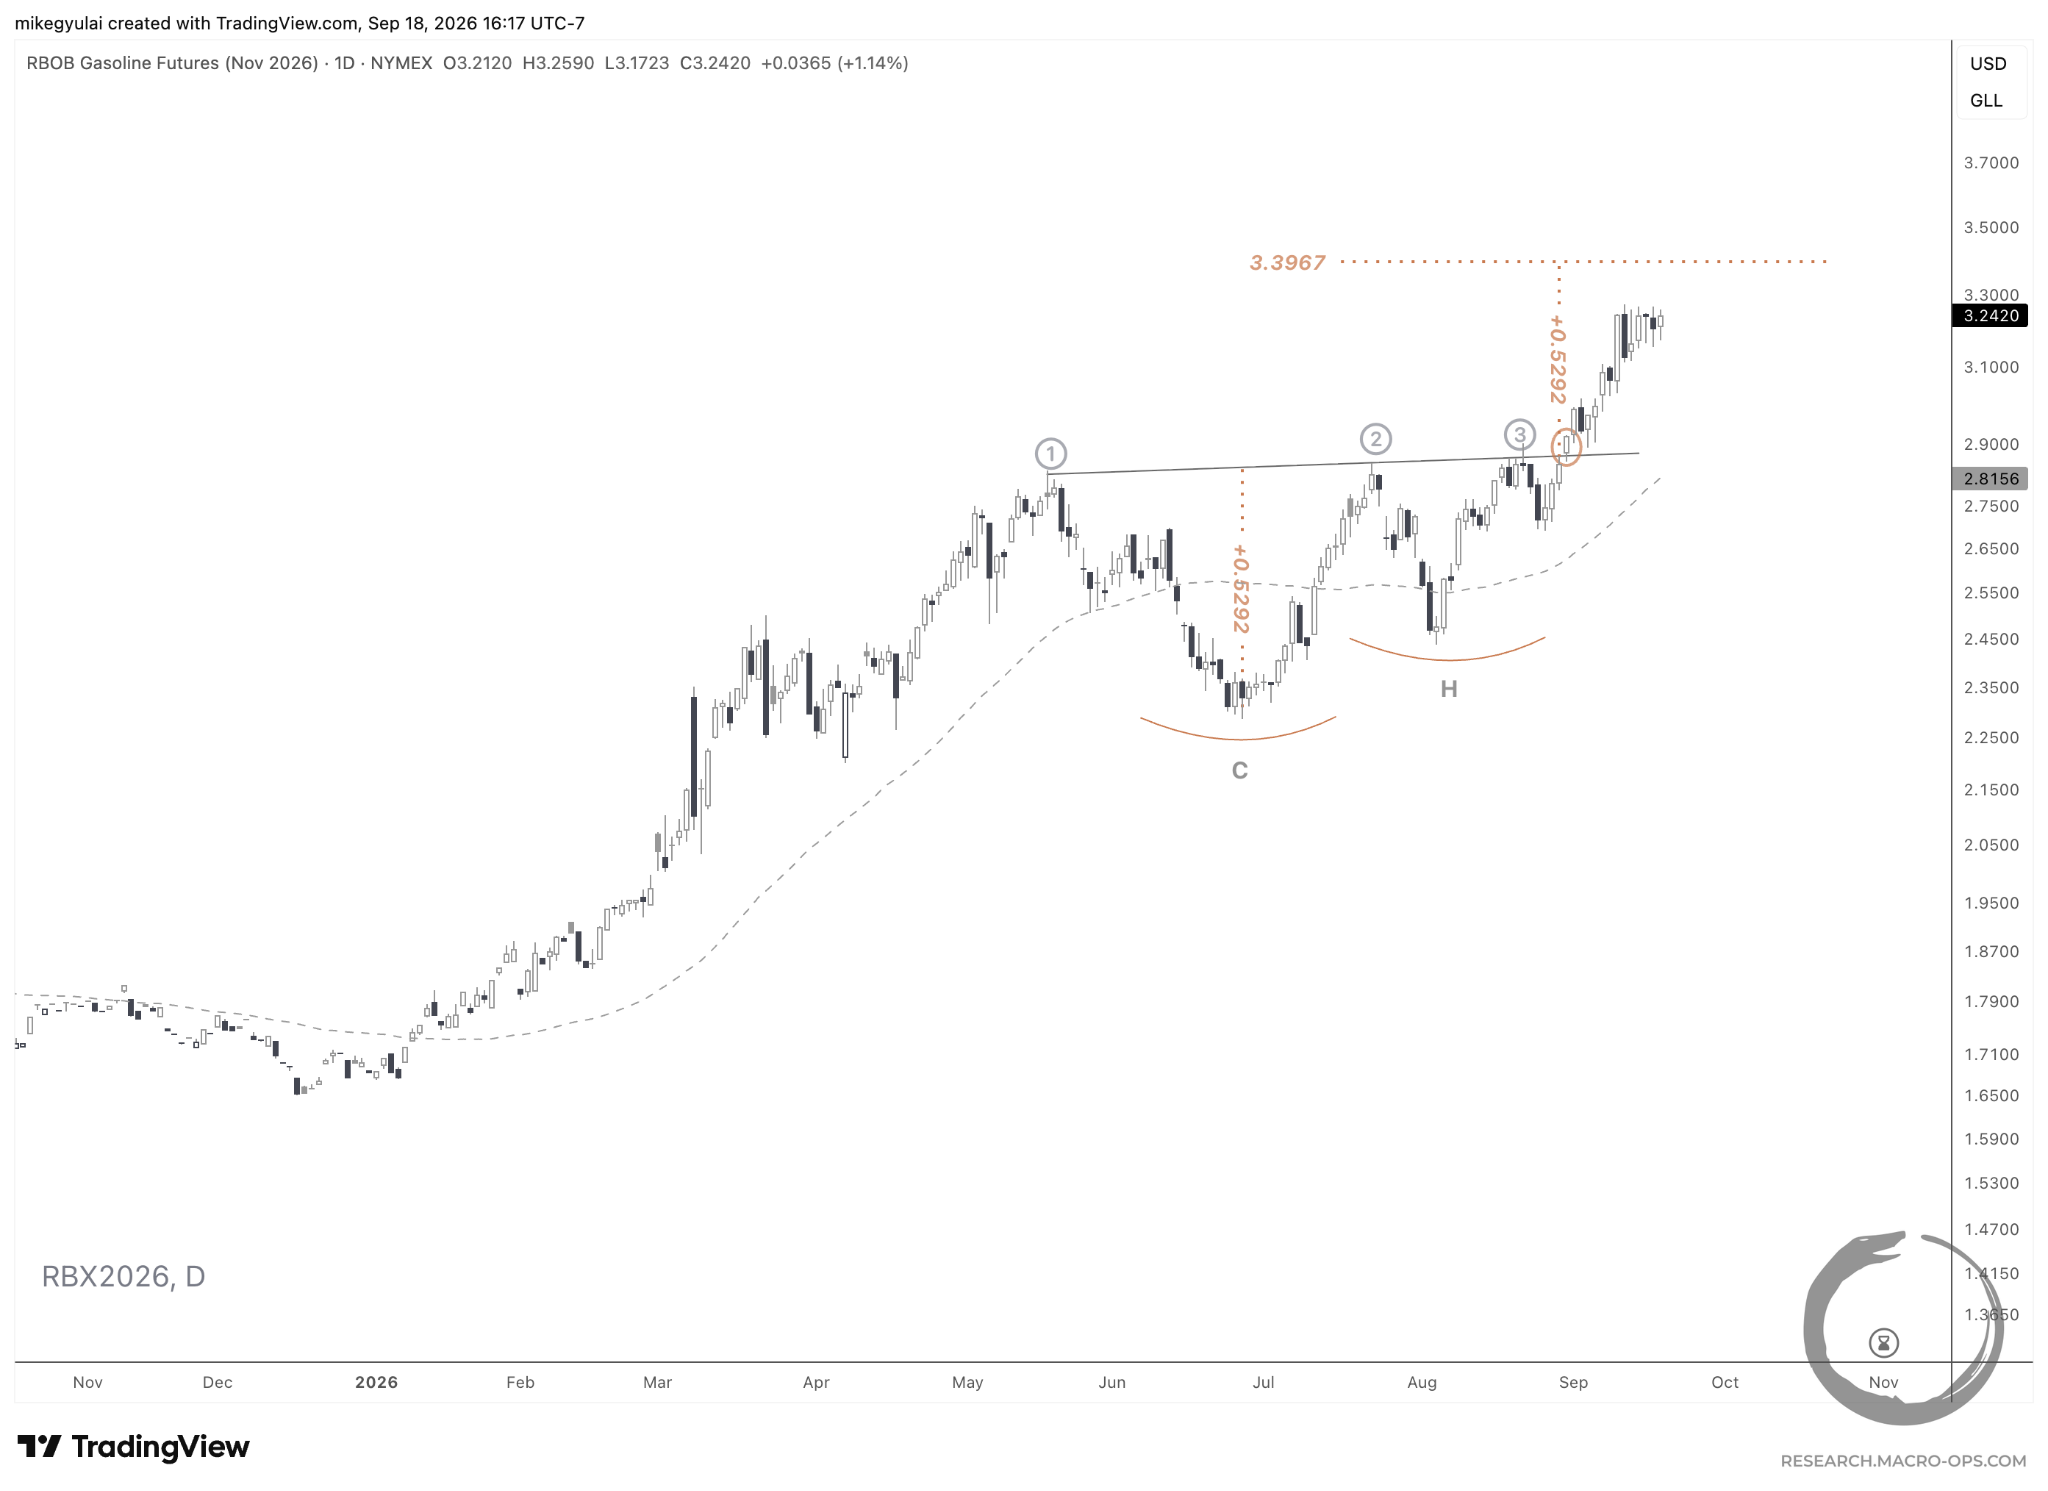
November RBOB gasoline held up better still, forming a tight pennant across the week and closing near its highs.
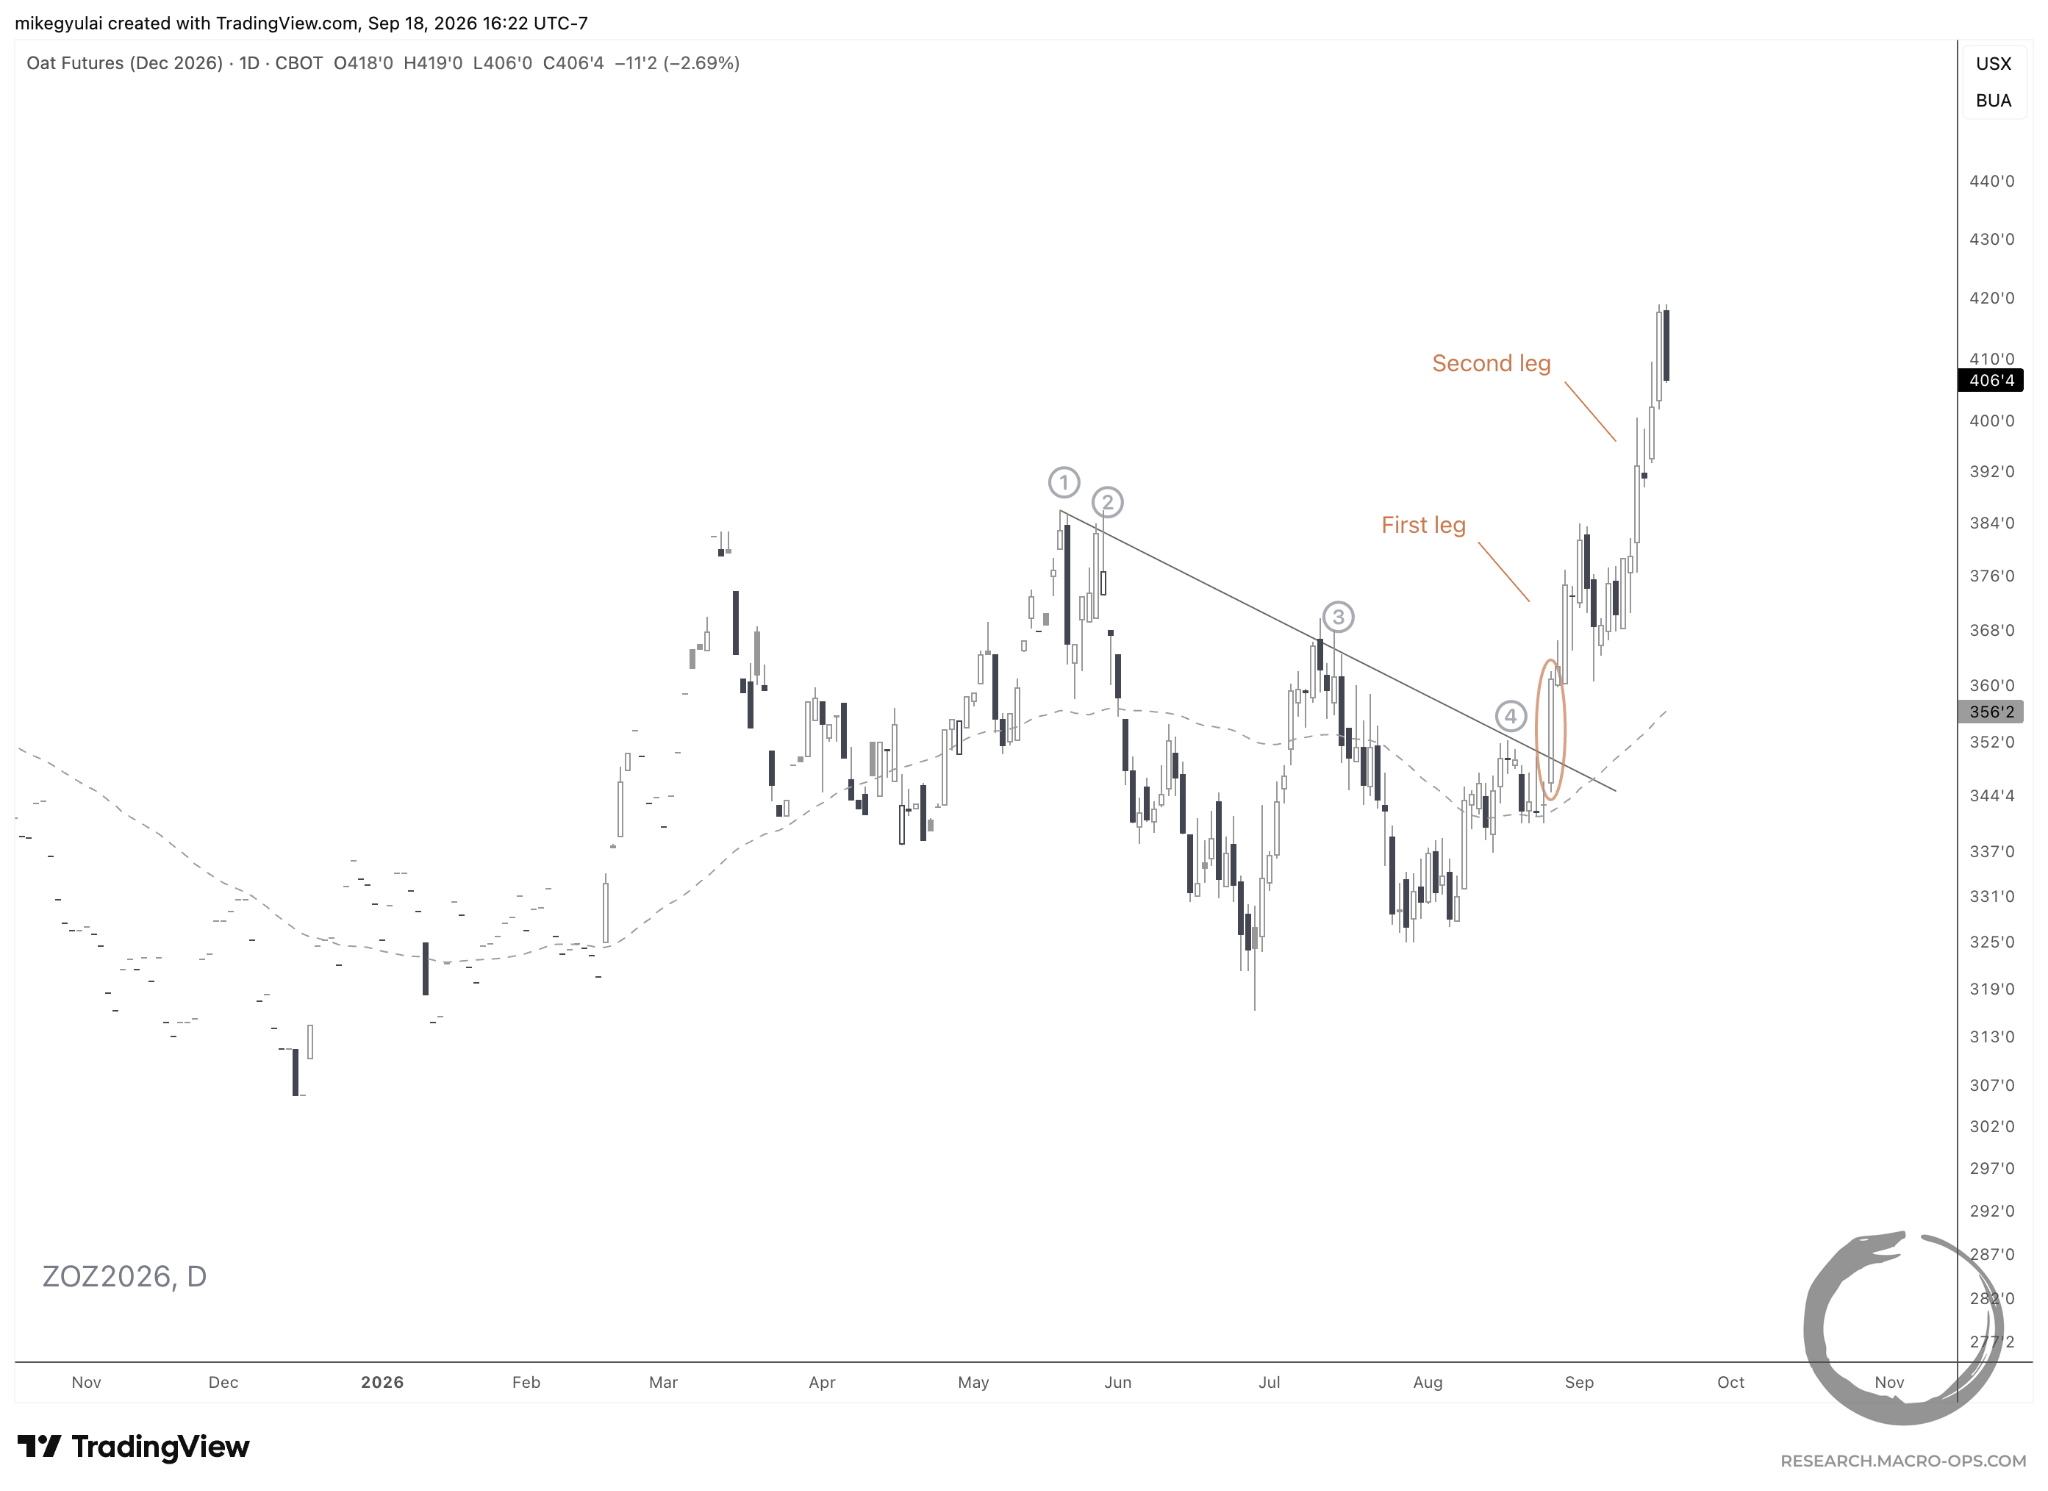
December oats put in an impulsive second leg last week after a 2-week consolidation, following their initial August breakout from a 3-month multi-point trendline highlighted in the August 29, 2026, issue.
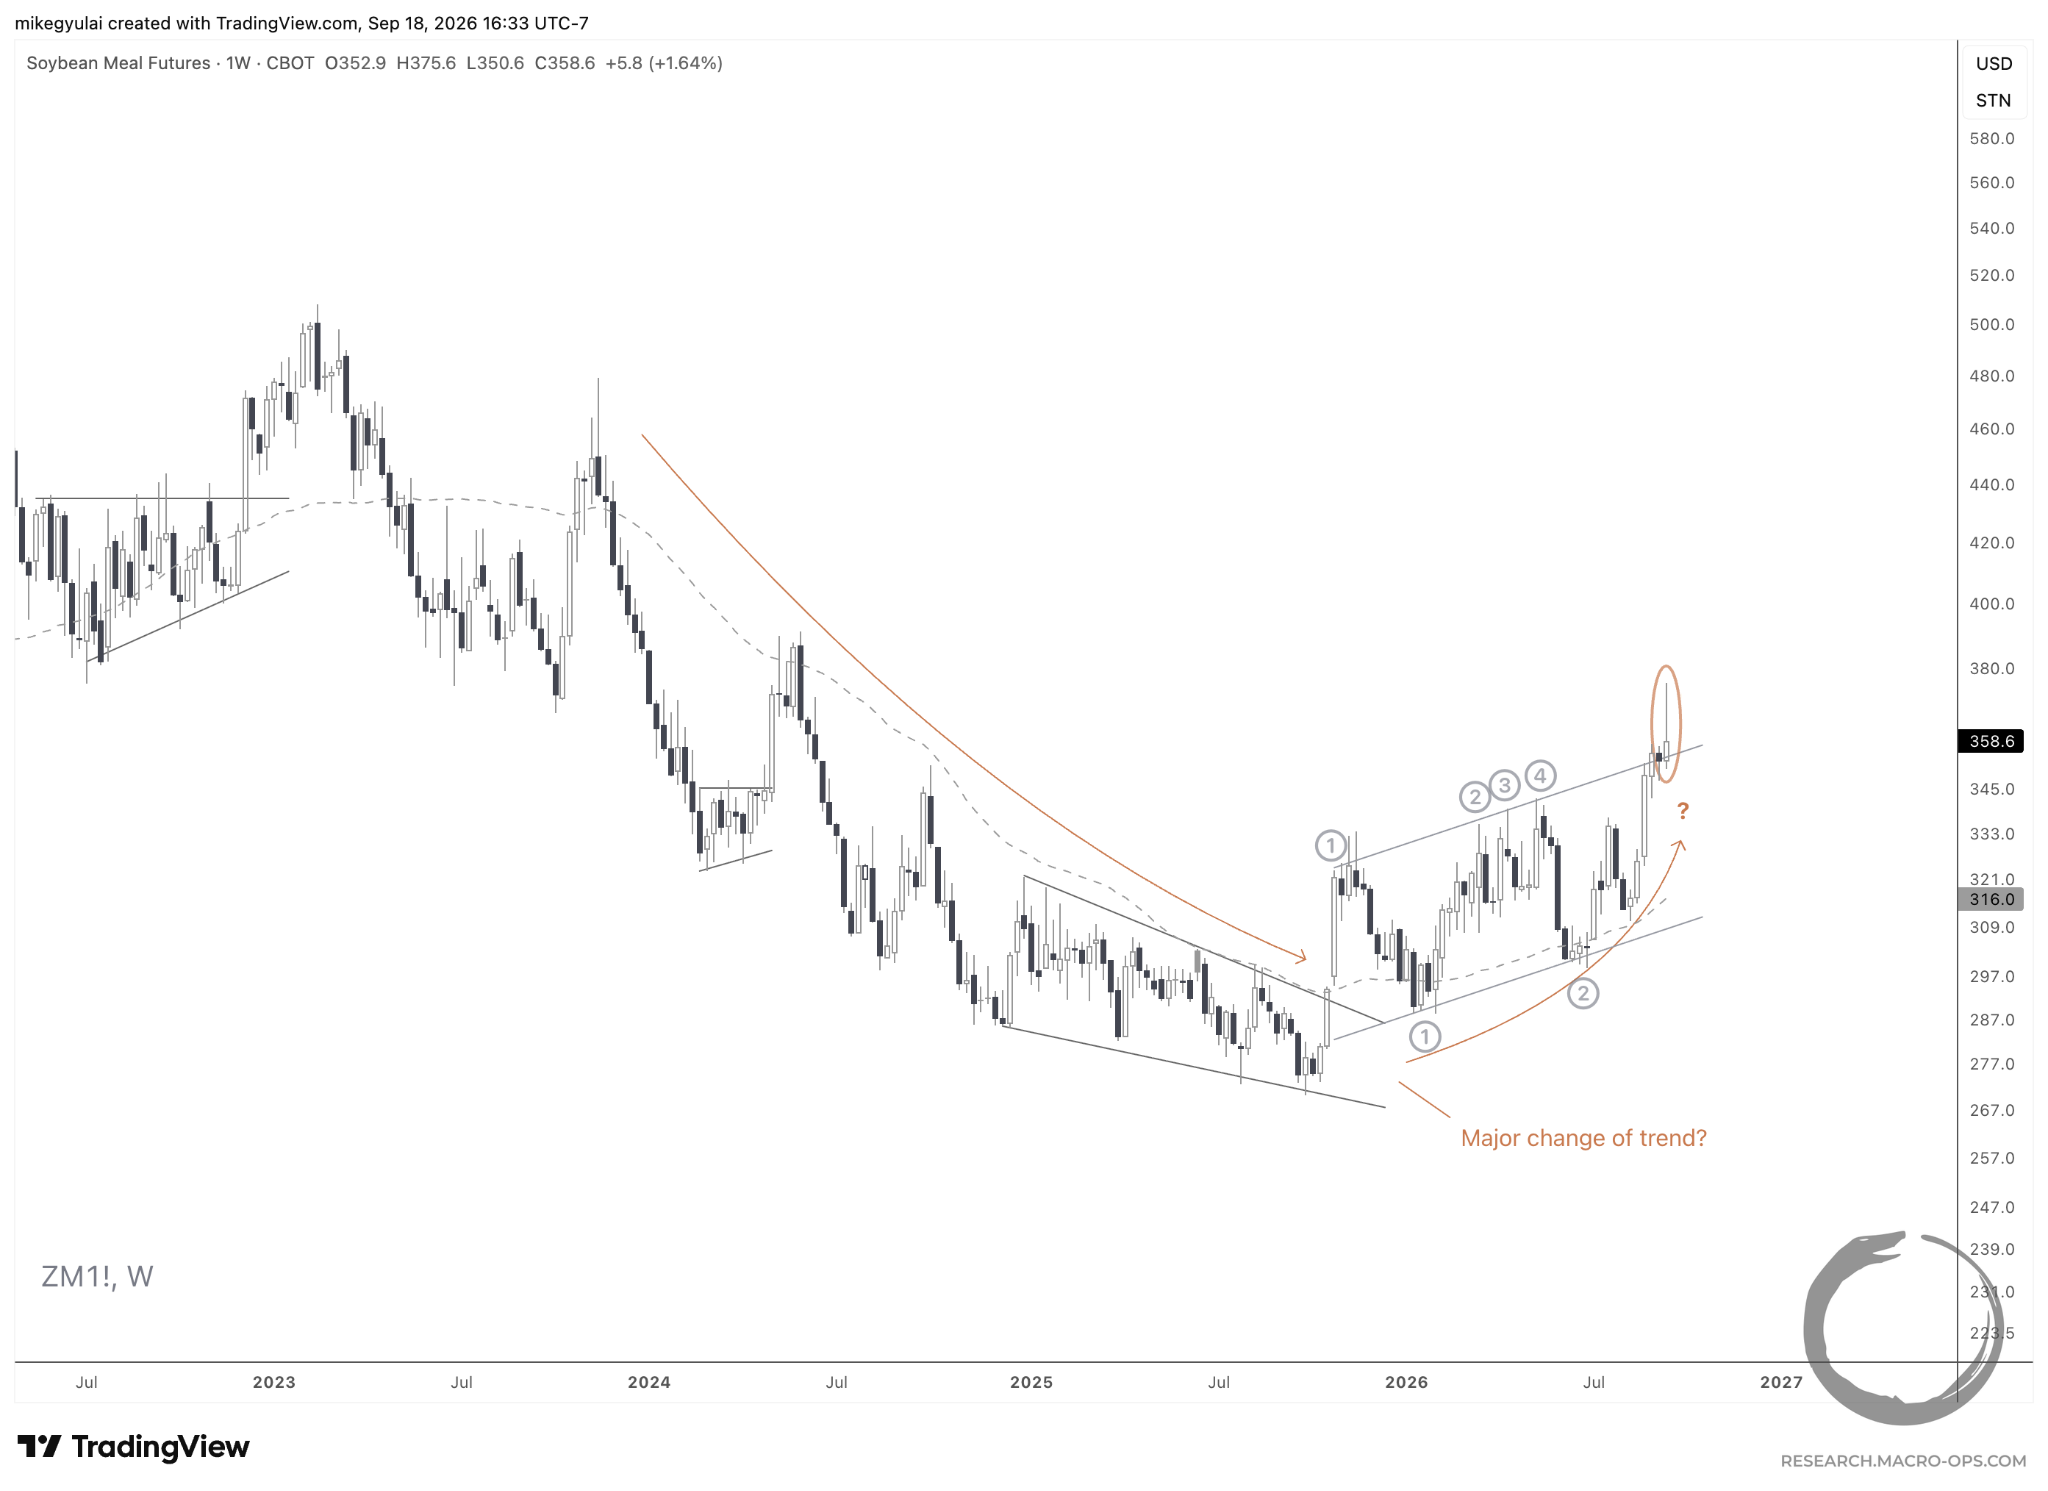
Soybean meal futures broke out of the 10-month ascending channel we’ve tracked most of this year, then reversed midweek to form a sizable upper wick on the weekly chart. The initial price acceleration confirmed the importance of the level for market participants. While sellers stepped in, price closed above the upper boundary, offering the possibility of a resistance-turned-support retest.
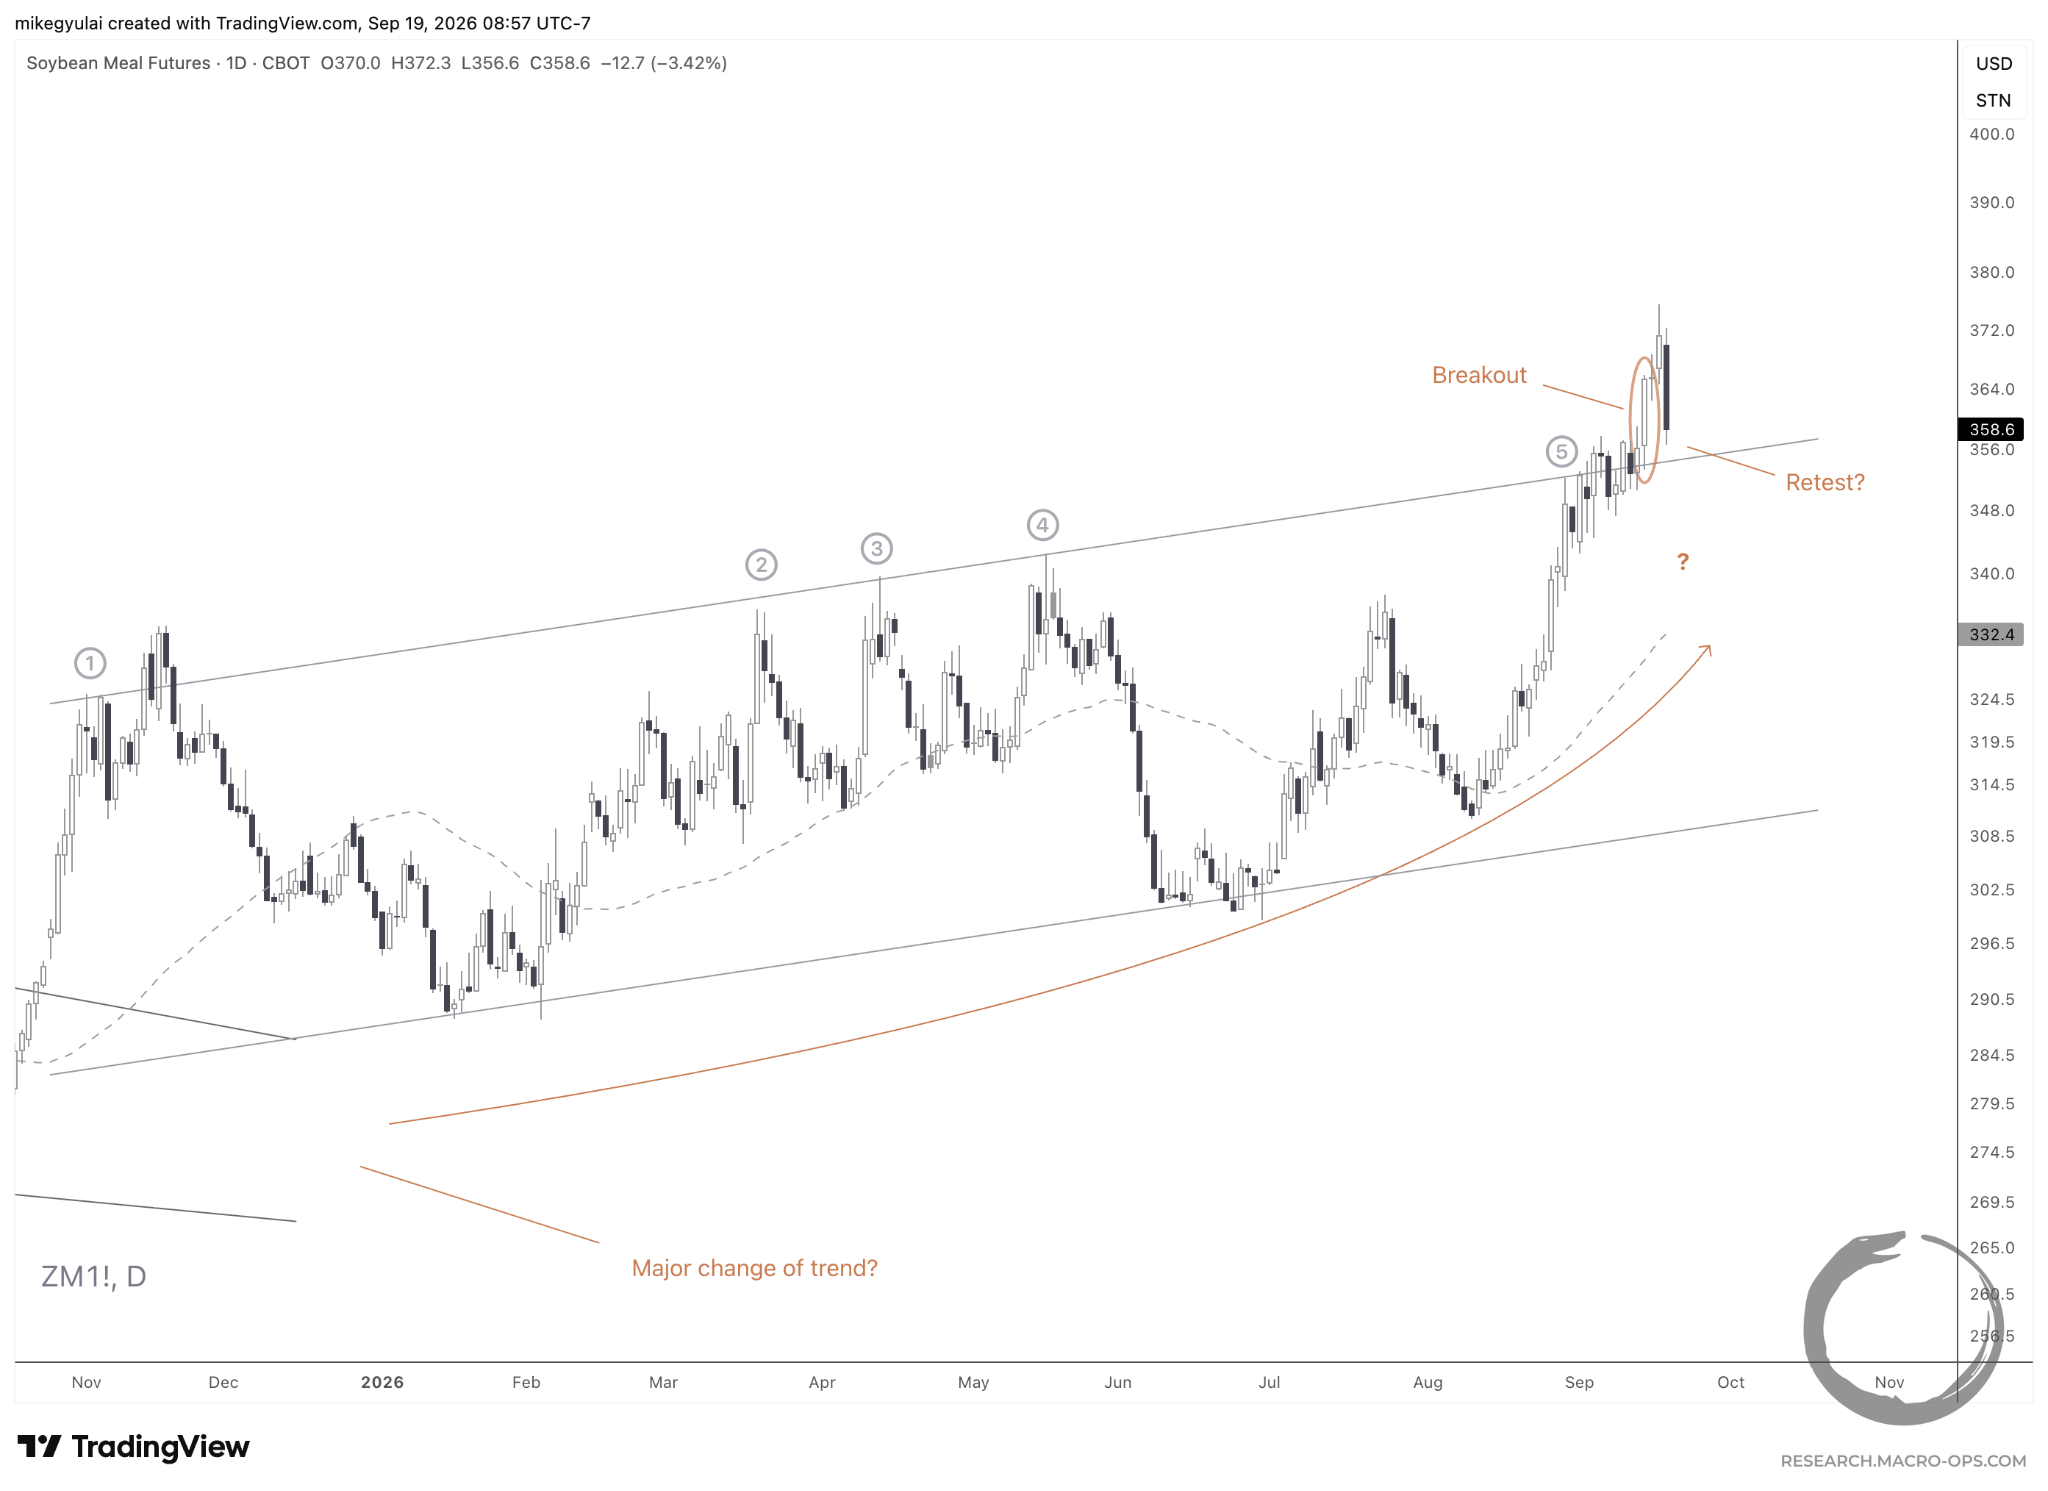
The retest scenario is clearer on the daily timeframe. The continuous chart is shown here.
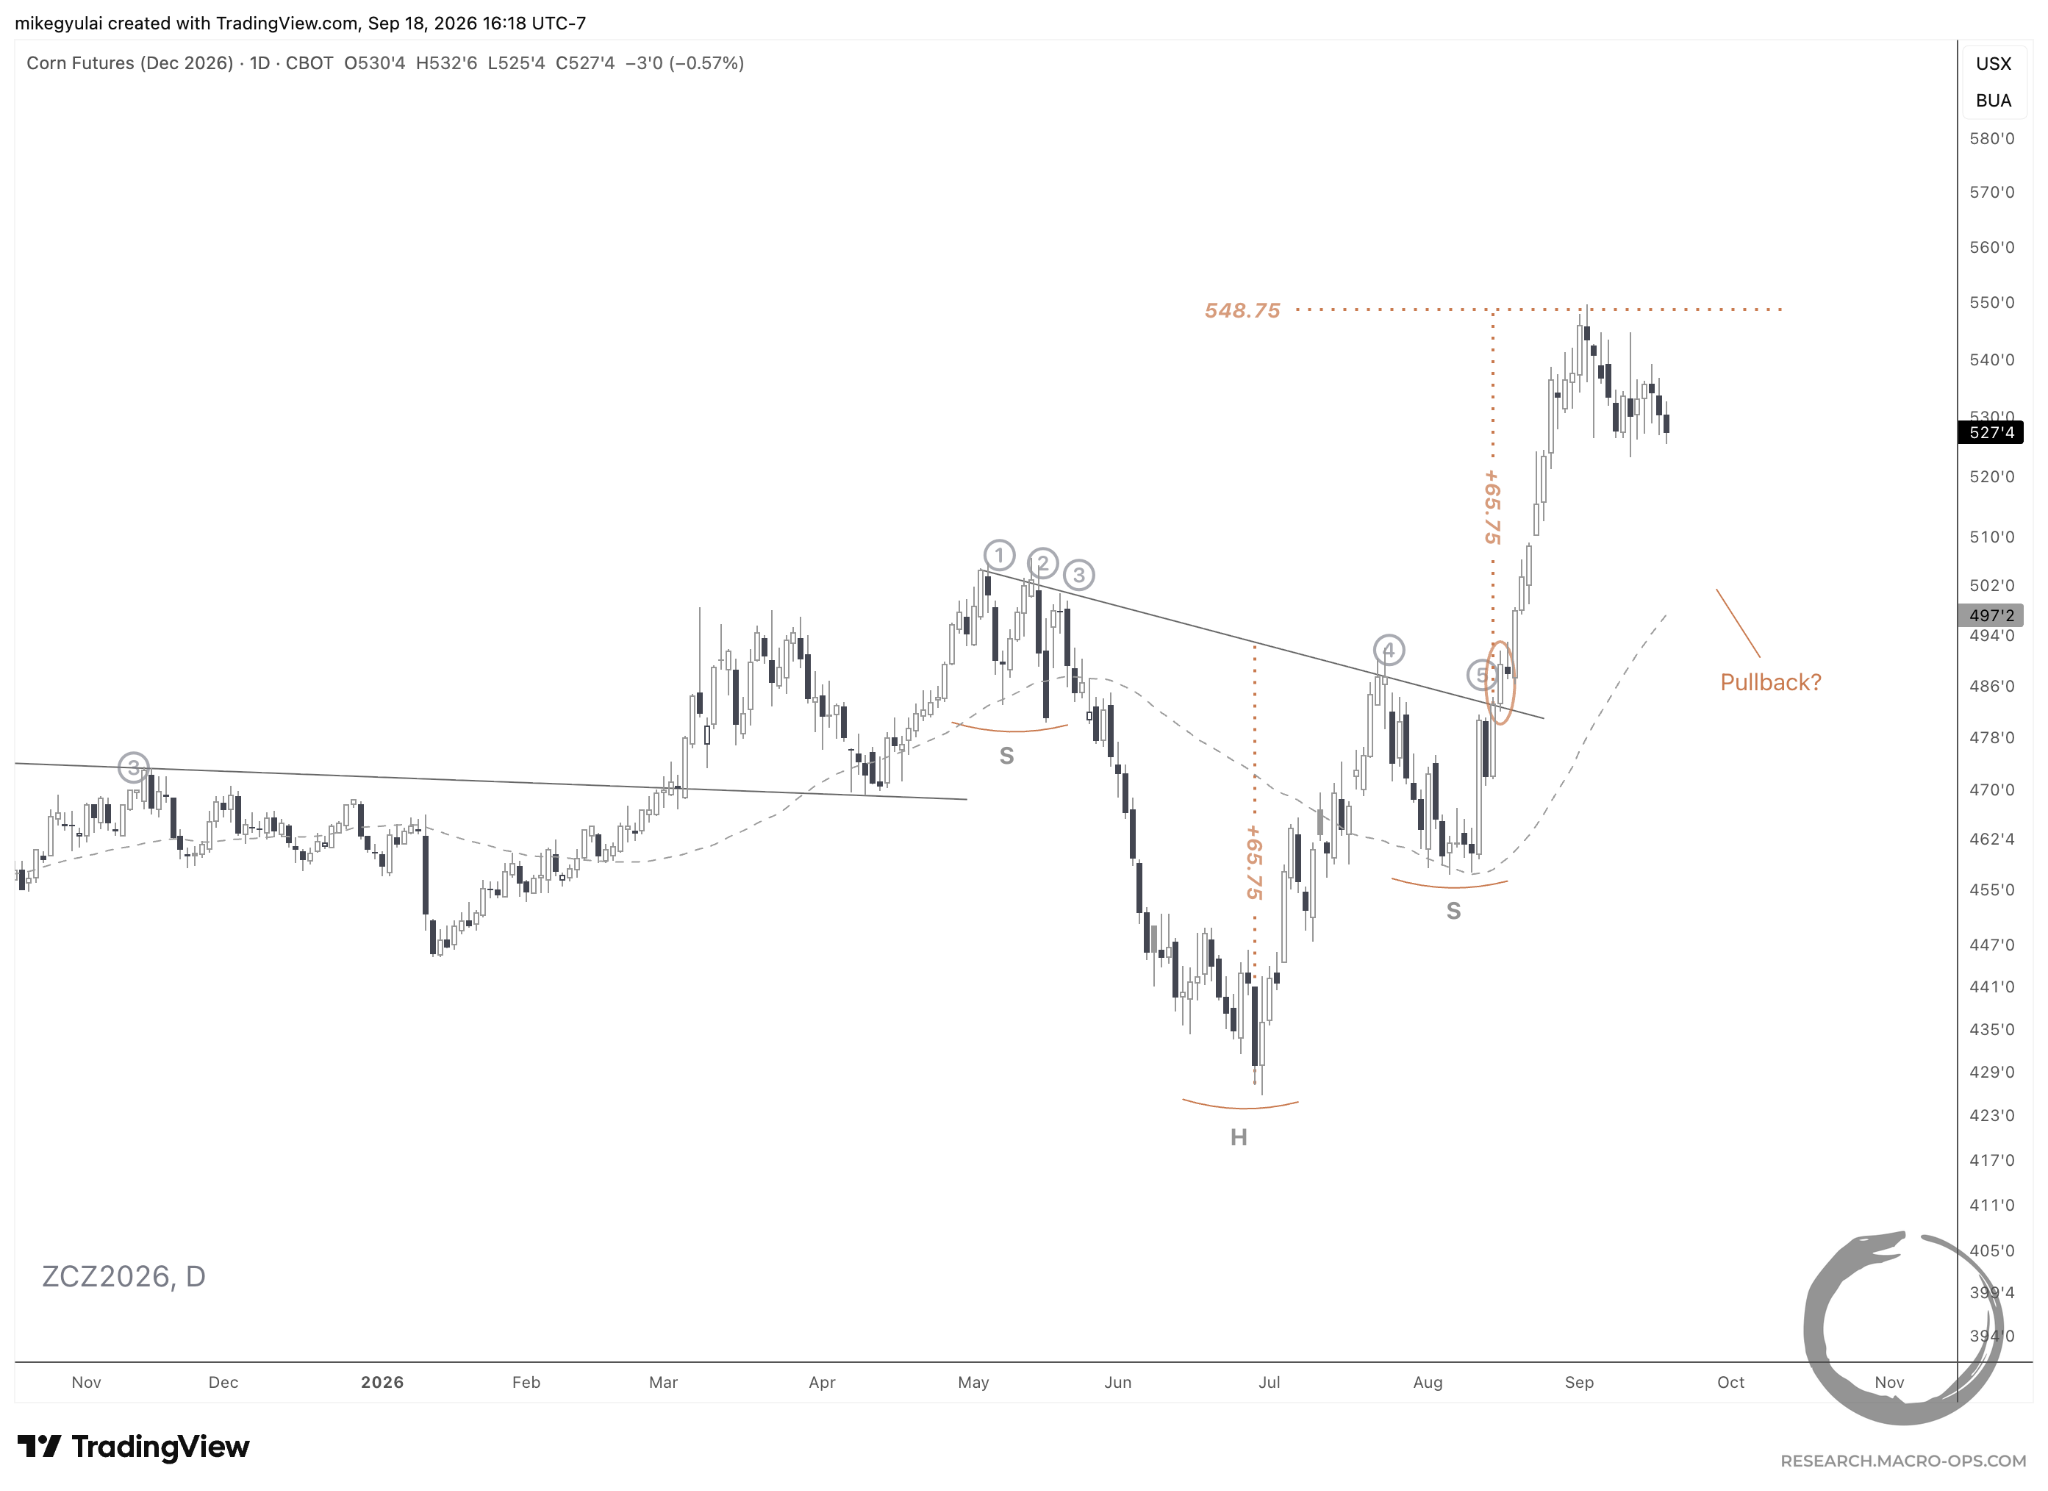
As a reminder, we are eyeing potential pullbacks in the commodities space, including corn futures, which drifted back toward their rising 50-day SMA after reaching the 1x measured move target of their 3-month head-and-shoulders continuation. We took profits on that leg earlier this month.
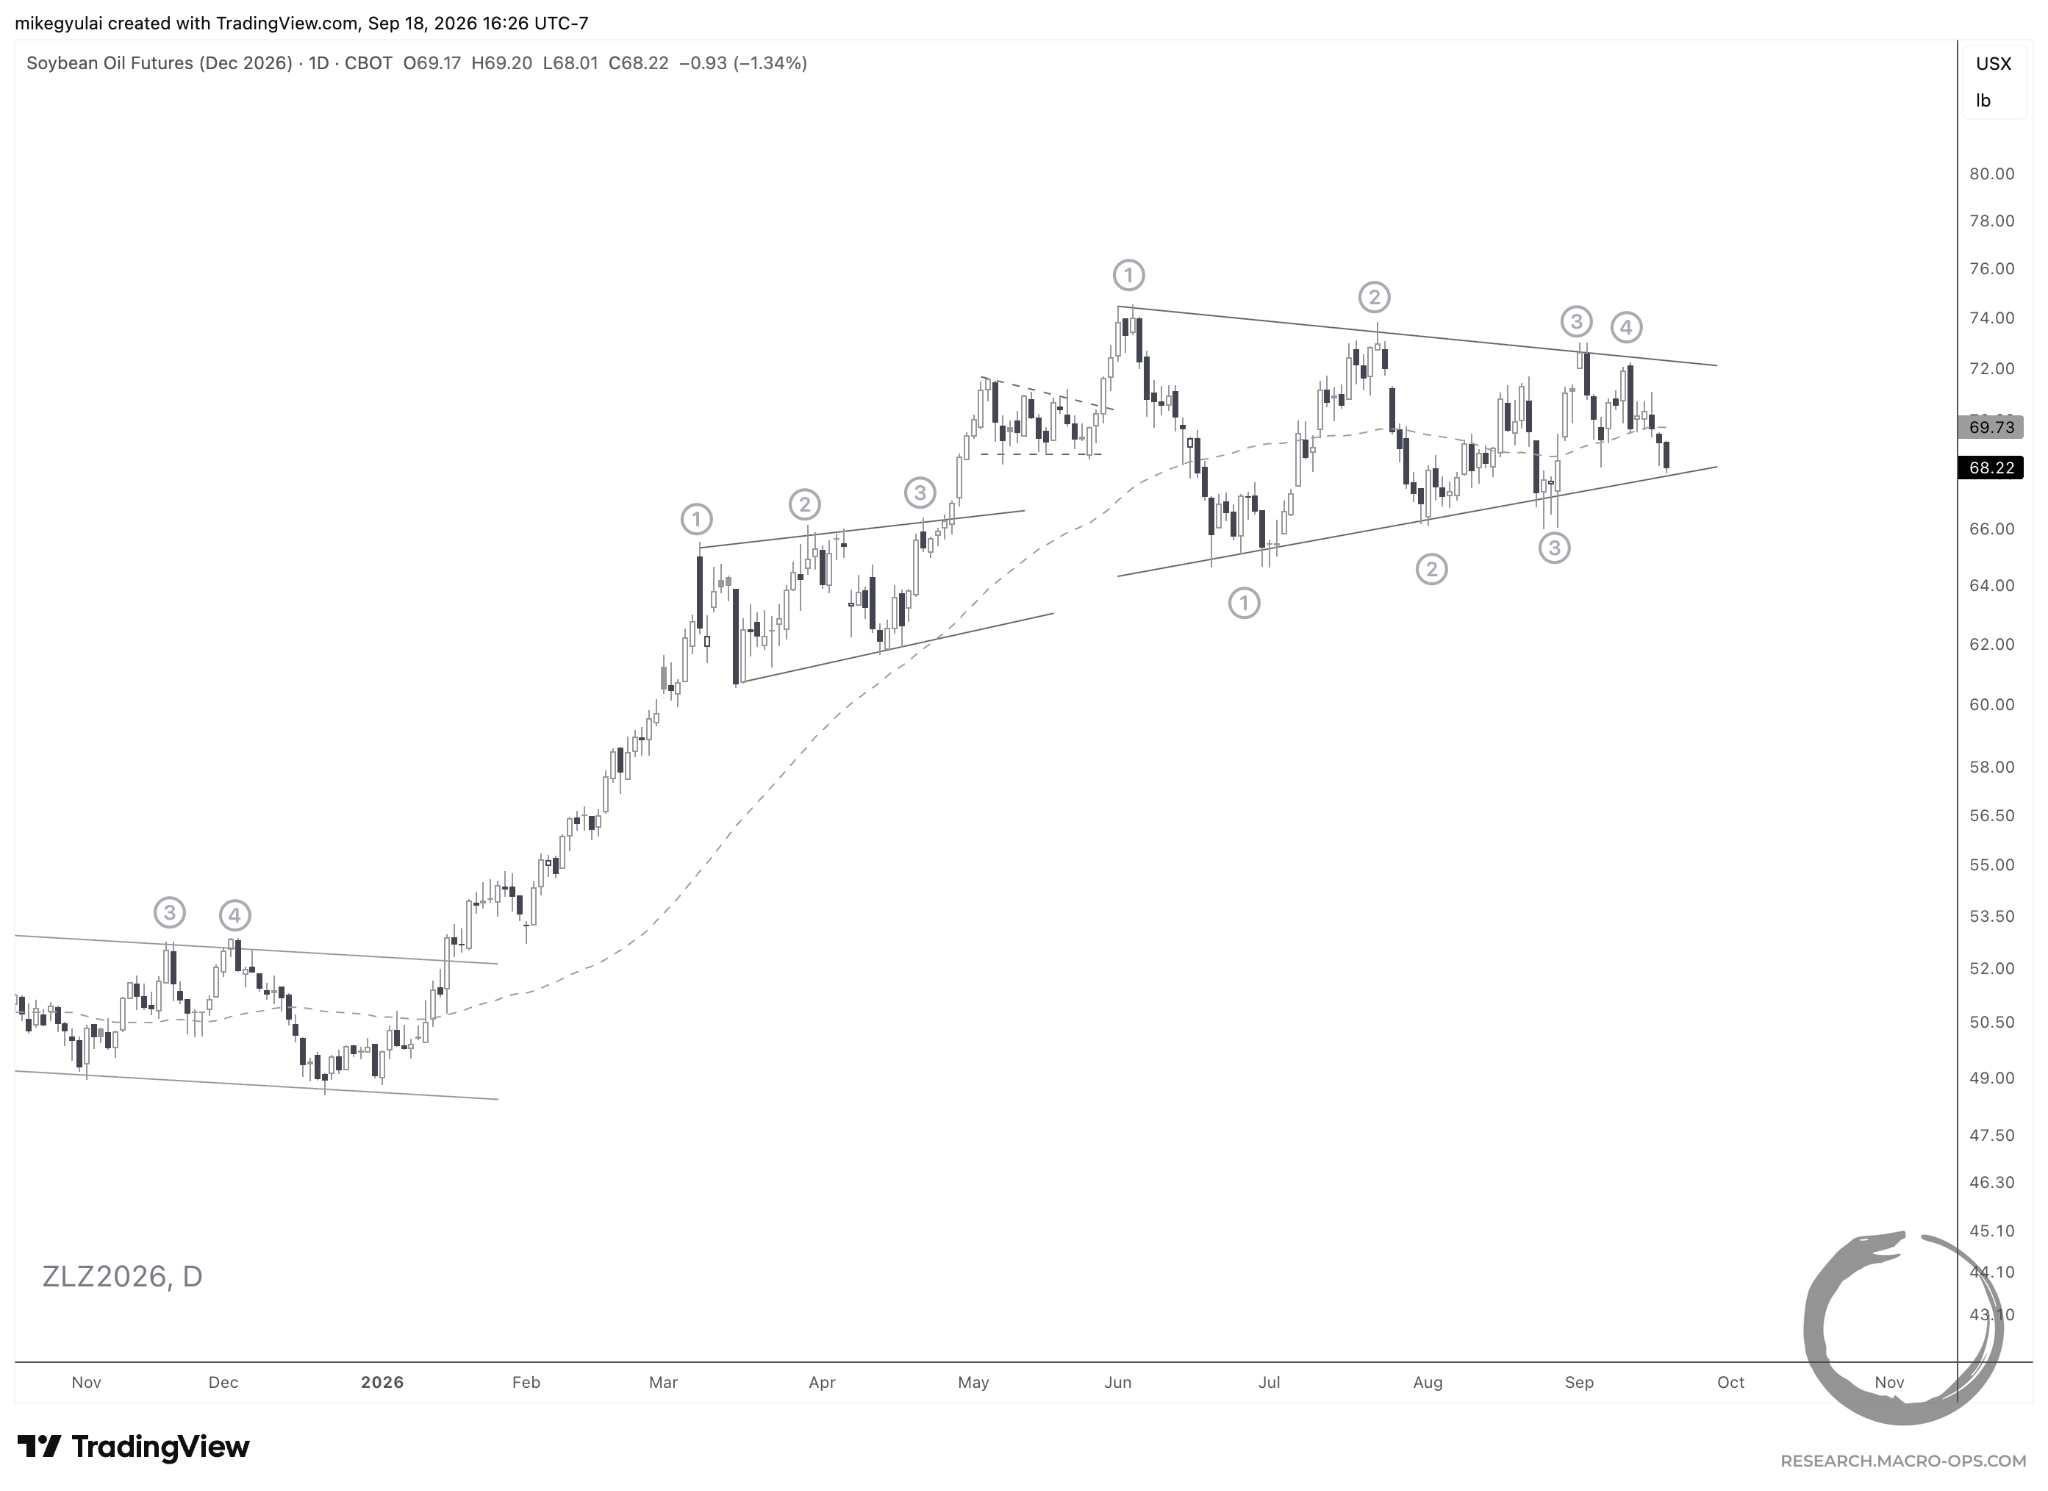
December soybean oil has formed a well-defined 3-month symmetrical triangle. While directional bias for consolidation patterns is always in the direction of the prior trend, symmetrical triangles can act as both continuation and reversal patterns.
The Pauses That Refresh
The current bifurcated equity market is represented in my equity screens, with a mix of long and short setups, continuations and reversals. Here are the names that caught my attention this week:
Active watchlists, real-time positioning updates, and live portfolio tracking are reserved for members of The Collective, our premier service offering discussions on high-level theory and performance, differentiated research, and a global community of serious traders and investors dedicated to mastery. Learn more about The Collective here.