



Rome, 167 BC. The third morning of Aemilius Paullus’s triumph.
For two days the city had watched a conquered Macedon roll past: 250 wagons of statues and paintings, then the arms of a defeated army, then 3,000 men shouldering coined silver in 750 vessels. Trumpets sounded the call to battle. 120 oxen with gilded horns walked to sacrifice. 77 vessels of gold coin followed.
Then King Perseus’s children, led captive beside their tutors. Then Perseus himself, dressed in black. And finally the conqueror Paullus: a purple robe threaded with gold—the dress of Jupiter—a laurel branch in his right hand. The kingdom of Alexander had ended, and this man had ended it.
Roman tradition holds that on such a day the city received its general as a god. So a slave rode behind him, holding a golden crown above his head and repeating one line: Look behind you. Remember you are a man.
I ride in no chariot. A green quarter ends no kingdom. But a parade forms in my mind all the same.
A strategy captures the capitulatory moves I designed it for, my equity curve hockey sticks into new all-time highs, and I believe it: I am outperforming everyone. I have mastered this. The wagons roll.
Then the regime turns, my equity drifts back below its highs for a few days. Then weeks. At two months, the wagons roll again. Yet I’ve switched robes: I am terrible at this. I have no consistency.
Over the years, I have trained my own whisperer to ride behind me. When the parade begins—laurel in my hand or black on my back—he leans in.
No one outperforming. No one terrible at this. No one defined by a surge of green PnL or by months spent underwater. No Paullus. No Perseus.
What exists is a man at the desk right now. Nothing to crown and nothing to scorn. He is too immersed in running his process, managing his orders, curious what the last run of wins or losses reveals, taking the next right action.
Look behind you, Rome whispered to its generals. There is a man in that chariot.
Look around you, mine whispers. There is no parade.
Risk Off
There are two interpretations of the Nasdaq I am considering. Neither is bullish. The first is a 5-month broadening pattern.
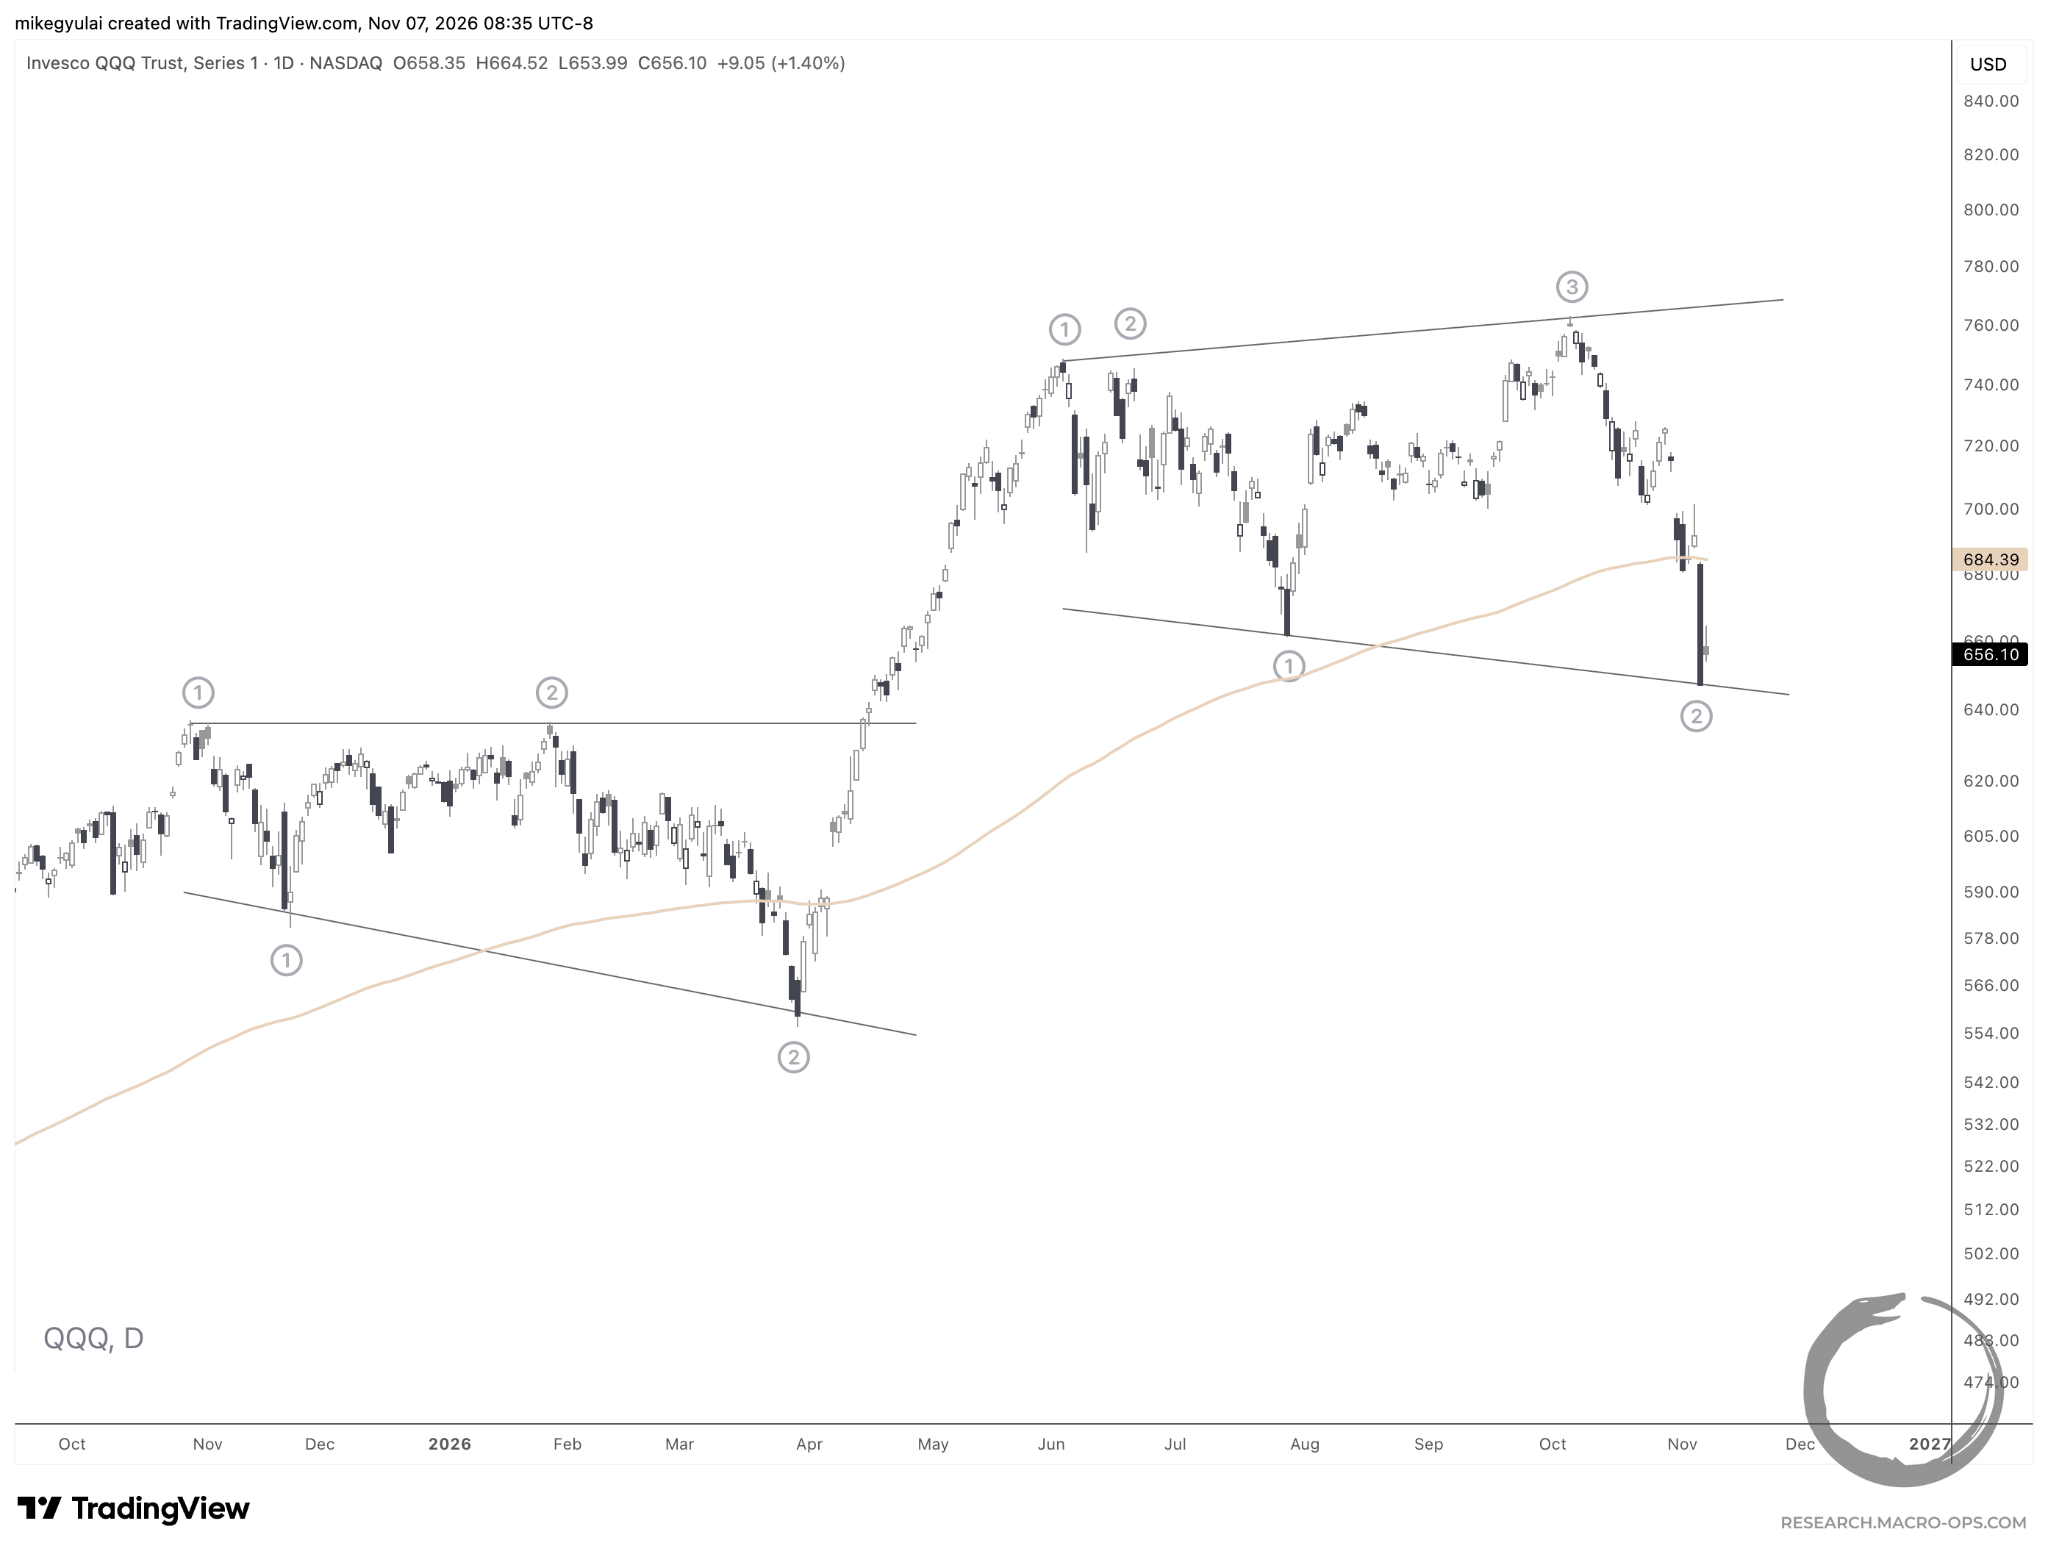
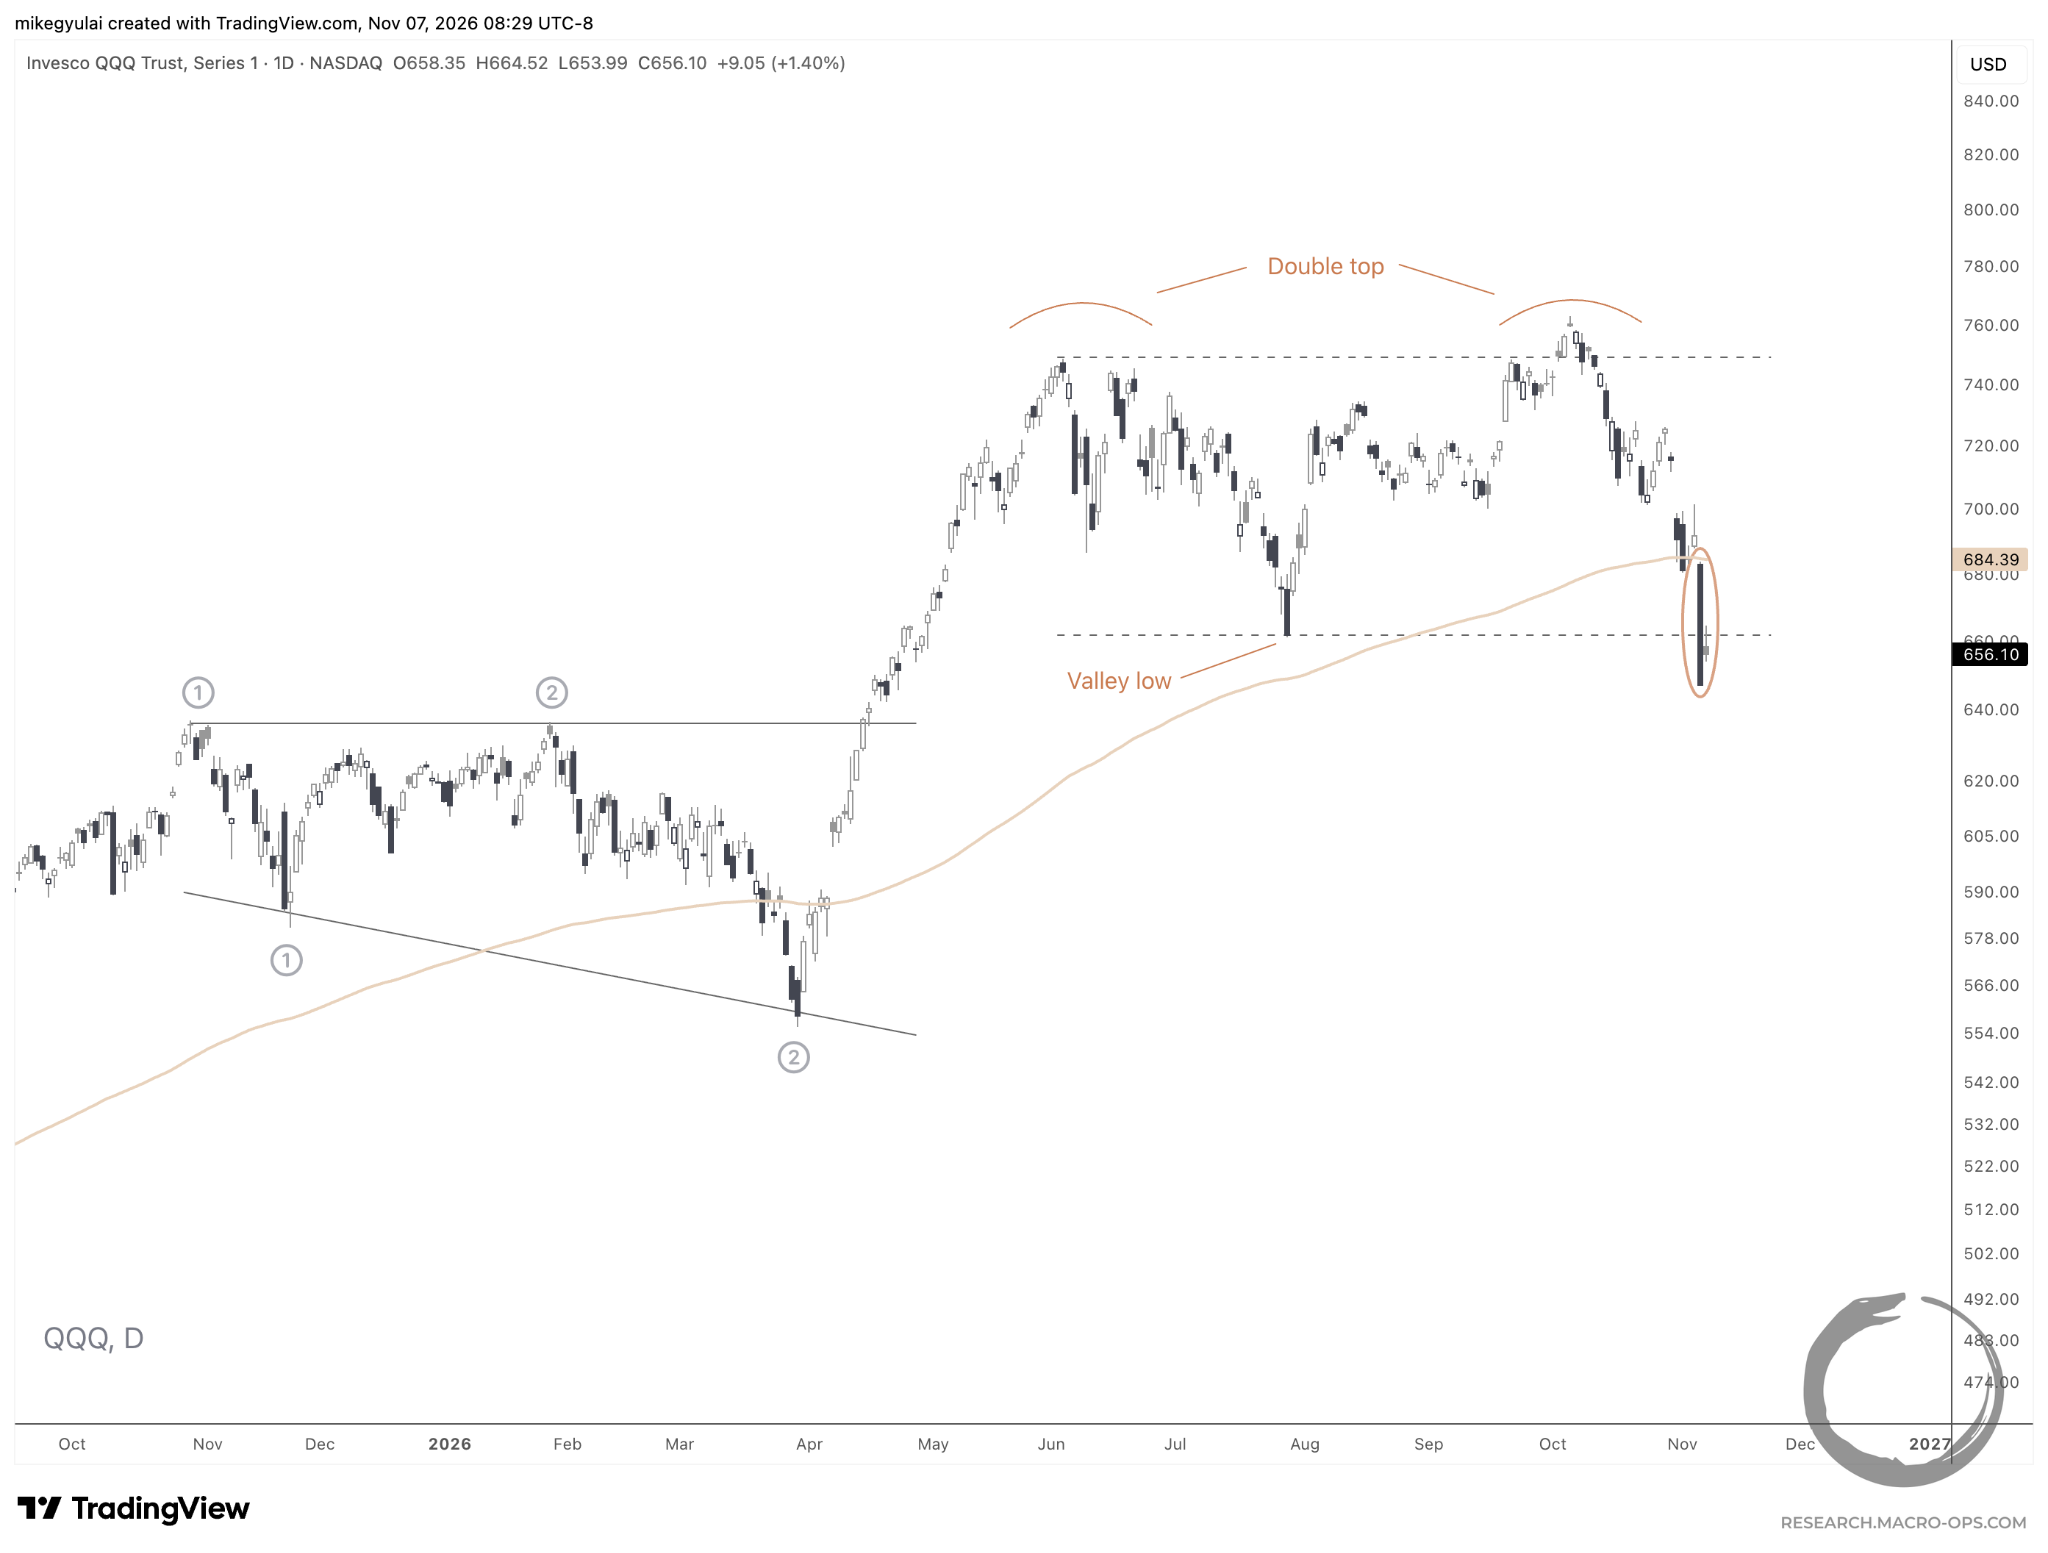
The second is a 5-month double top, with Thursday’s selloff confirming the decline through the valley low. One of the biggest benefits of trading as a team is that we did not need to wait for Thursday’s price action to position ourselves short equities in the Macro Ops portfolio.
Last month our lead equity market strategist, Dean Christians, alerted Collective members that his Tactical Composite Trend Model had fired a risk-off signal, the 30th since 1929.
Last Friday our volatility and positioning analyst, Tony Dundas-Lucca, shorted Nasdaq futures in the Macro Ops tracking portfolio. His reasoning for the trade is covered here.
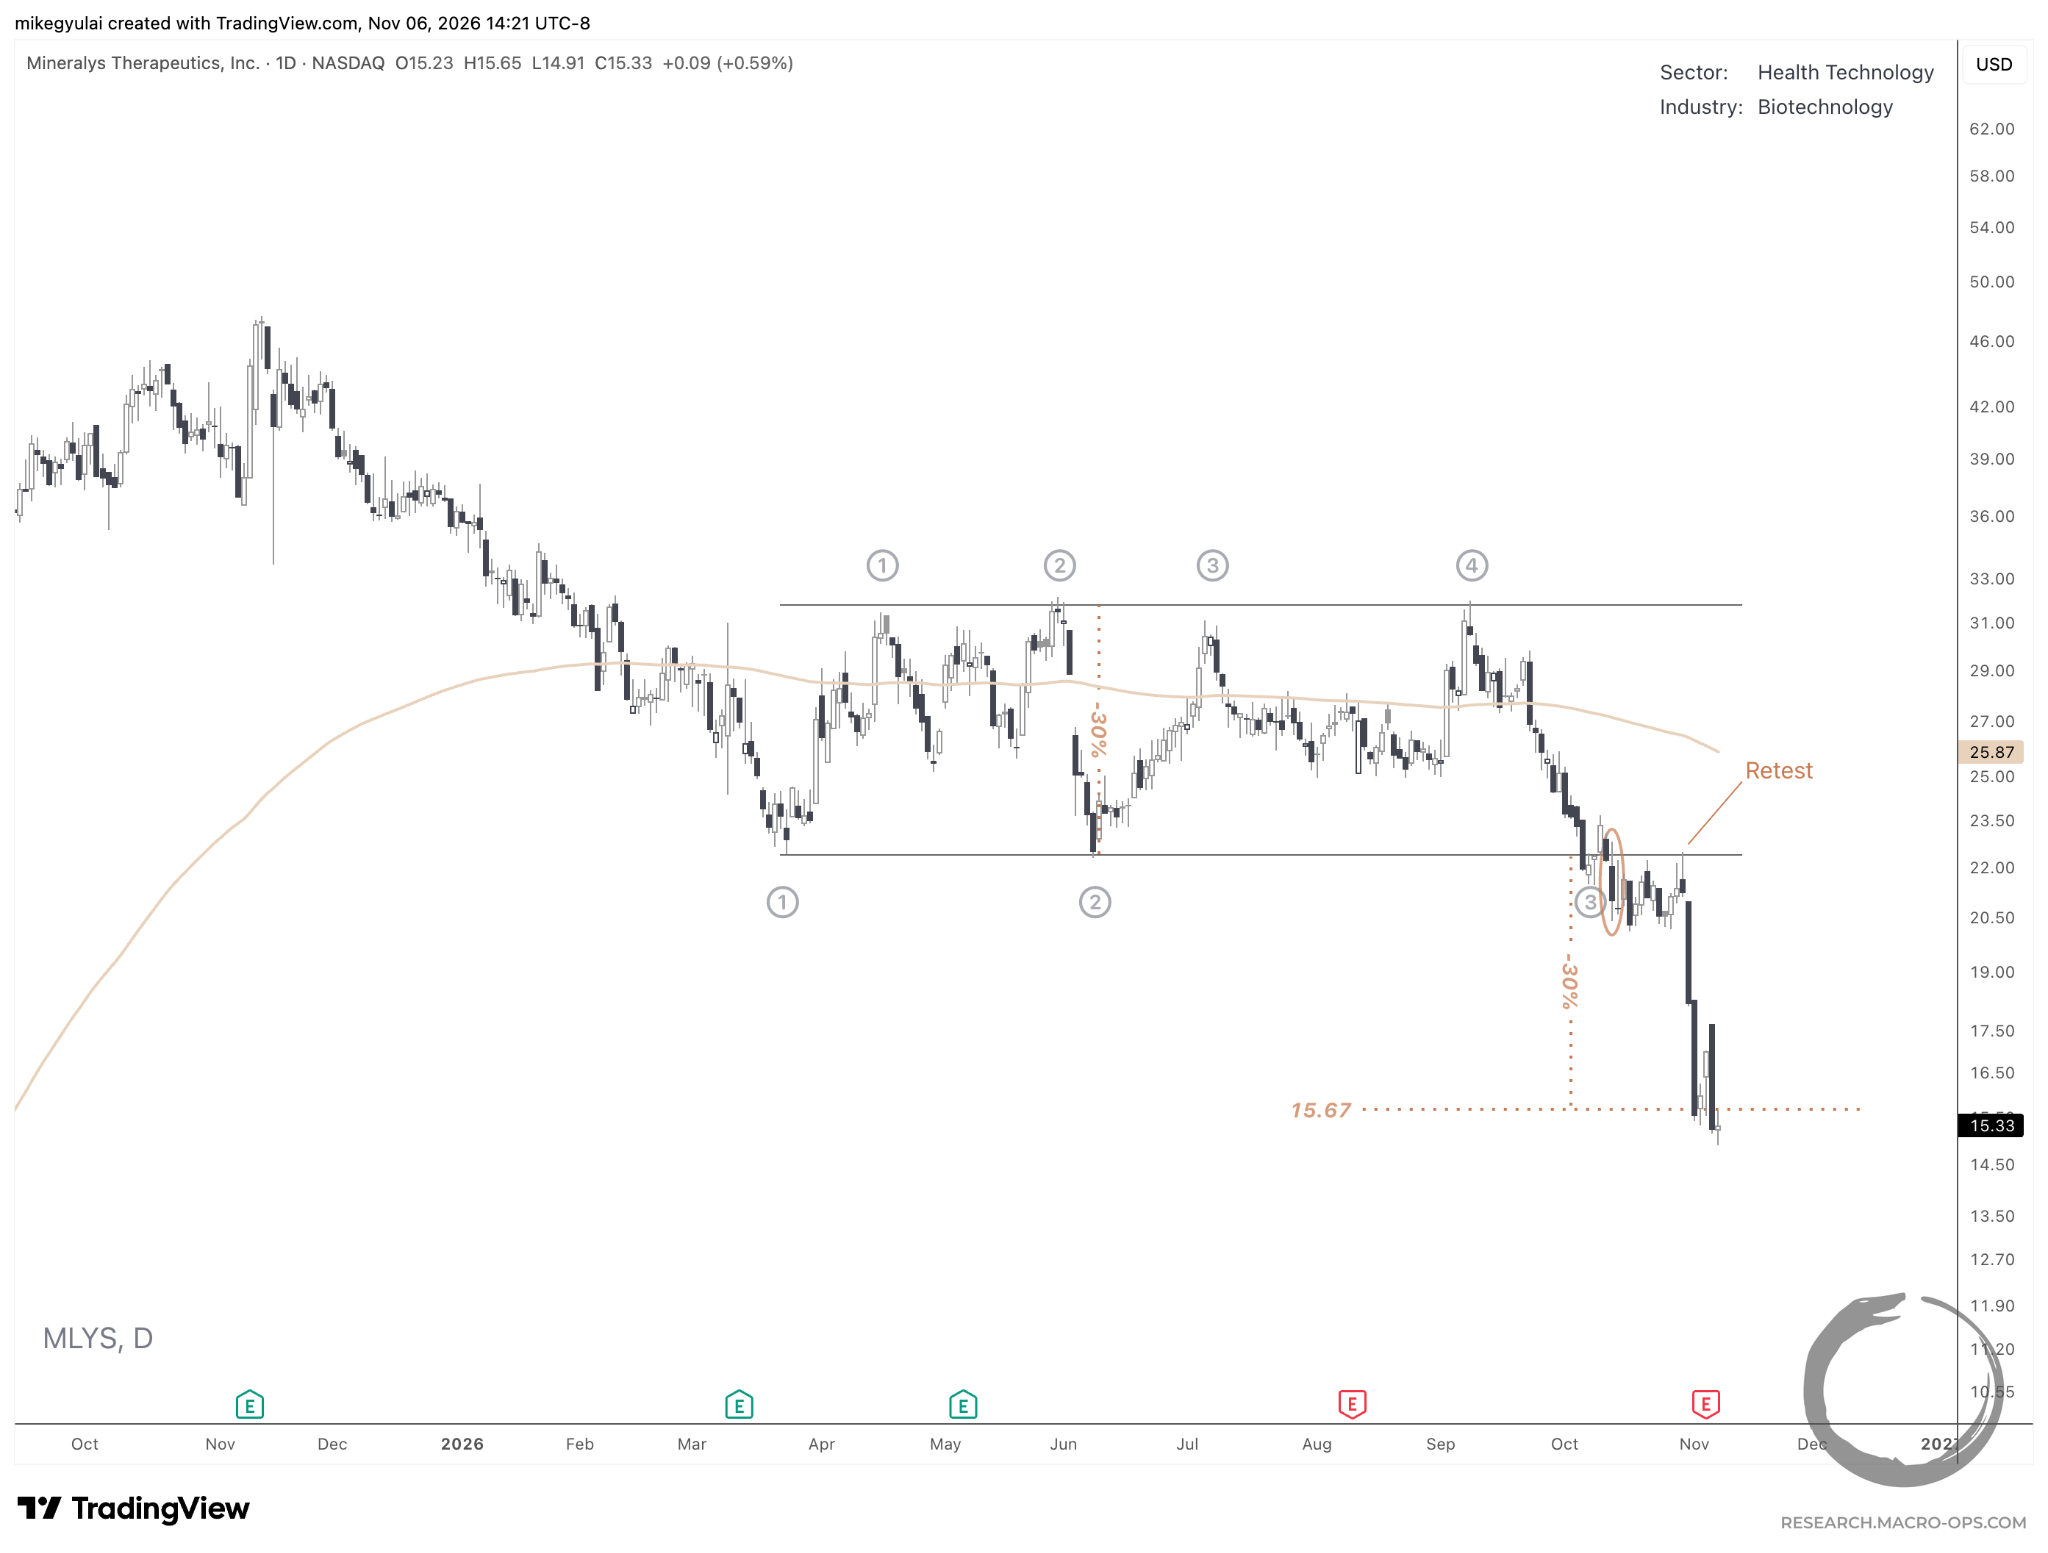
Equity indices lag the stocks beneath them. The risk-off turn showed first in capital leaving growth industries like biotechnology. Mineralys Therapeutics, added to the active watchlist in the August 15, 2026, issue, broke down from a 6.5-month rectangle on October 13 and met its 1x target of 15.67 on Monday.
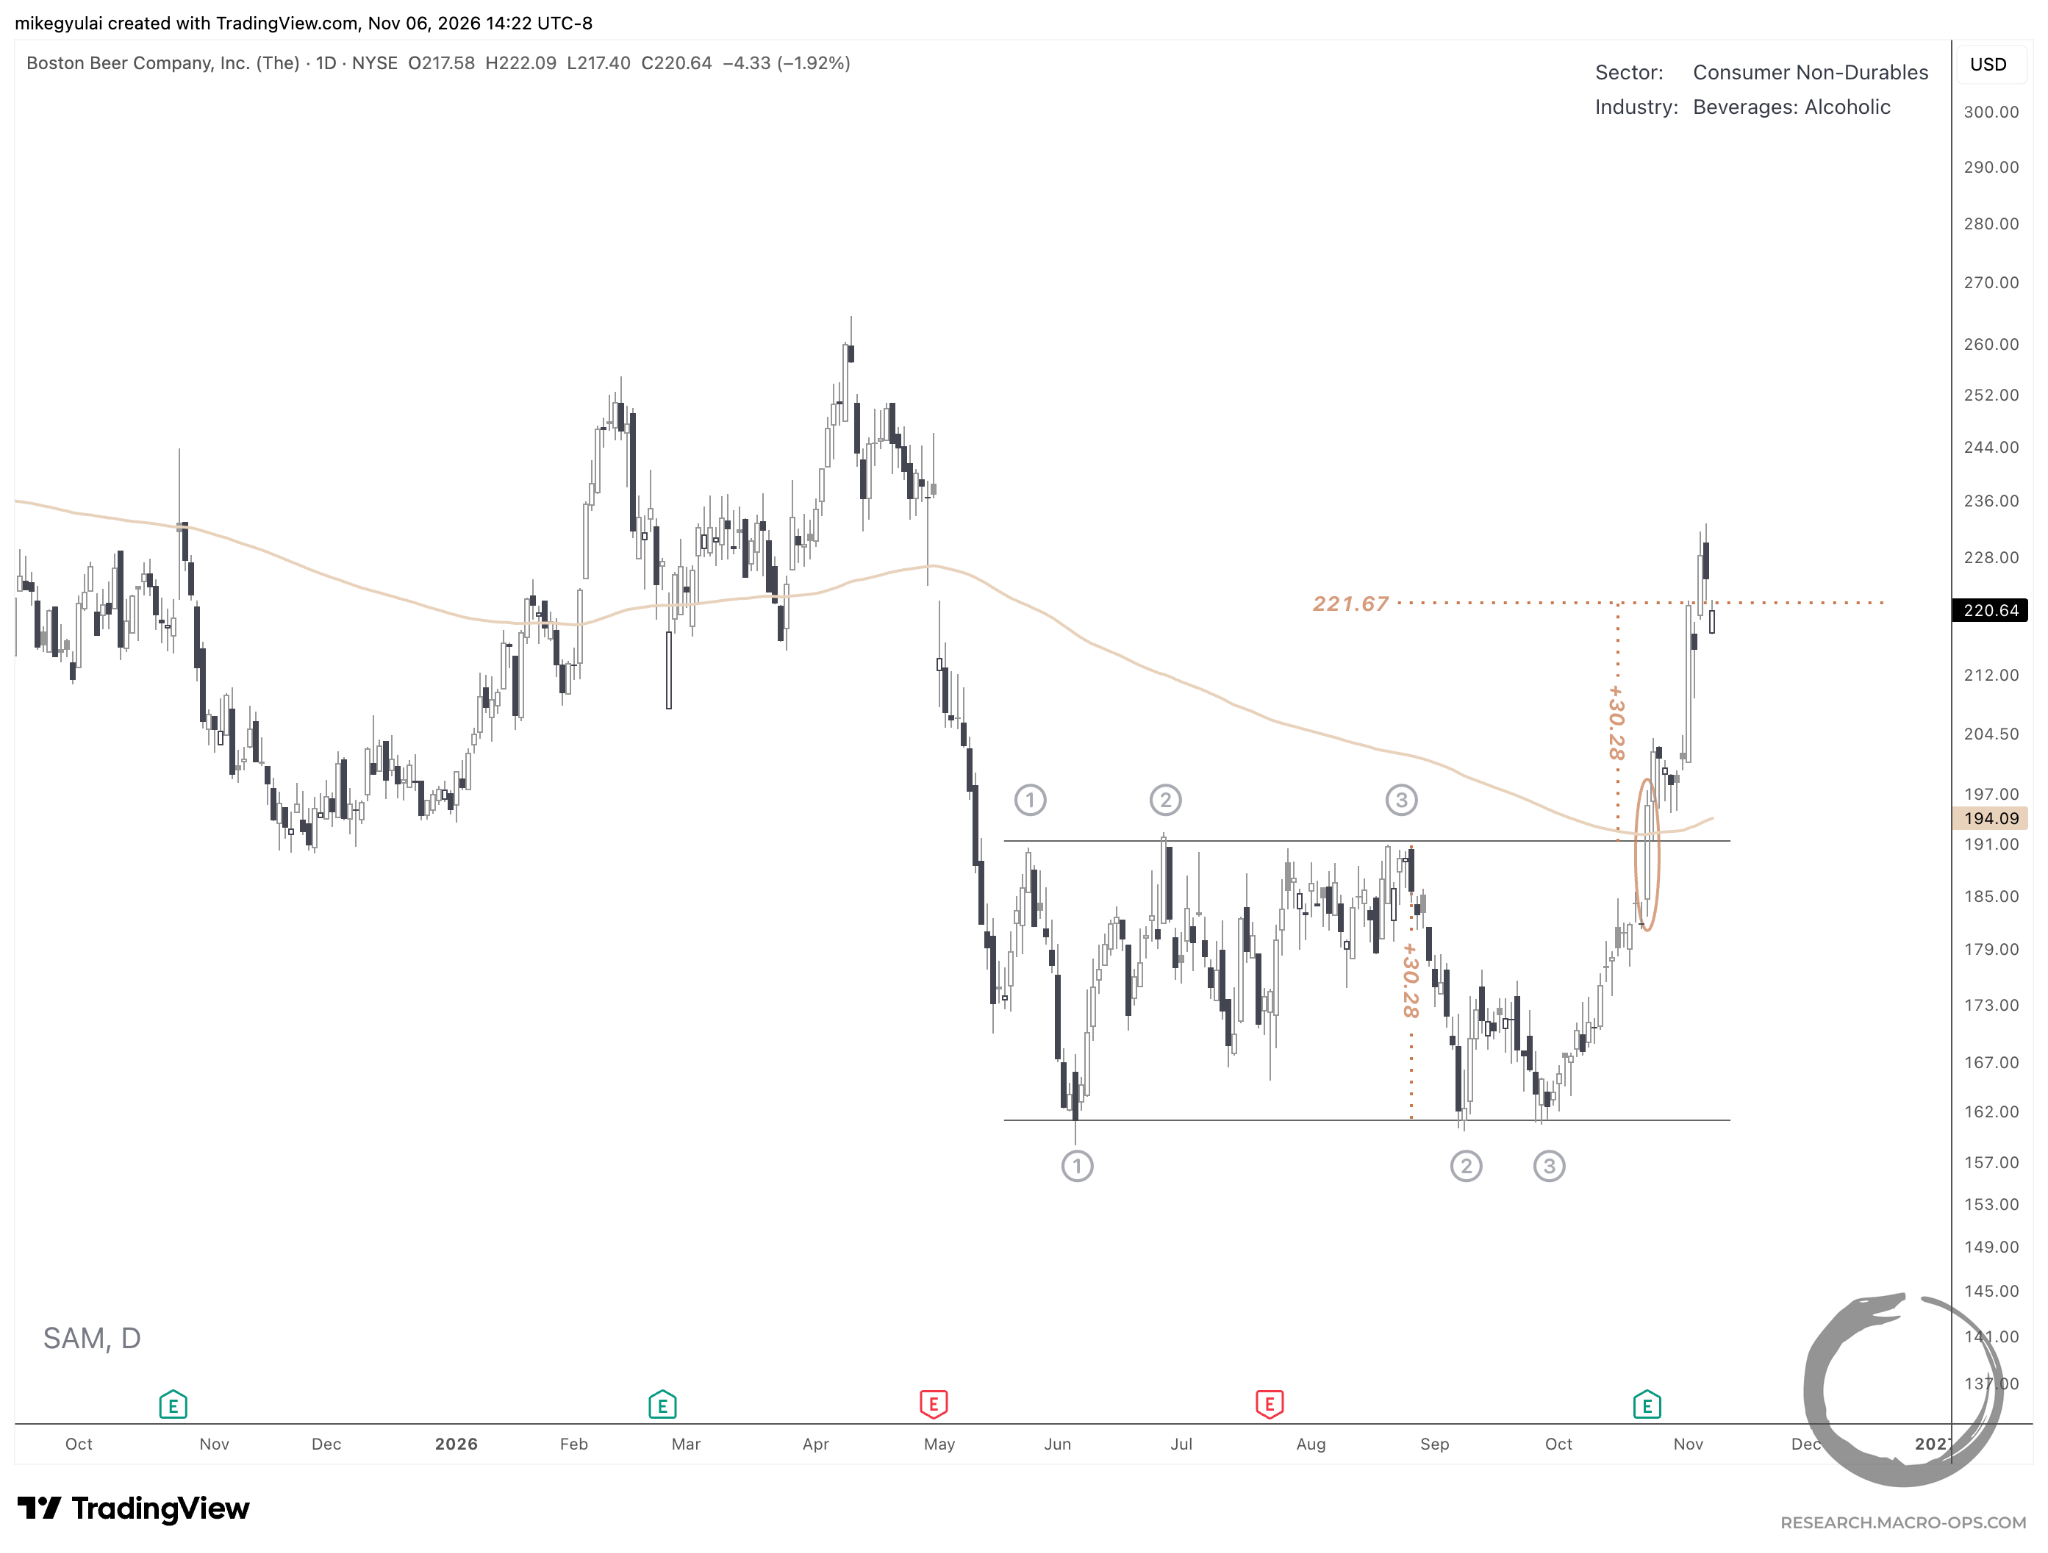
The same capital found defensive sectors like consumer staples. Boston Beer Company, added to the active watchlist in the September 12, 2026, issue, broke out of a 5-month rectangle on October 22 and met its 1x target of 221.67 on Monday.
Commodities & Currencies
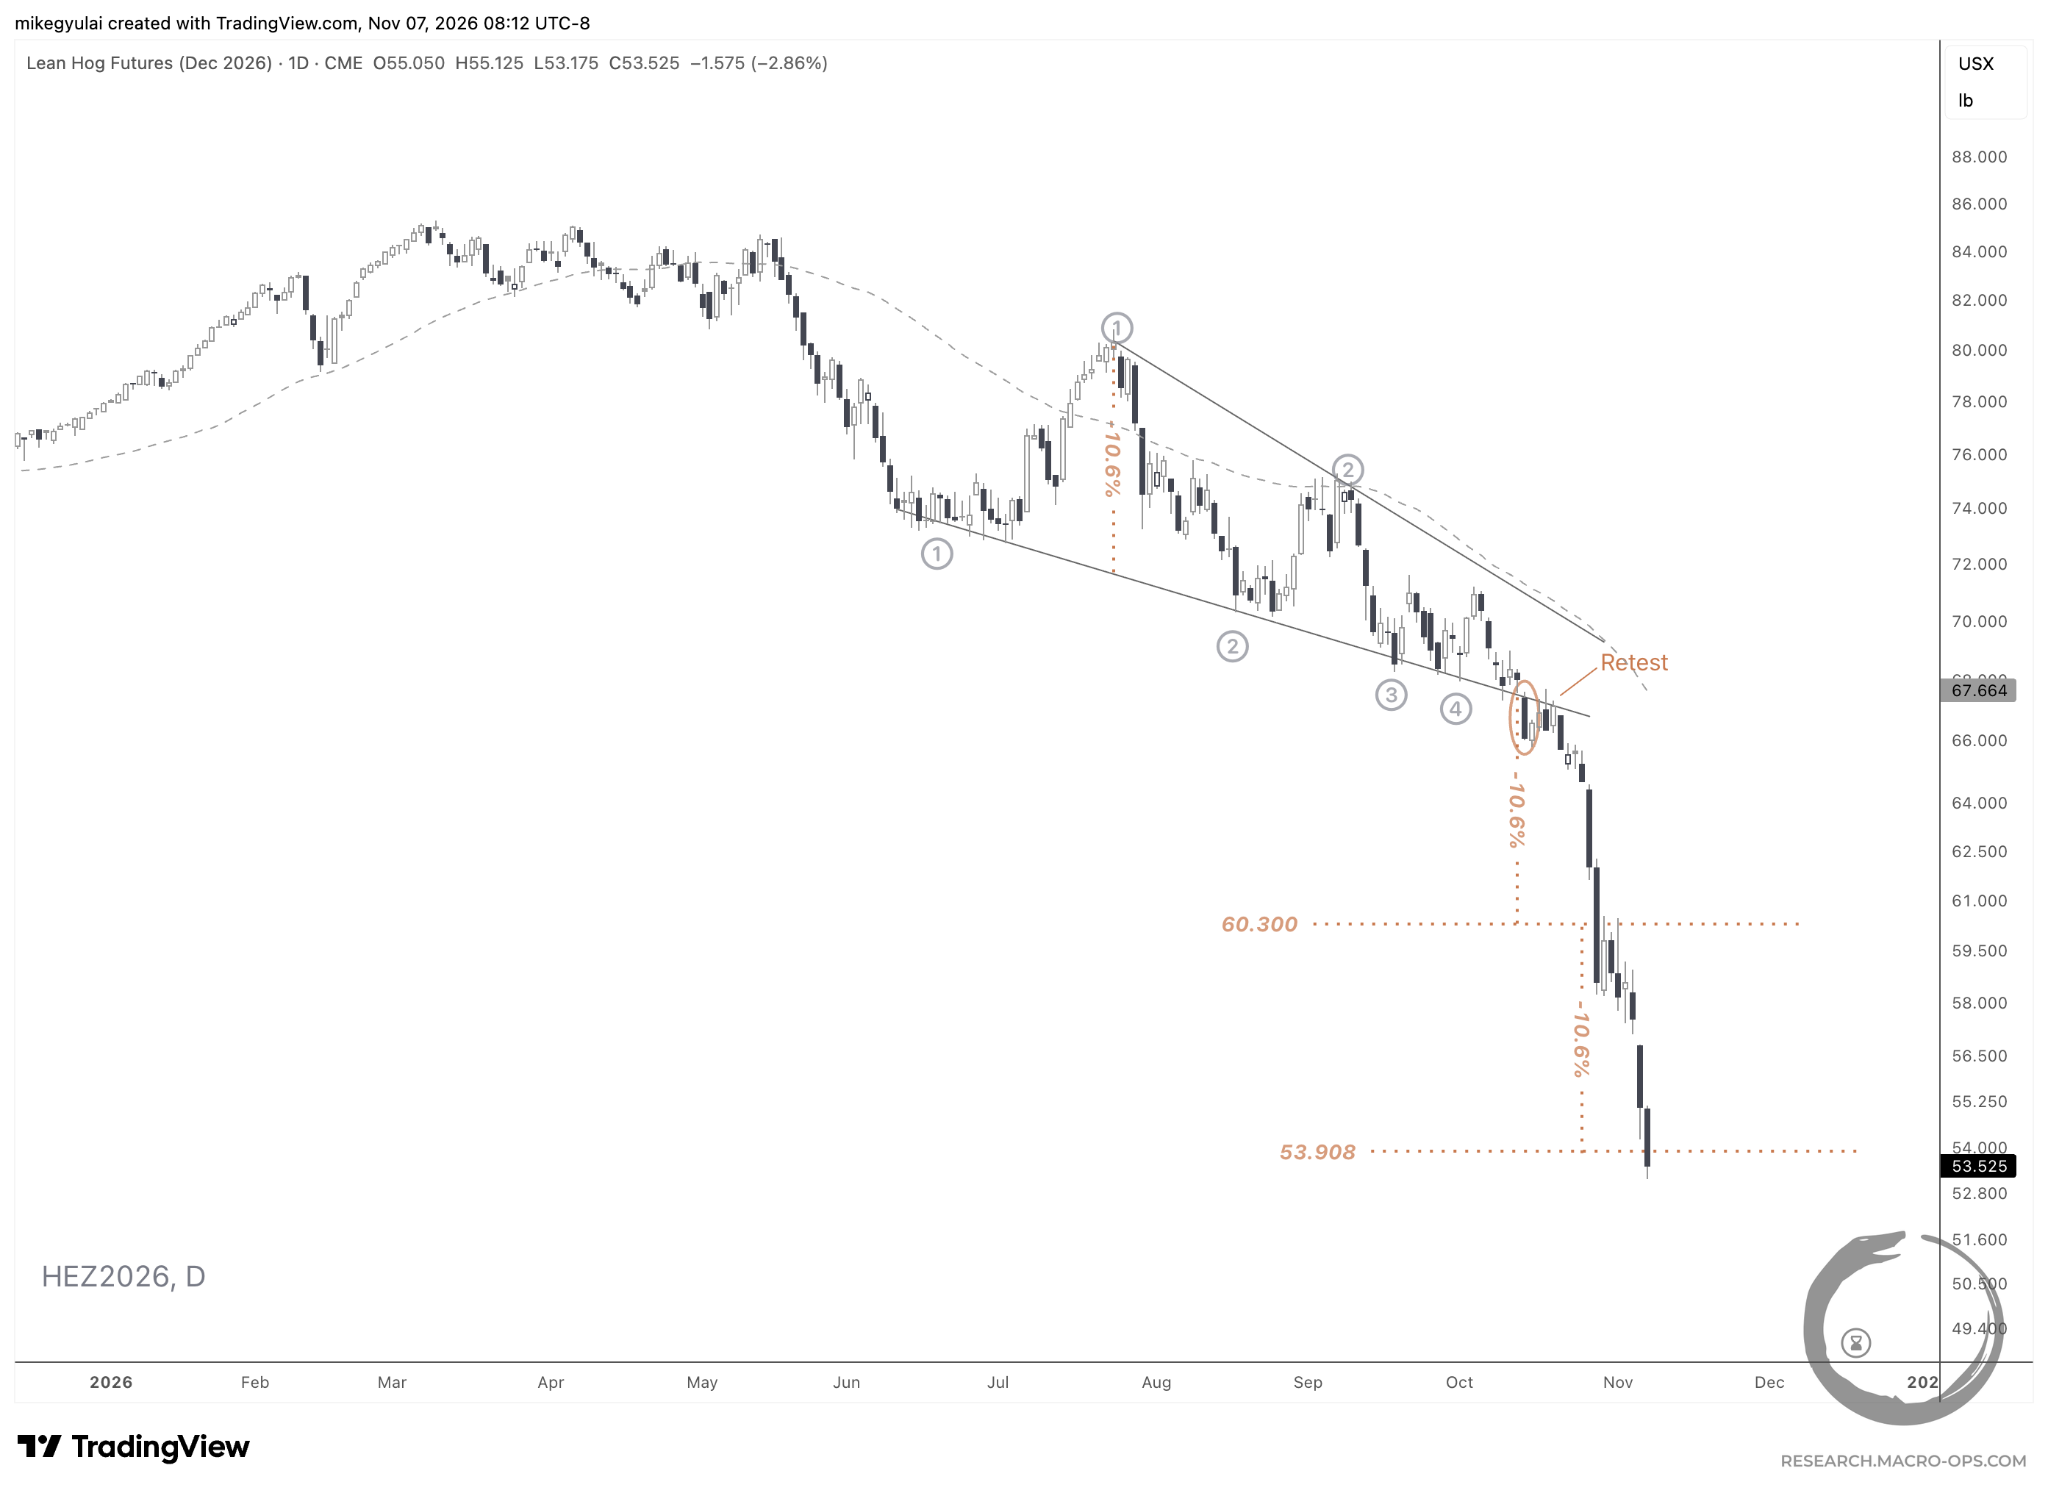
December lean hogs cascaded for a second week, meeting the 4-month running wedge’s 2x measured move target of 53.908 on Friday.
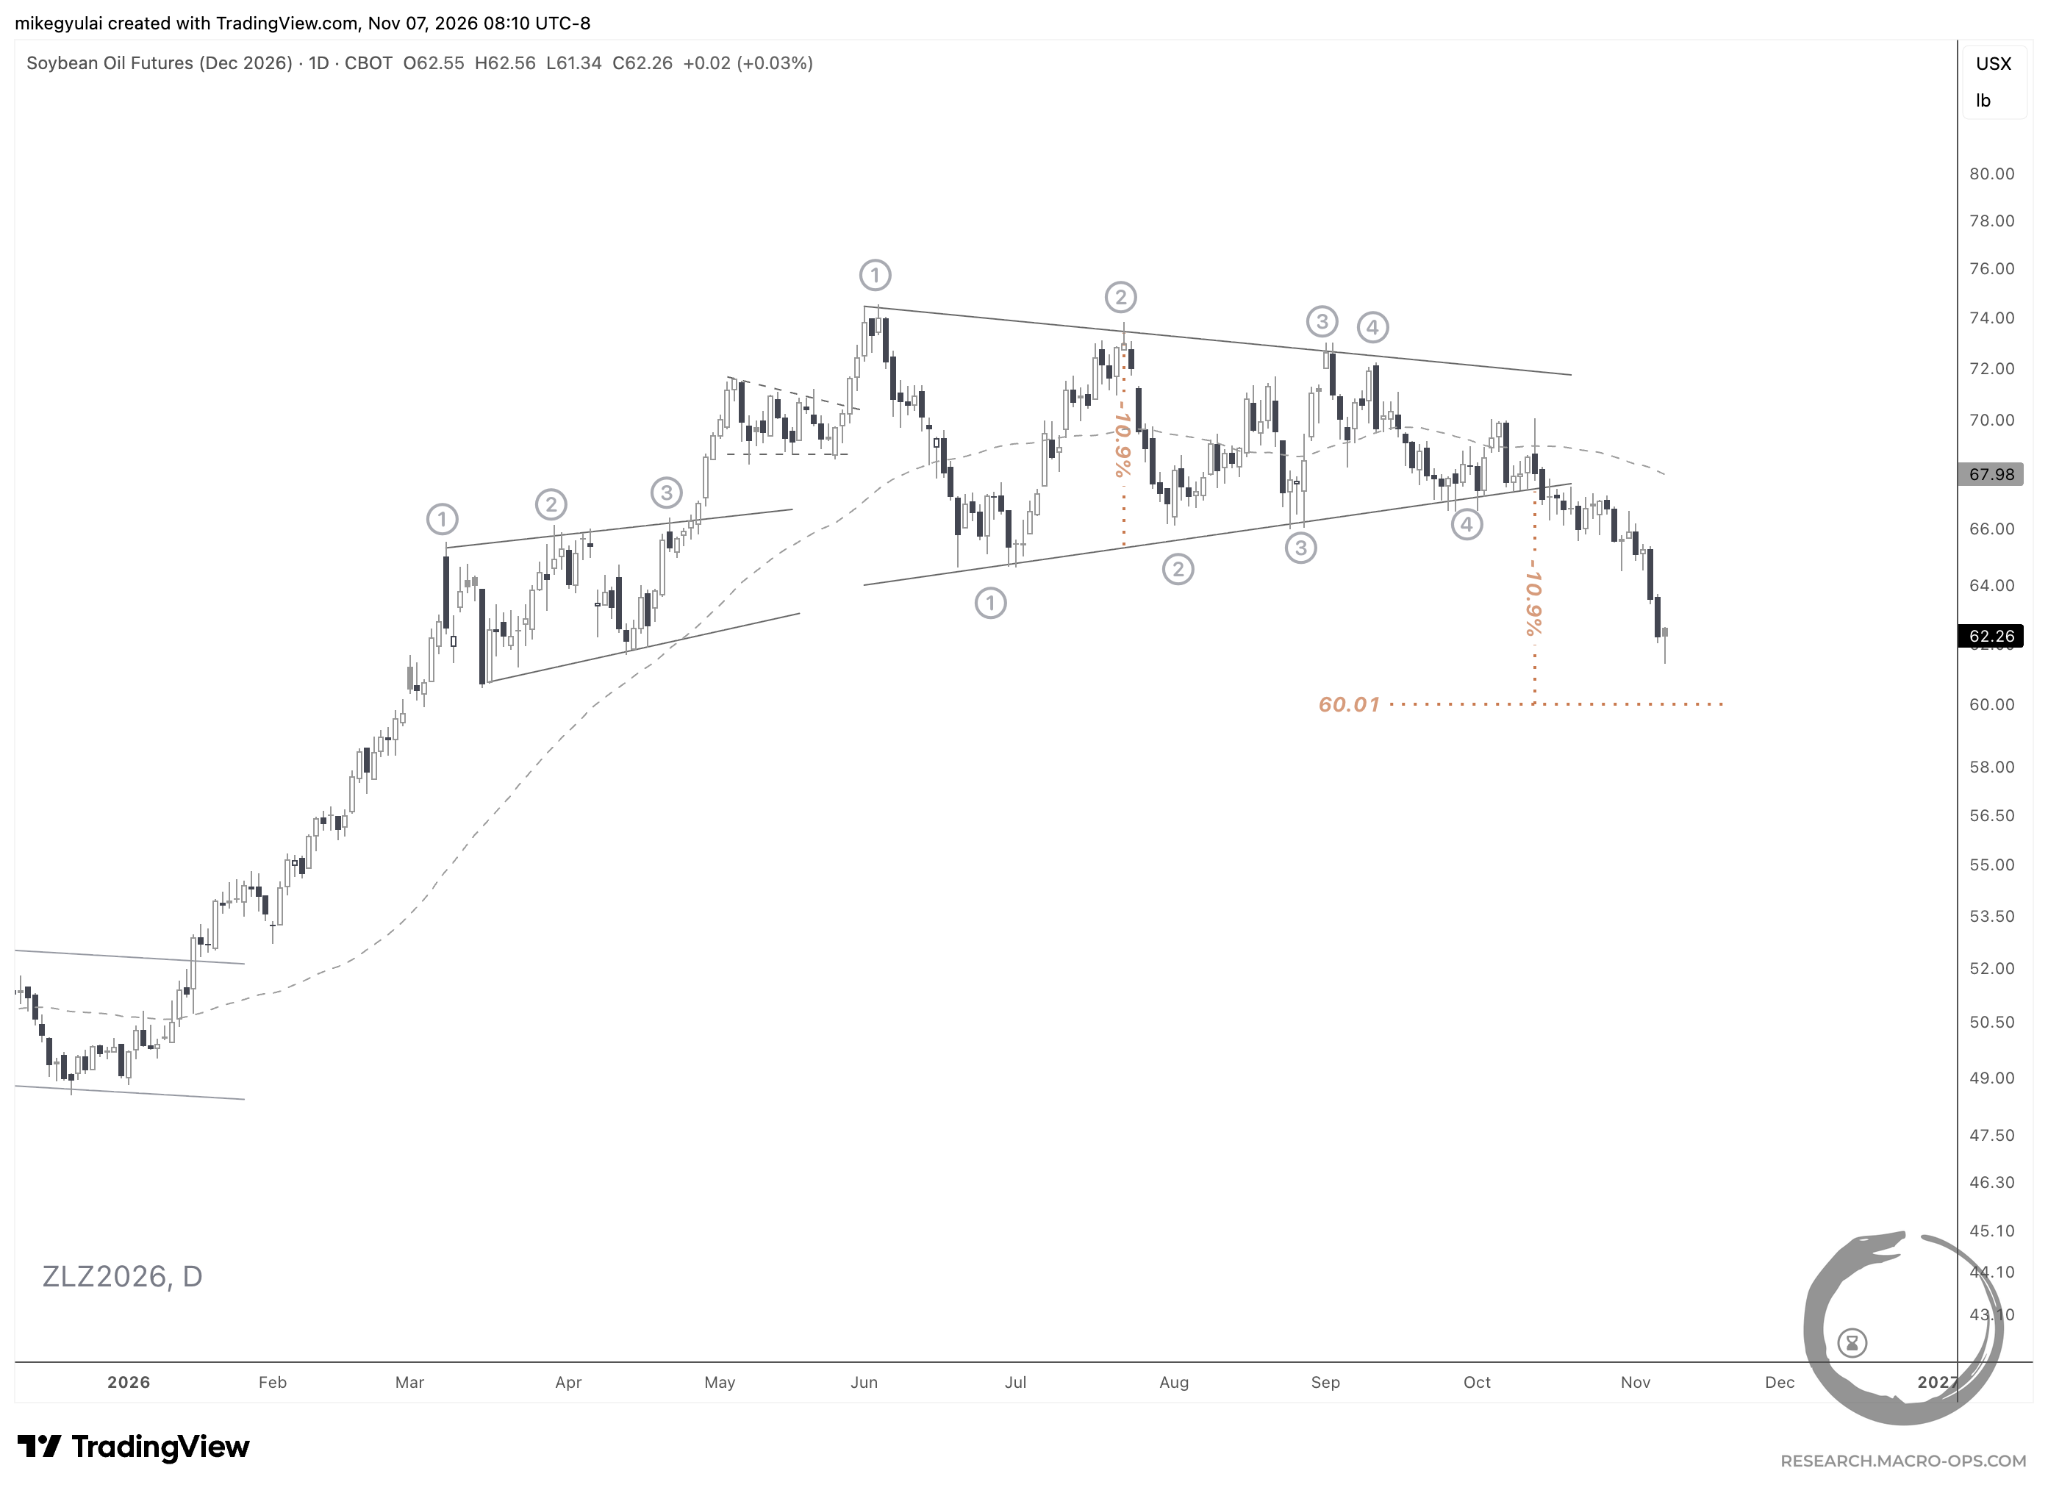
December soybean oil also moved lower, reaching 70% of the way to the 1x measured move target of its 4.5-month symmetrical triangle. While the pattern is indisputable in retrospect—and was tracked in these pages as far back as August—I was not able to identify a definitive breakdown through the pattern boundary. This one will go into my personal “missed moves” folder.
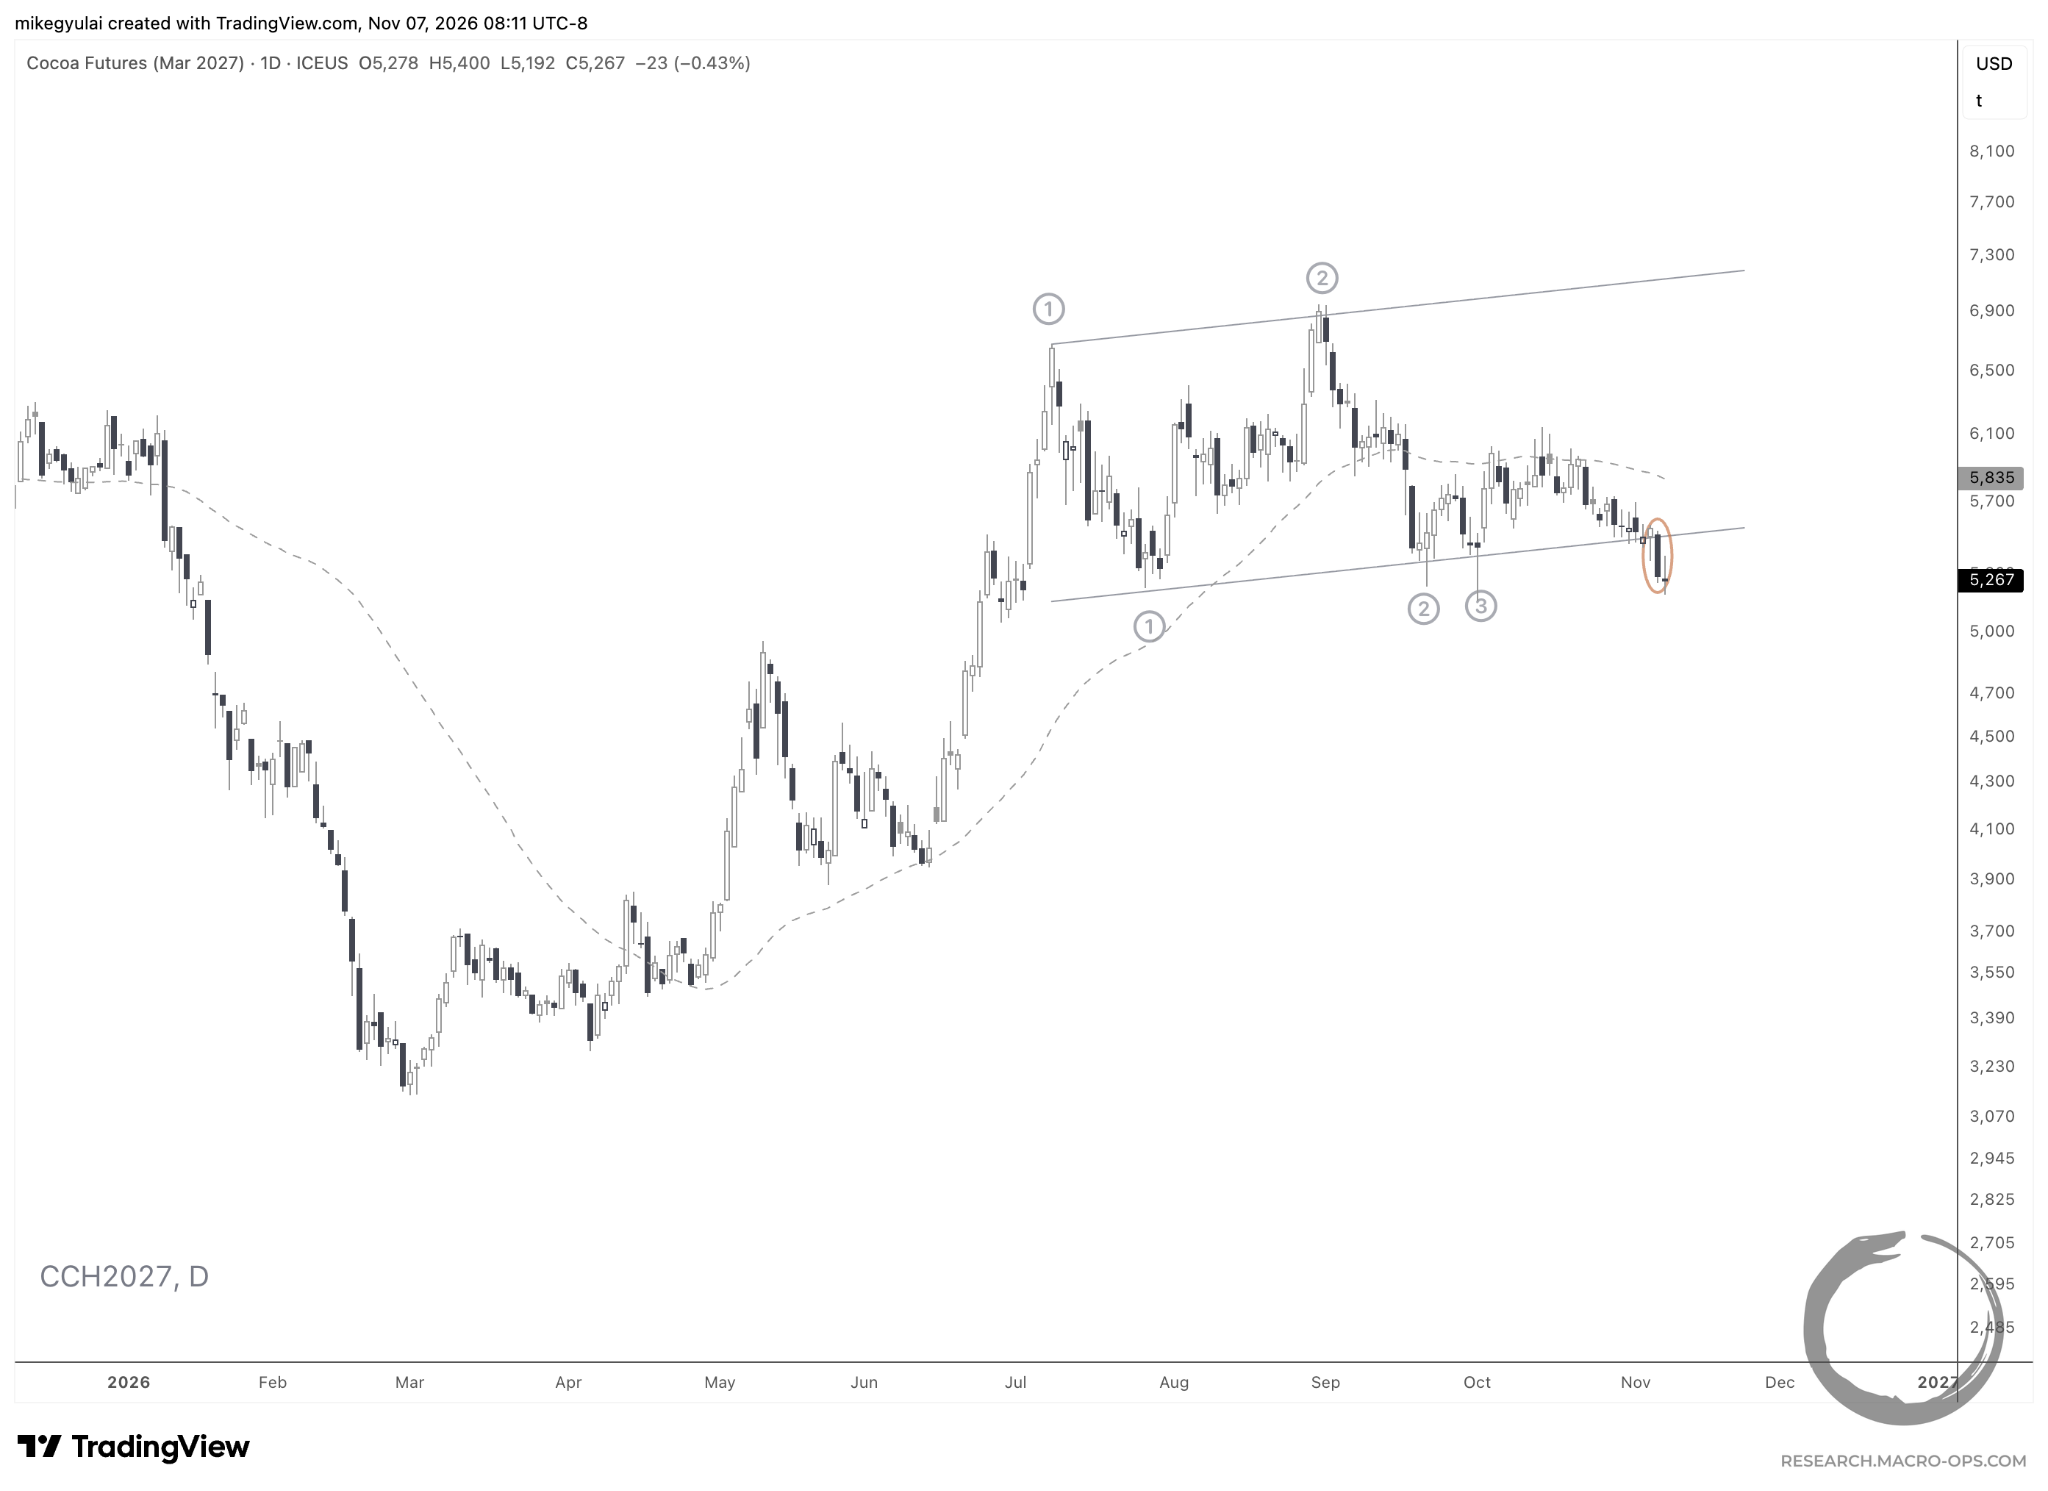
March cocoa broke down this week from a 4-month ascending channel.
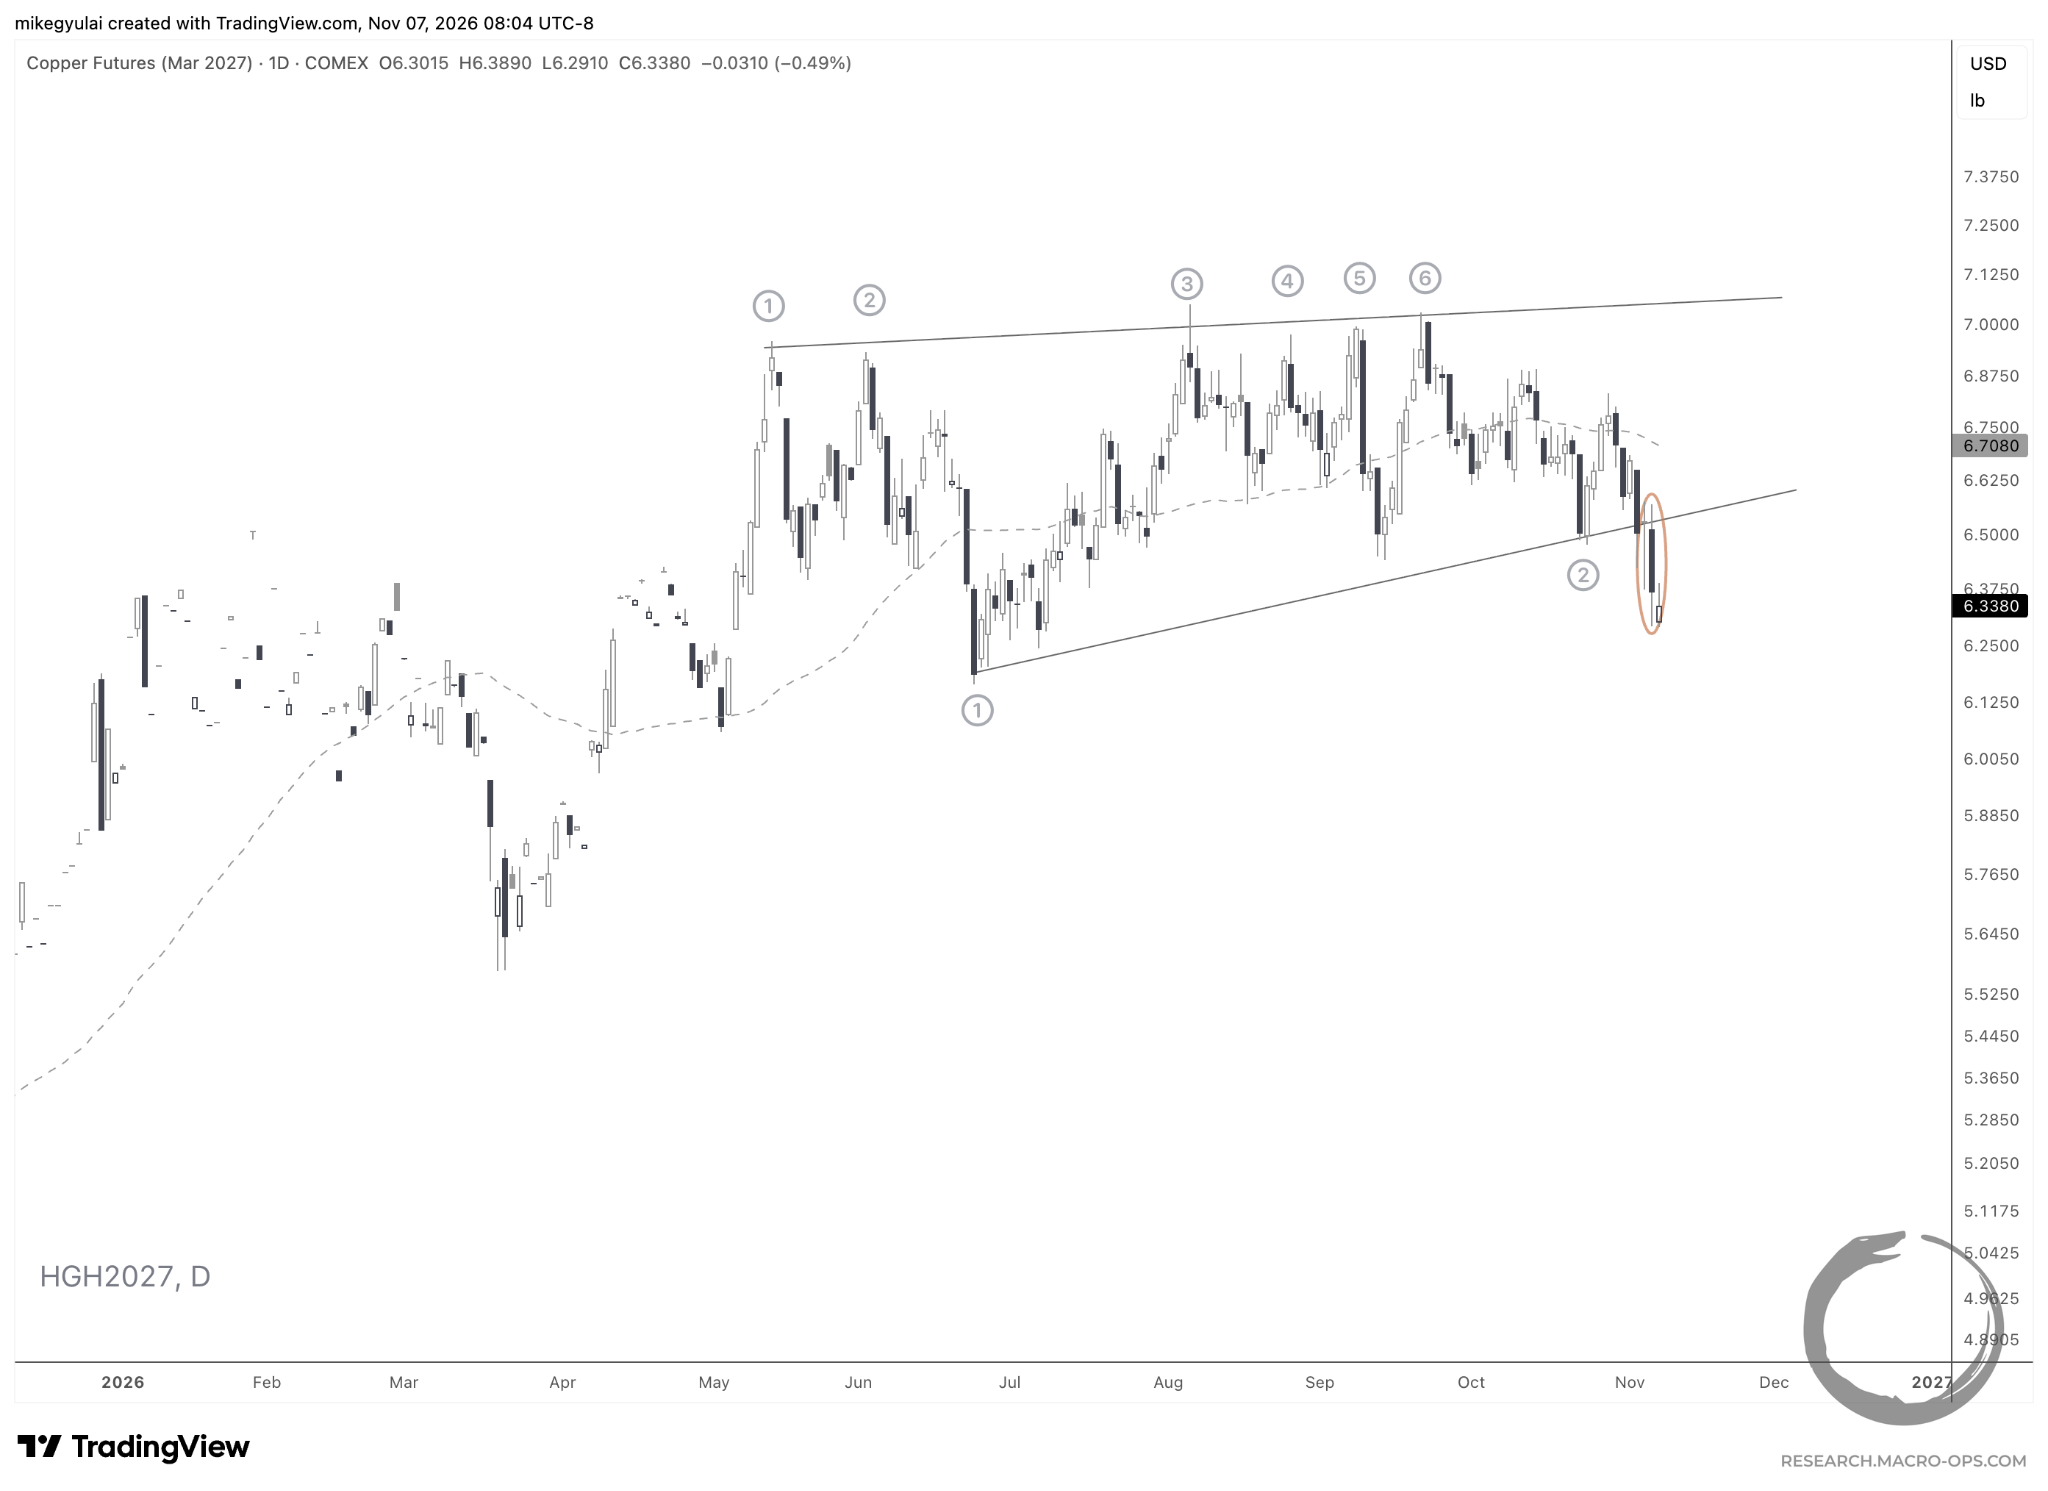
March copper broke down from a 6-month rising wedge. We are short in the Macro Ops portfolio.
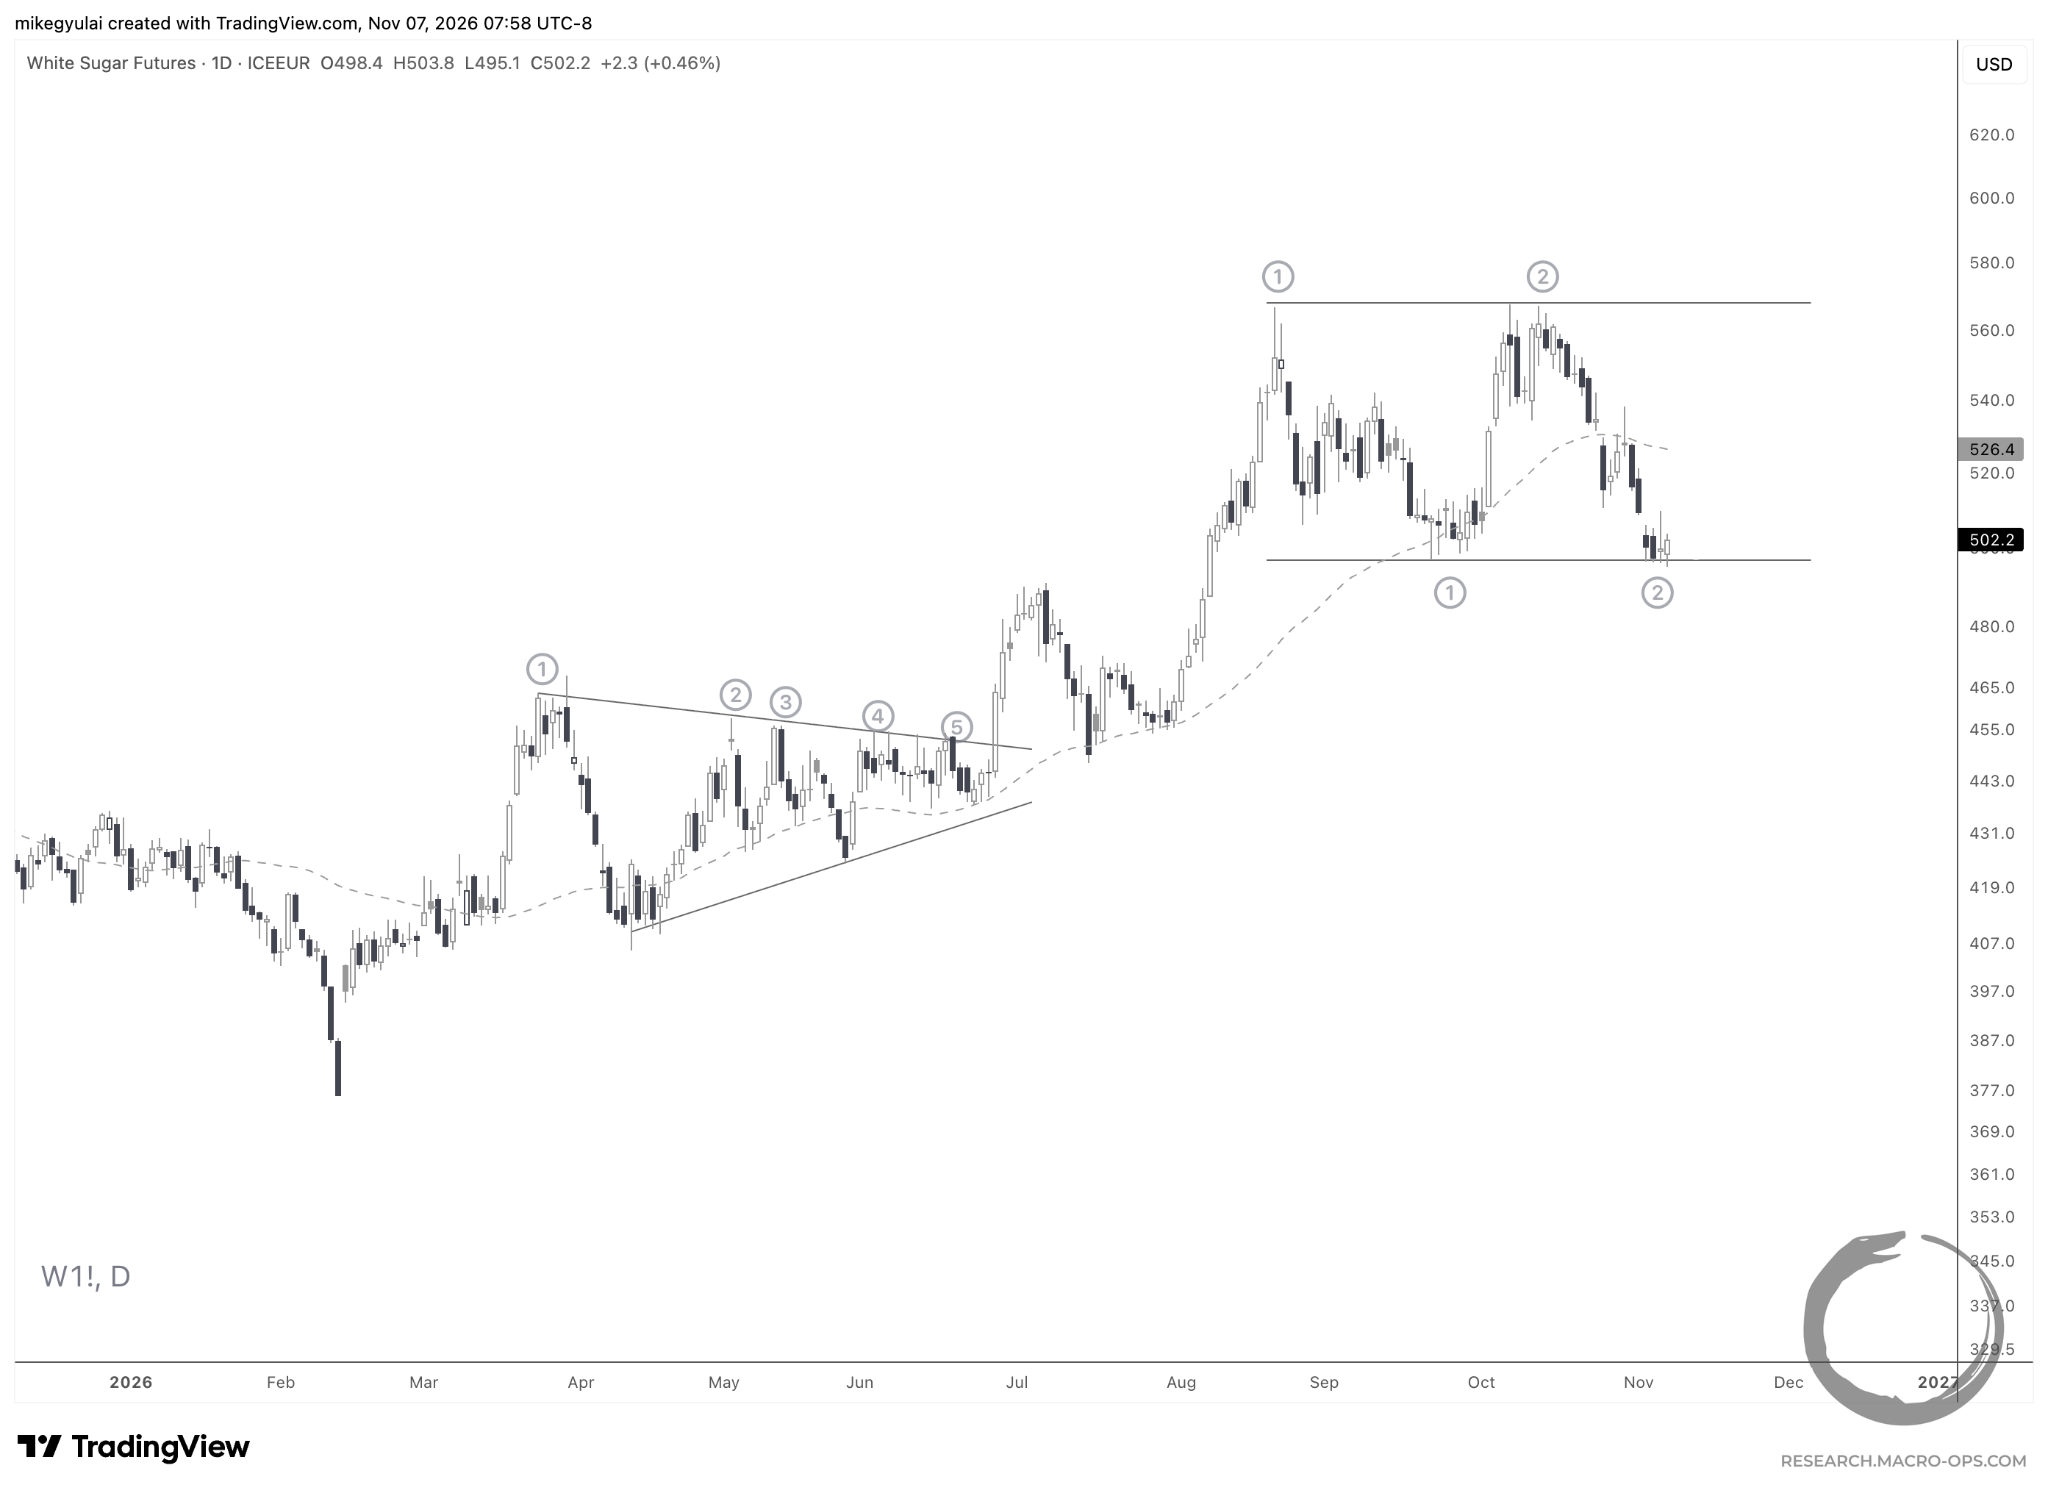
White sugar futures are consolidating inside a 2.5-month rectangle on the continuation chart.
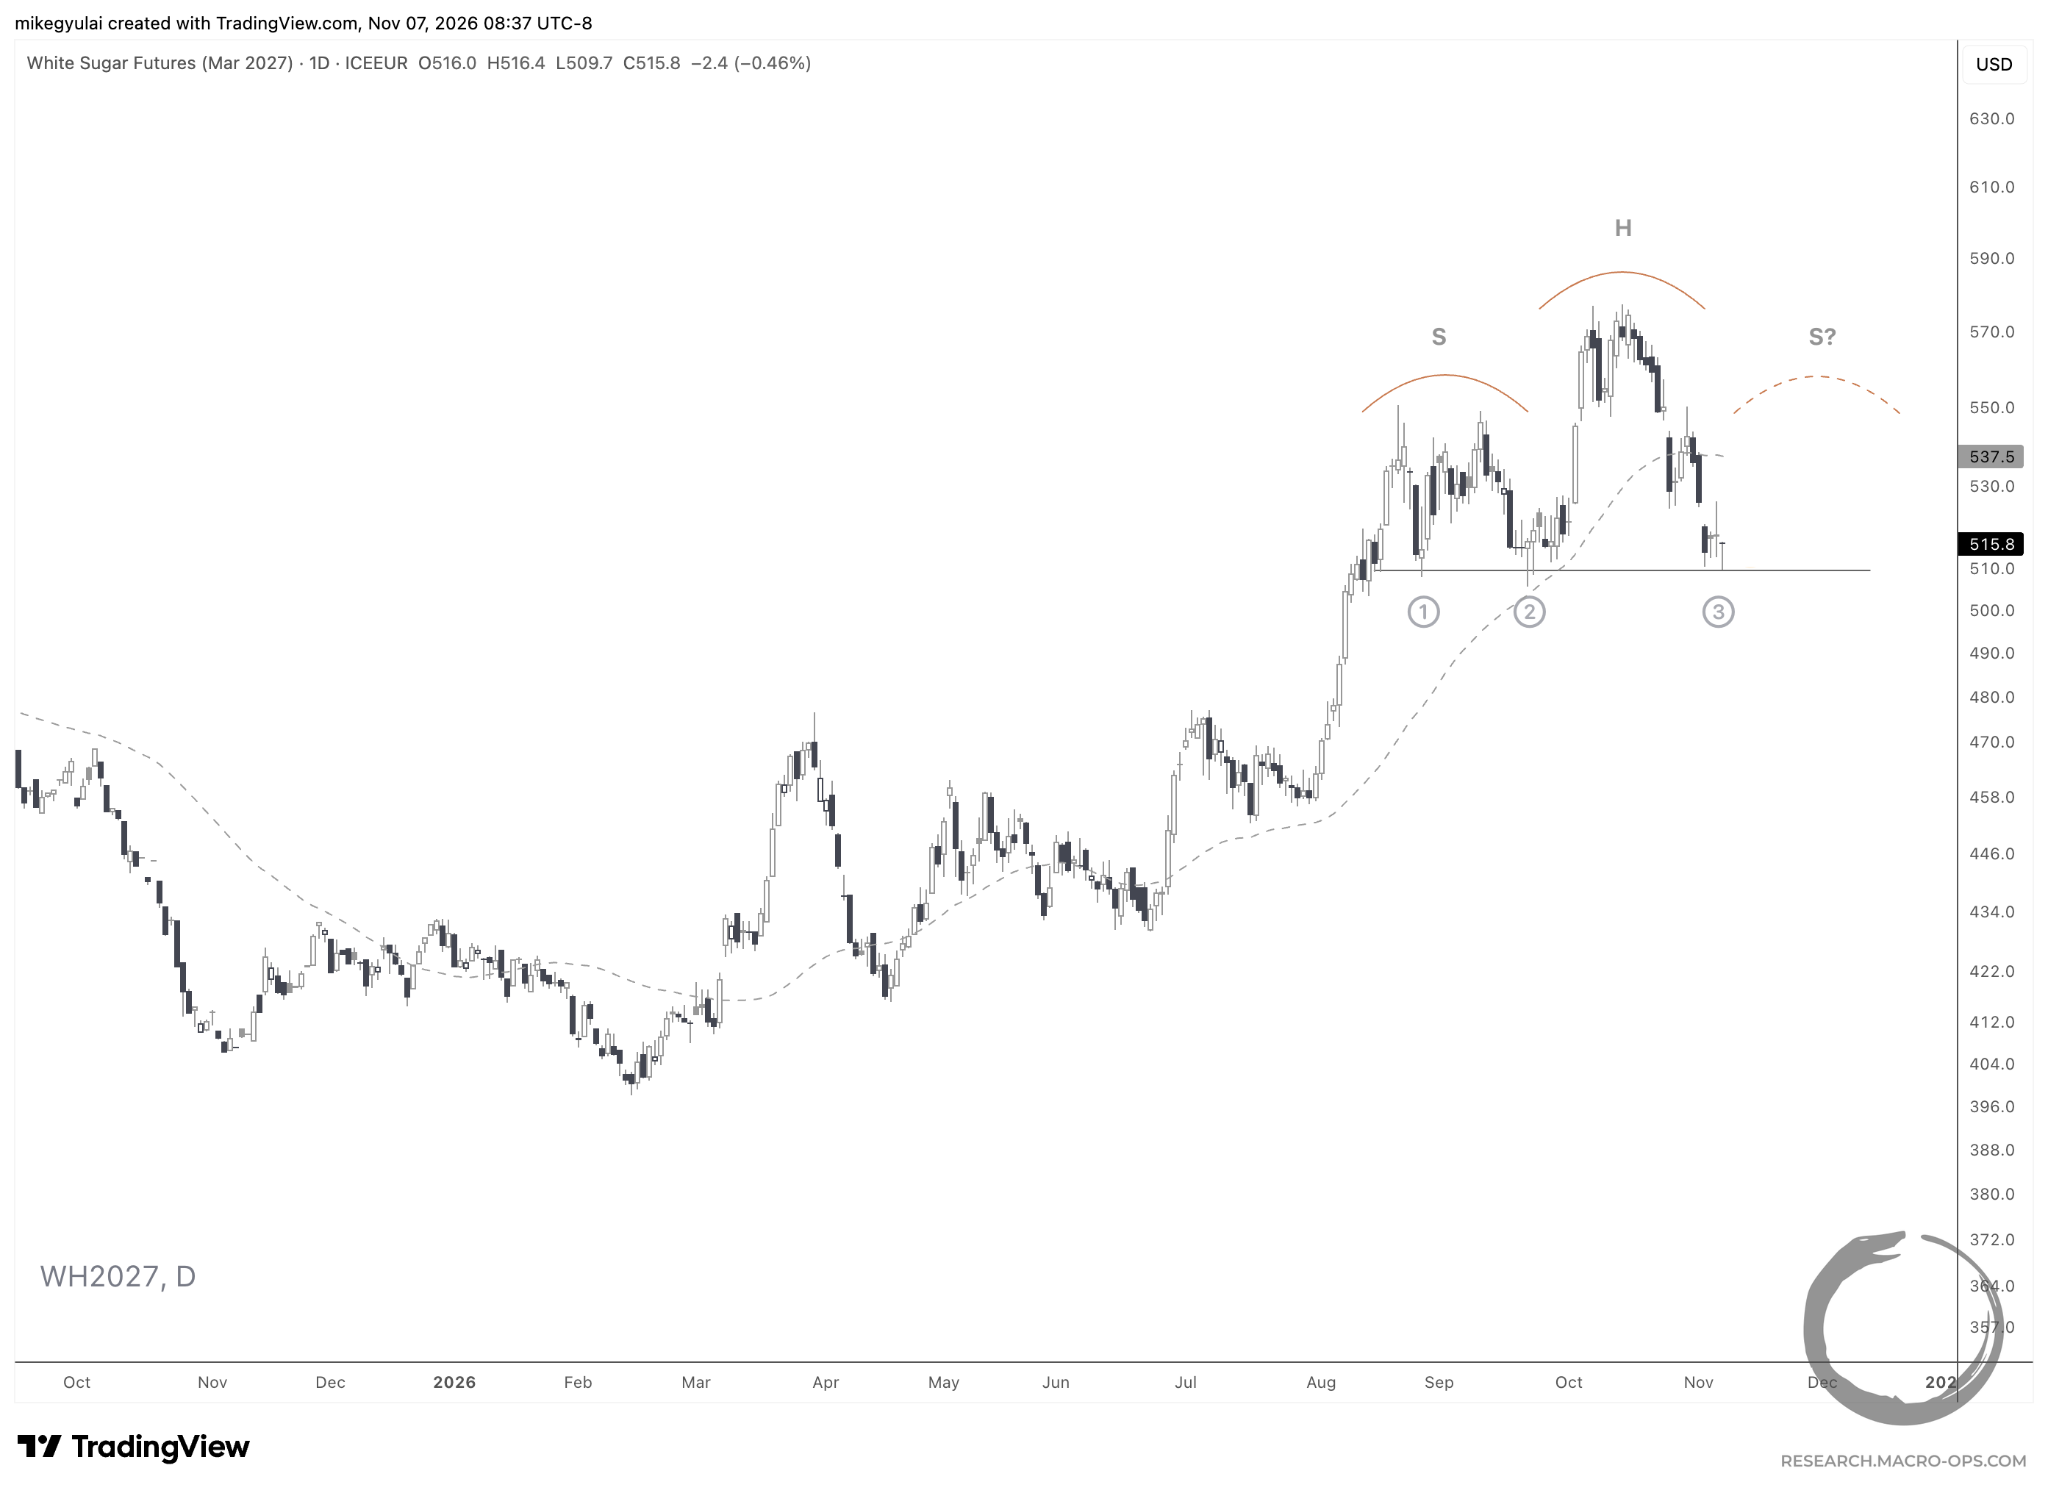
On the March contract, white sugar may be developing a 2.5-month head-and-shoulders reversal.
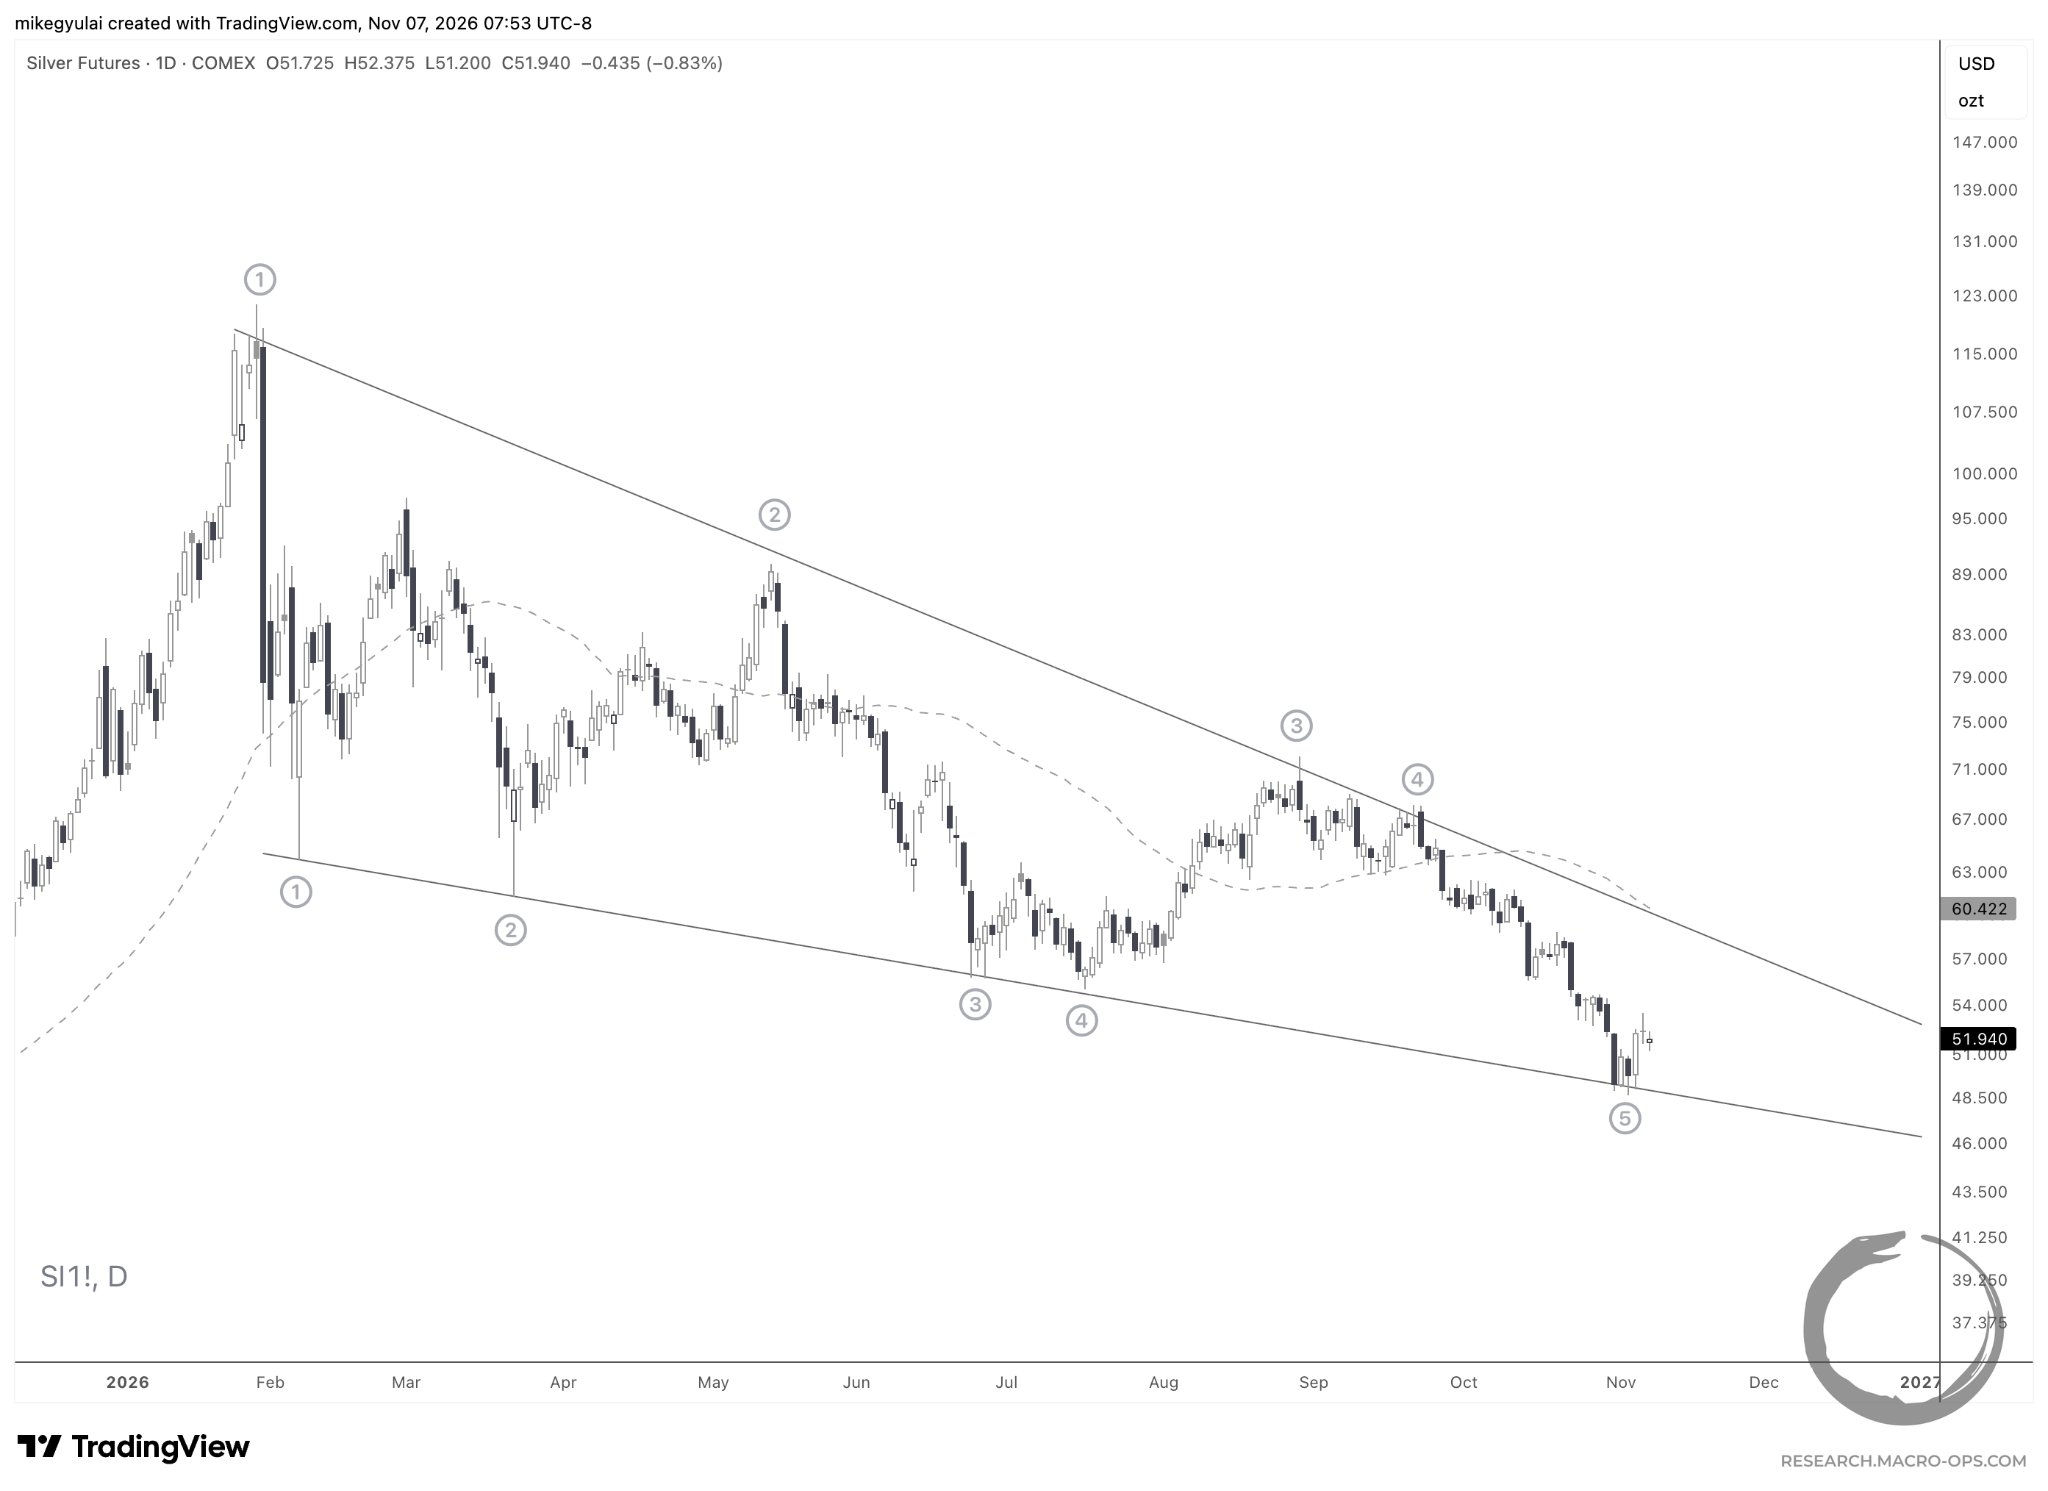
The lower boundary of silver’s 9-month falling wedge, featured in last week’s issue, acted as support this week. We took profits on our short silver position in the Macro Ops portfolio at the boundary line.
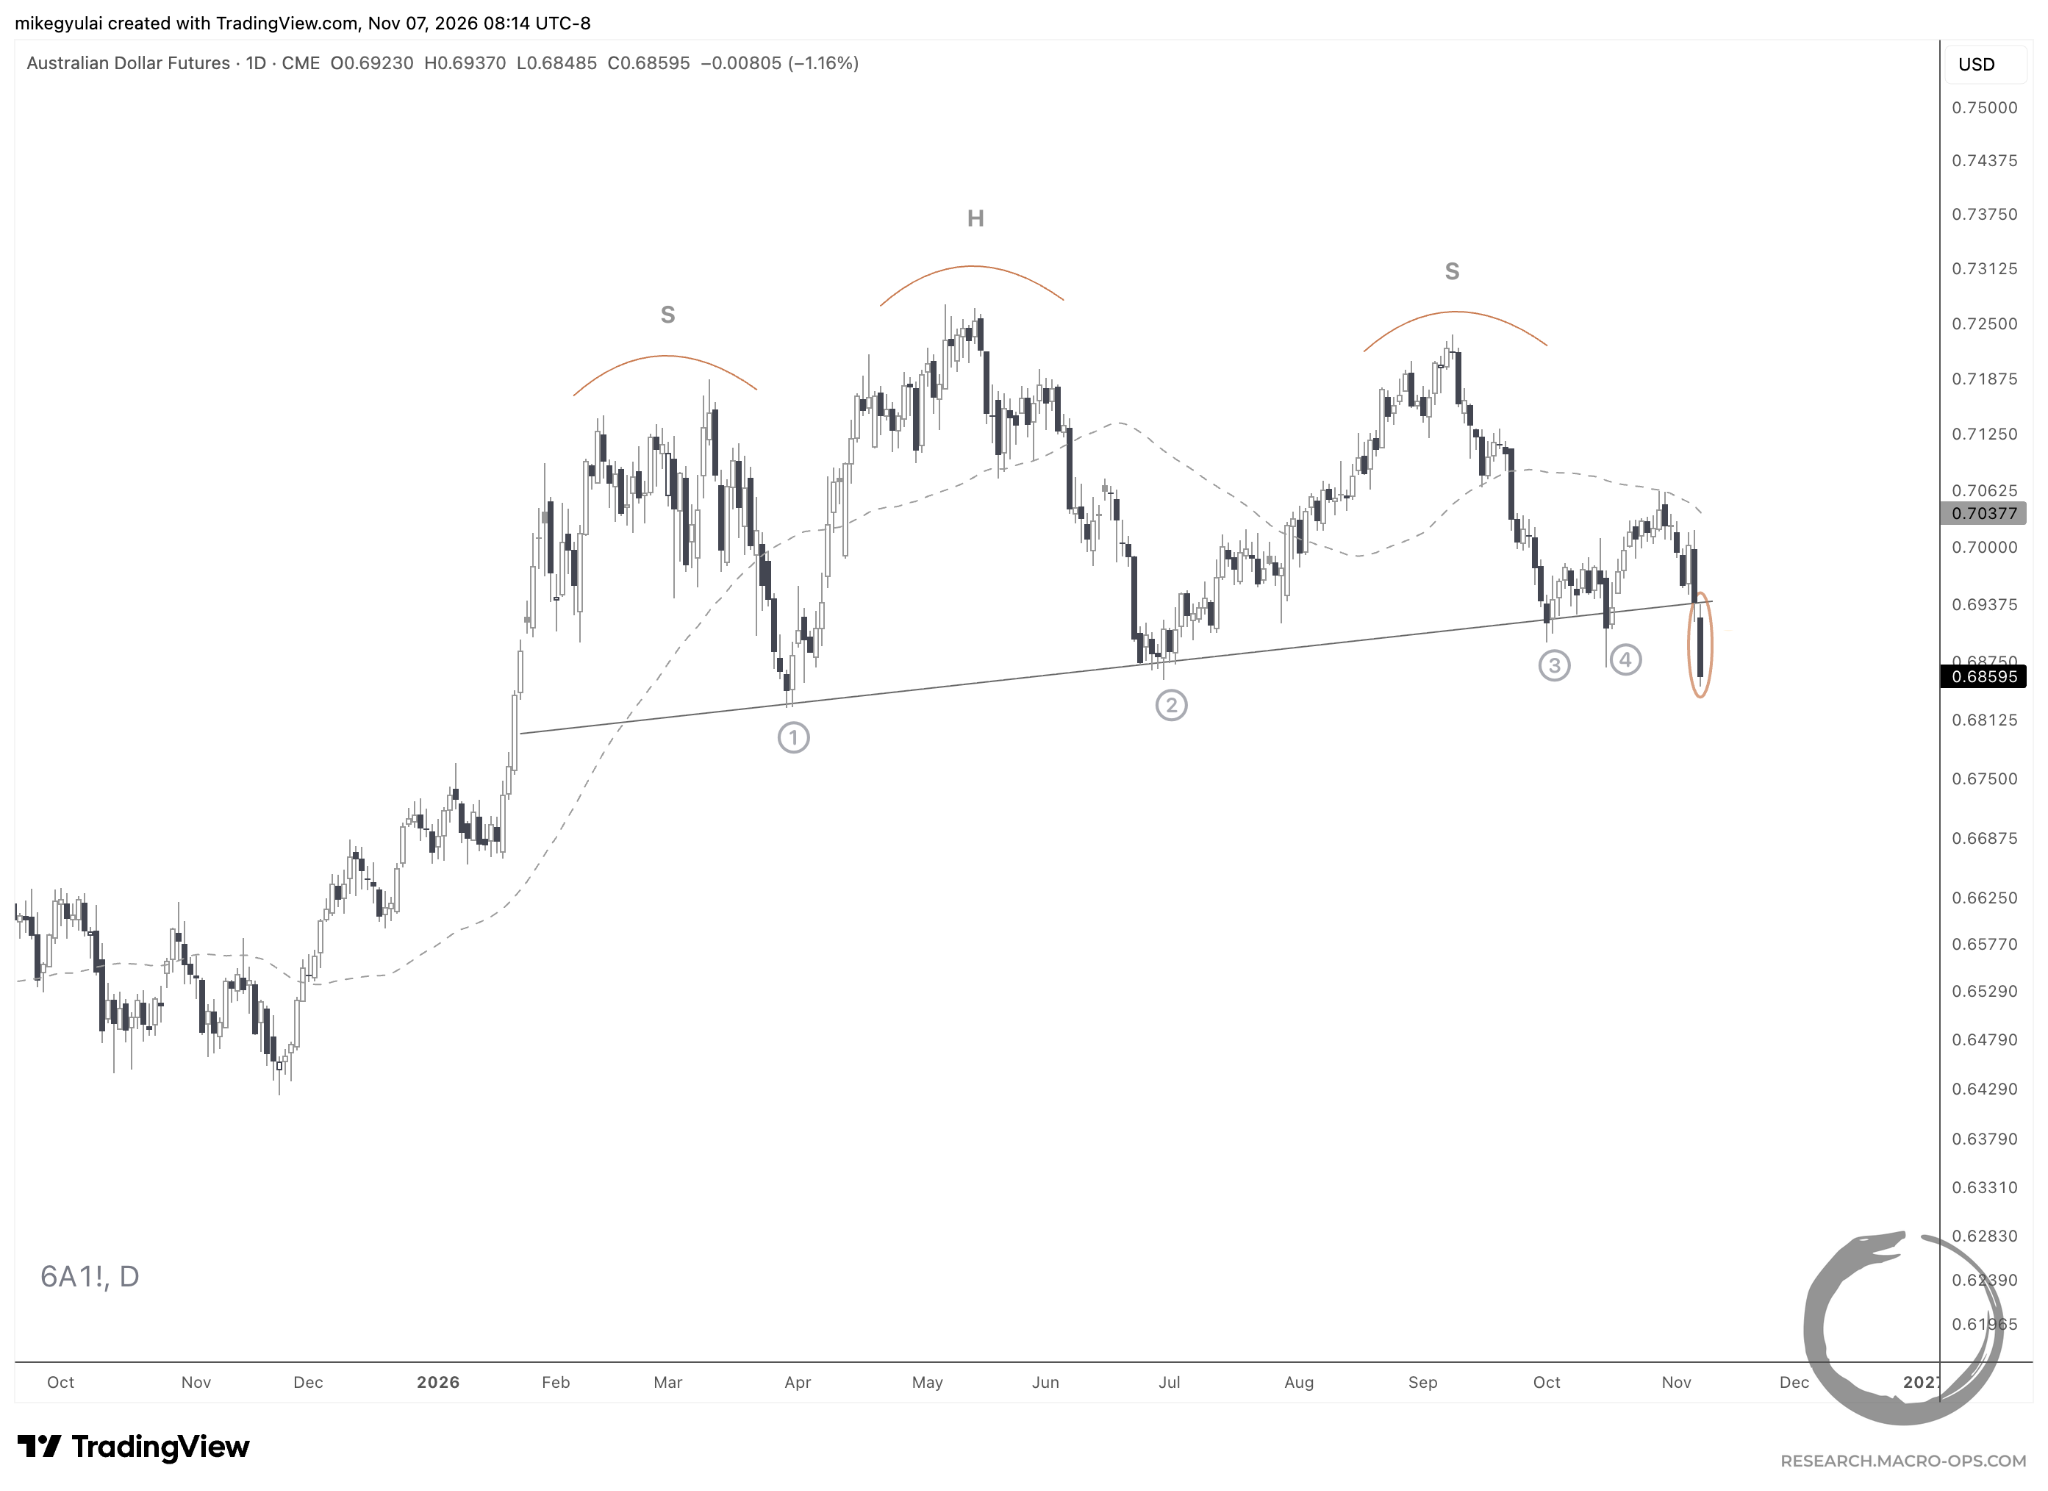
Australian dollar futures broke down on Friday from a 7-month head-and-shoulders reversal.
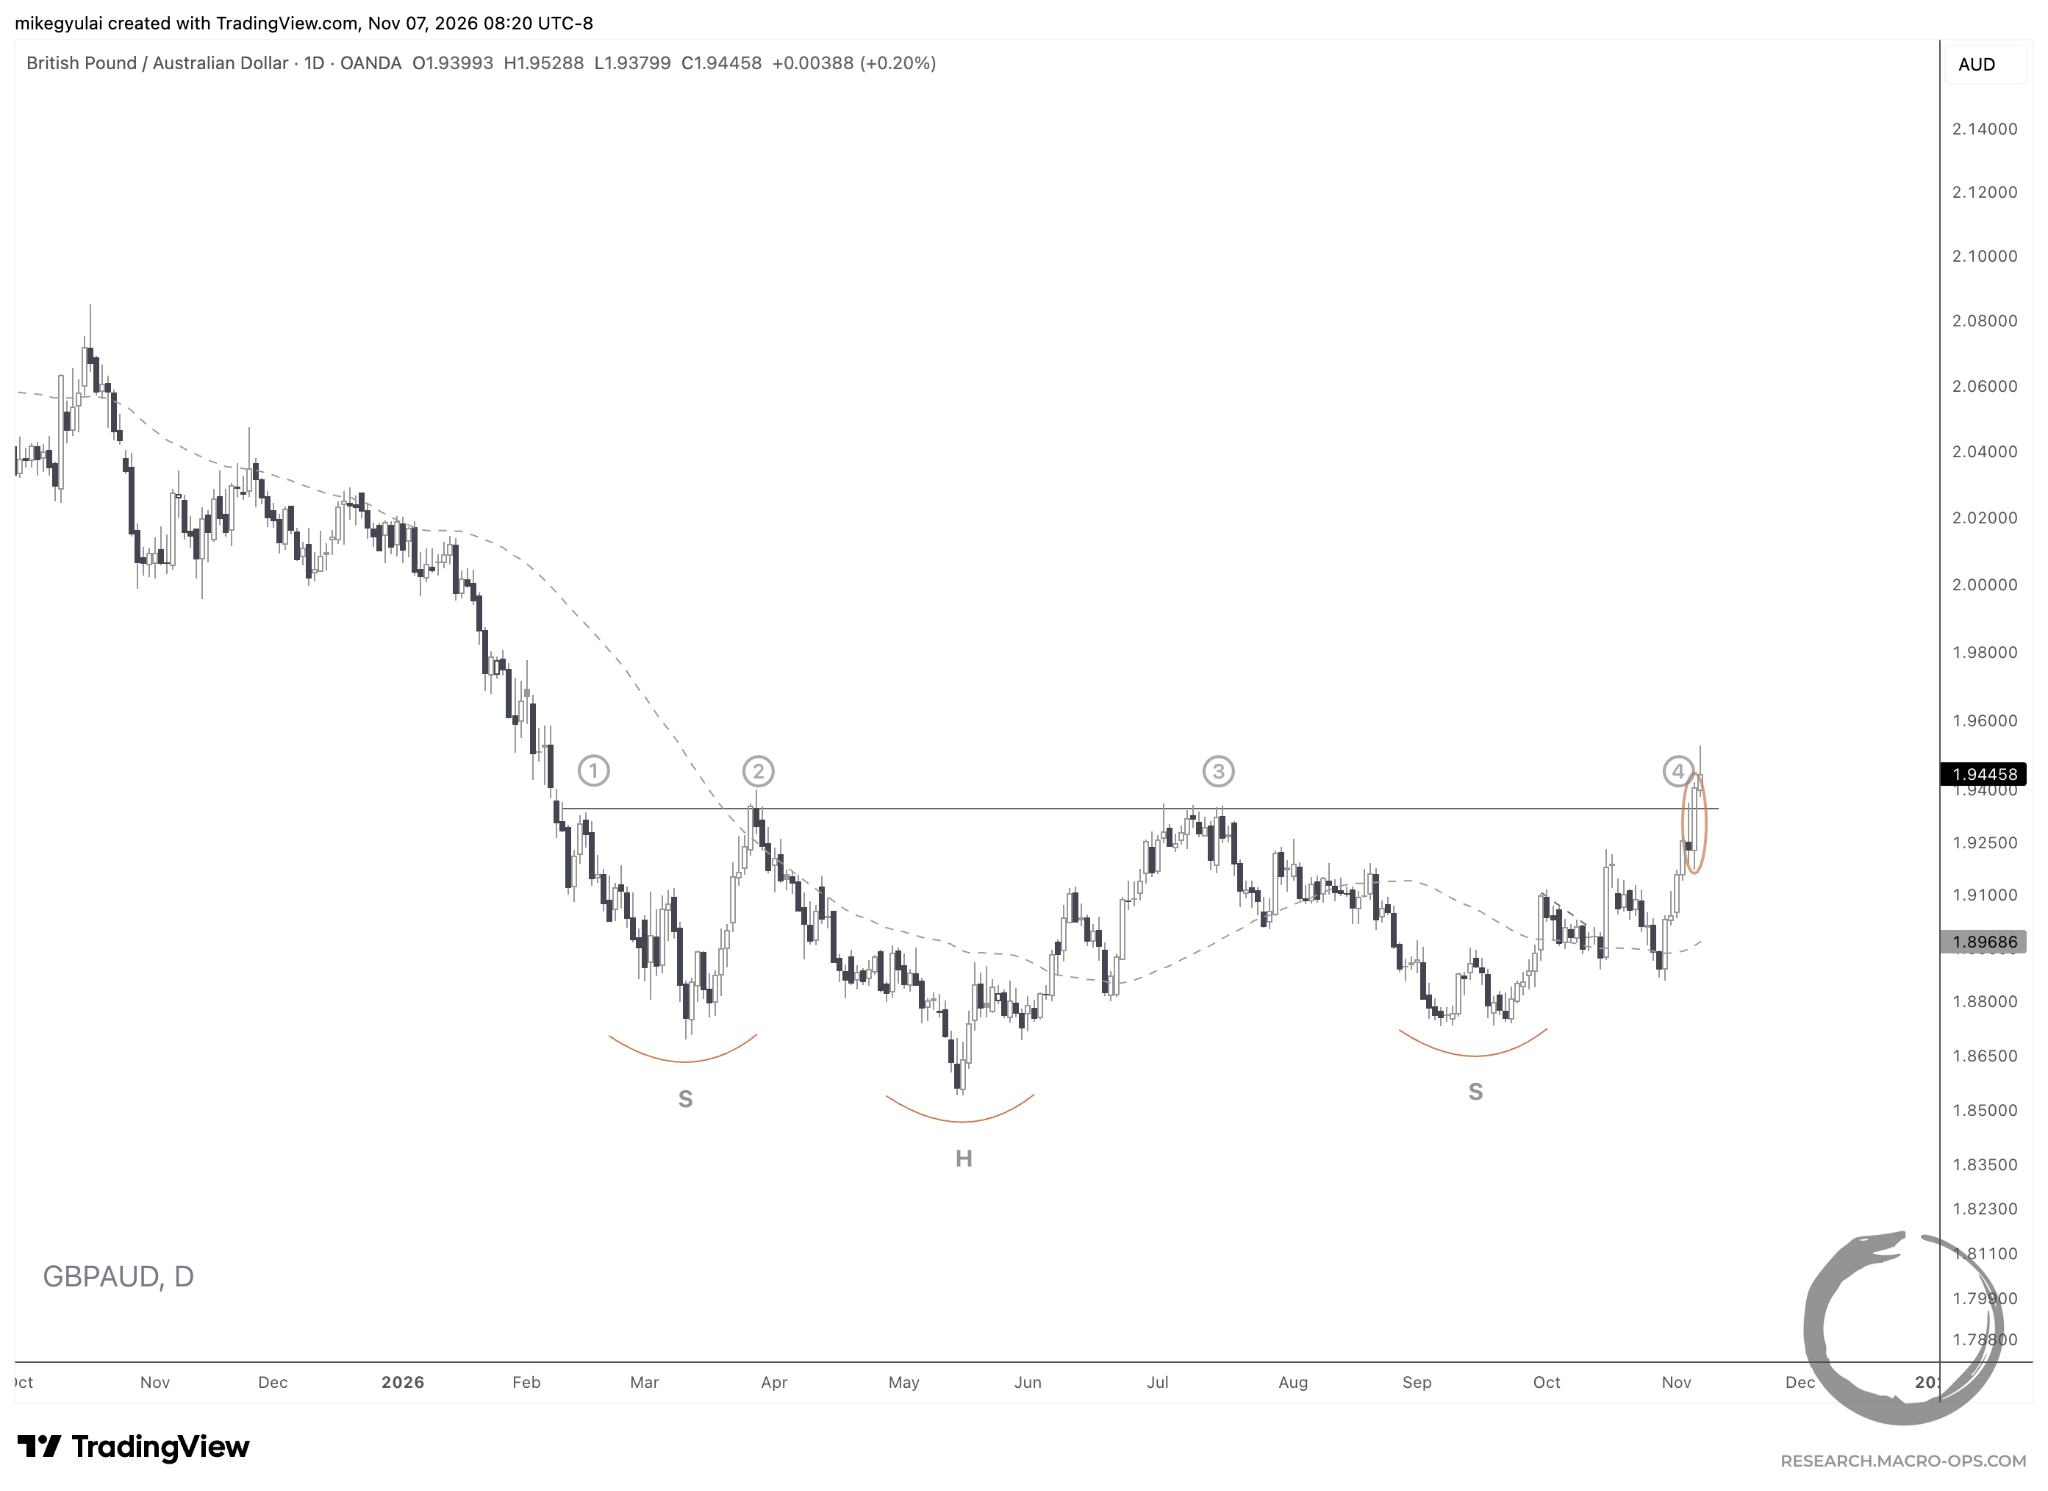
GBP/AUD broke out of an 8.5-month head-and-shoulders reversal.
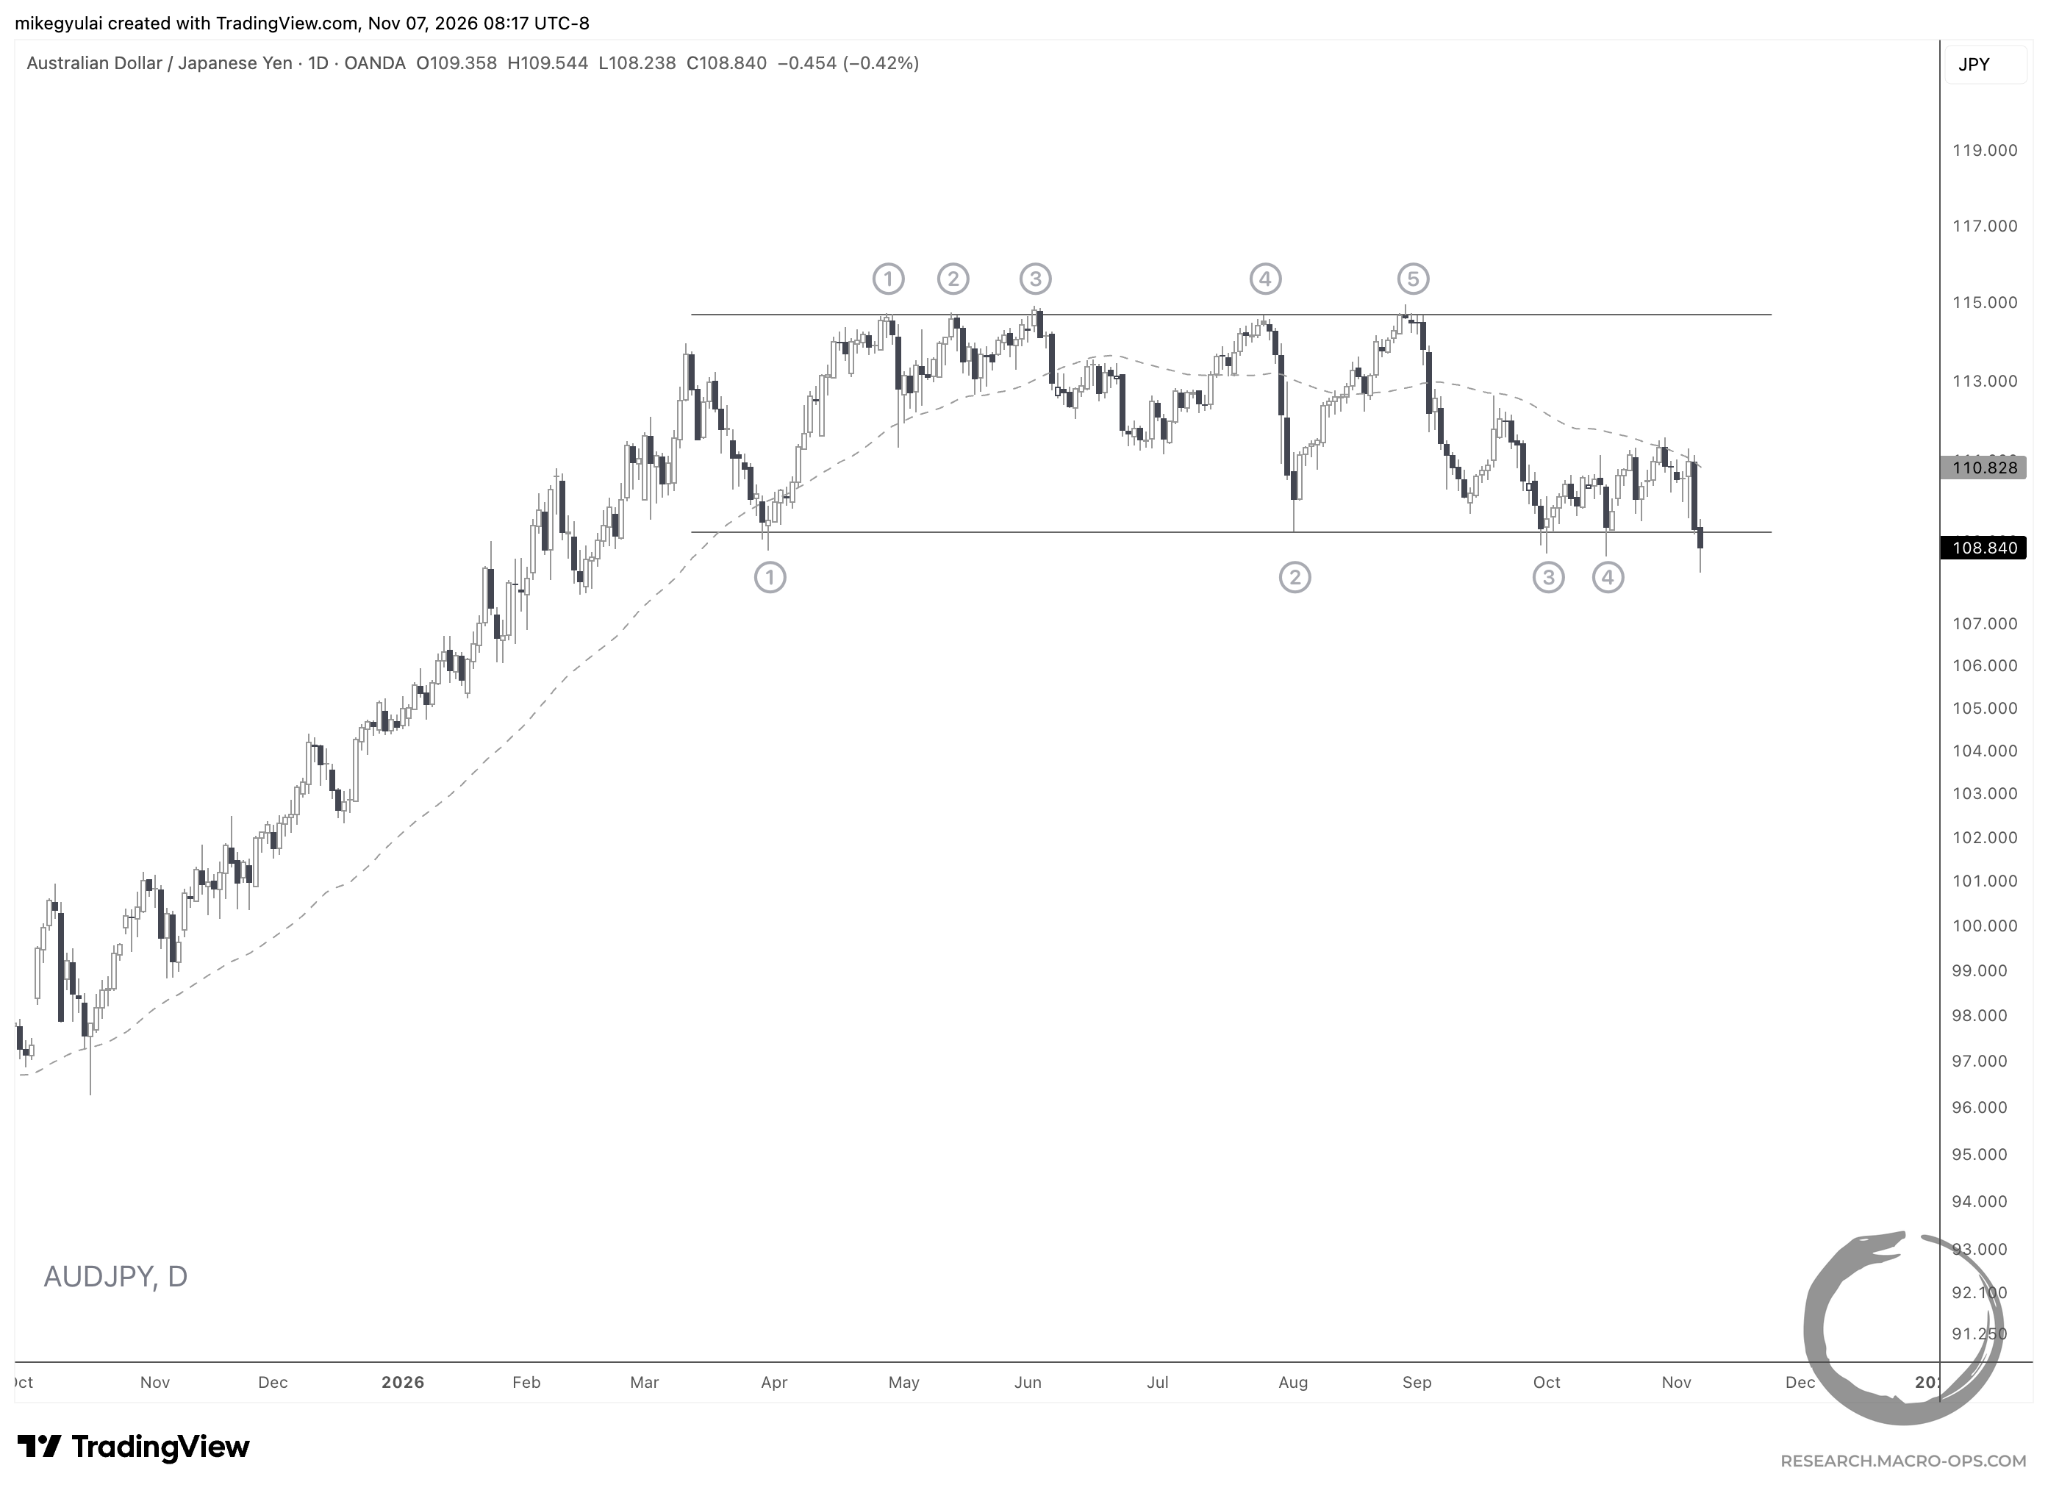
AUD/JPY tested the lower boundary of a 7.5-month rectangle again this week.
The Pauses That Refresh
Here are the equity names that caught my attention in this week’s screen:
Active watchlists, real-time positioning updates, and live portfolio tracking are reserved for members of The Collective, our premier service offering discussions on high-level theory and performance, differentiated research, and a global community of serious traders and investors dedicated to mastery. Learn more about The Collective here.
The double top reading gets support from one gap: the Nasdaq 100 closed about 3.6% under its 200-day average while the S&P 500 still sits less than 1% above its own. Same story as your staples breakout, money leaving growth, not leaving stocks. Does the composite model tell those two cases apart?