



In 1949, two Harvard psychologists, Jerome Bruner and Leo Postman, flashed playing cards in front of 28 students. Each flash lasted a few thousandths of a second longer than the last. After each, they asked the students what they had seen.
Most cards were standard. Hidden among them were trick cards, with color and suit swapped: a red six of spades, a black four of hearts. The students recognized standard cards in about 28 milliseconds. Trick cards averaged 114—four times longer. And across the lengthening flashes, patterns emerged.
First, denial. Nearly every subject called the red six of spades a six of hearts or a black six of spades, with full confidence. Shown it longer, half compromised: “the purple six of spades,” “blackish brown.” Longer still, and for more than half, perception broke down. One subject exclaimed: “I don’t know what color it is now or whether it’s a spade or heart. I’m not even sure now what a spade looks like! My God!” Finally, recognition. “Good Lord, what have I been saying? That’s a red six of spades.”
Every regime change prints a red spade. The first lower high after a two-year advance. The breakout that fails on volume that used to carry it. The hedge that no longer hedges. When this happens, traders risk succumbing to the same reactions as the students. Denial: “healthy pullback.” Compromise: “a correction within an uptrend.” Or the stage that costs the most, disruption: “Does my setup even work anymore?” Recognition finally arrives as it did in Cambridge: late, and in self-reproach.
The study did offer consolation. A subject who had seen only standard cards was no faster to recognize his first trick card than one who had seen no cards at all: 360 milliseconds. But a subject who had already encountered a trick card needed just 230. Two or three, 84.
A decade of ordinary cards does not teach you to see the trick card. Only trick cards do.
Which is why the risk-taker who sat through 2008, or 2020, or 2022 can name the next regime before the one who has only ever been dealt hearts. Not because his predictions are any more accurate. Because he has already denied a red spade, compromised with it, and learned what late recognition costs.
The market shuffles the next red spade into the deck as you read this. Acknowledging that fact is what veteran traders call humility. The study measured it as reaction time. And it improves with every red spade you encounter.
Tension Resolved
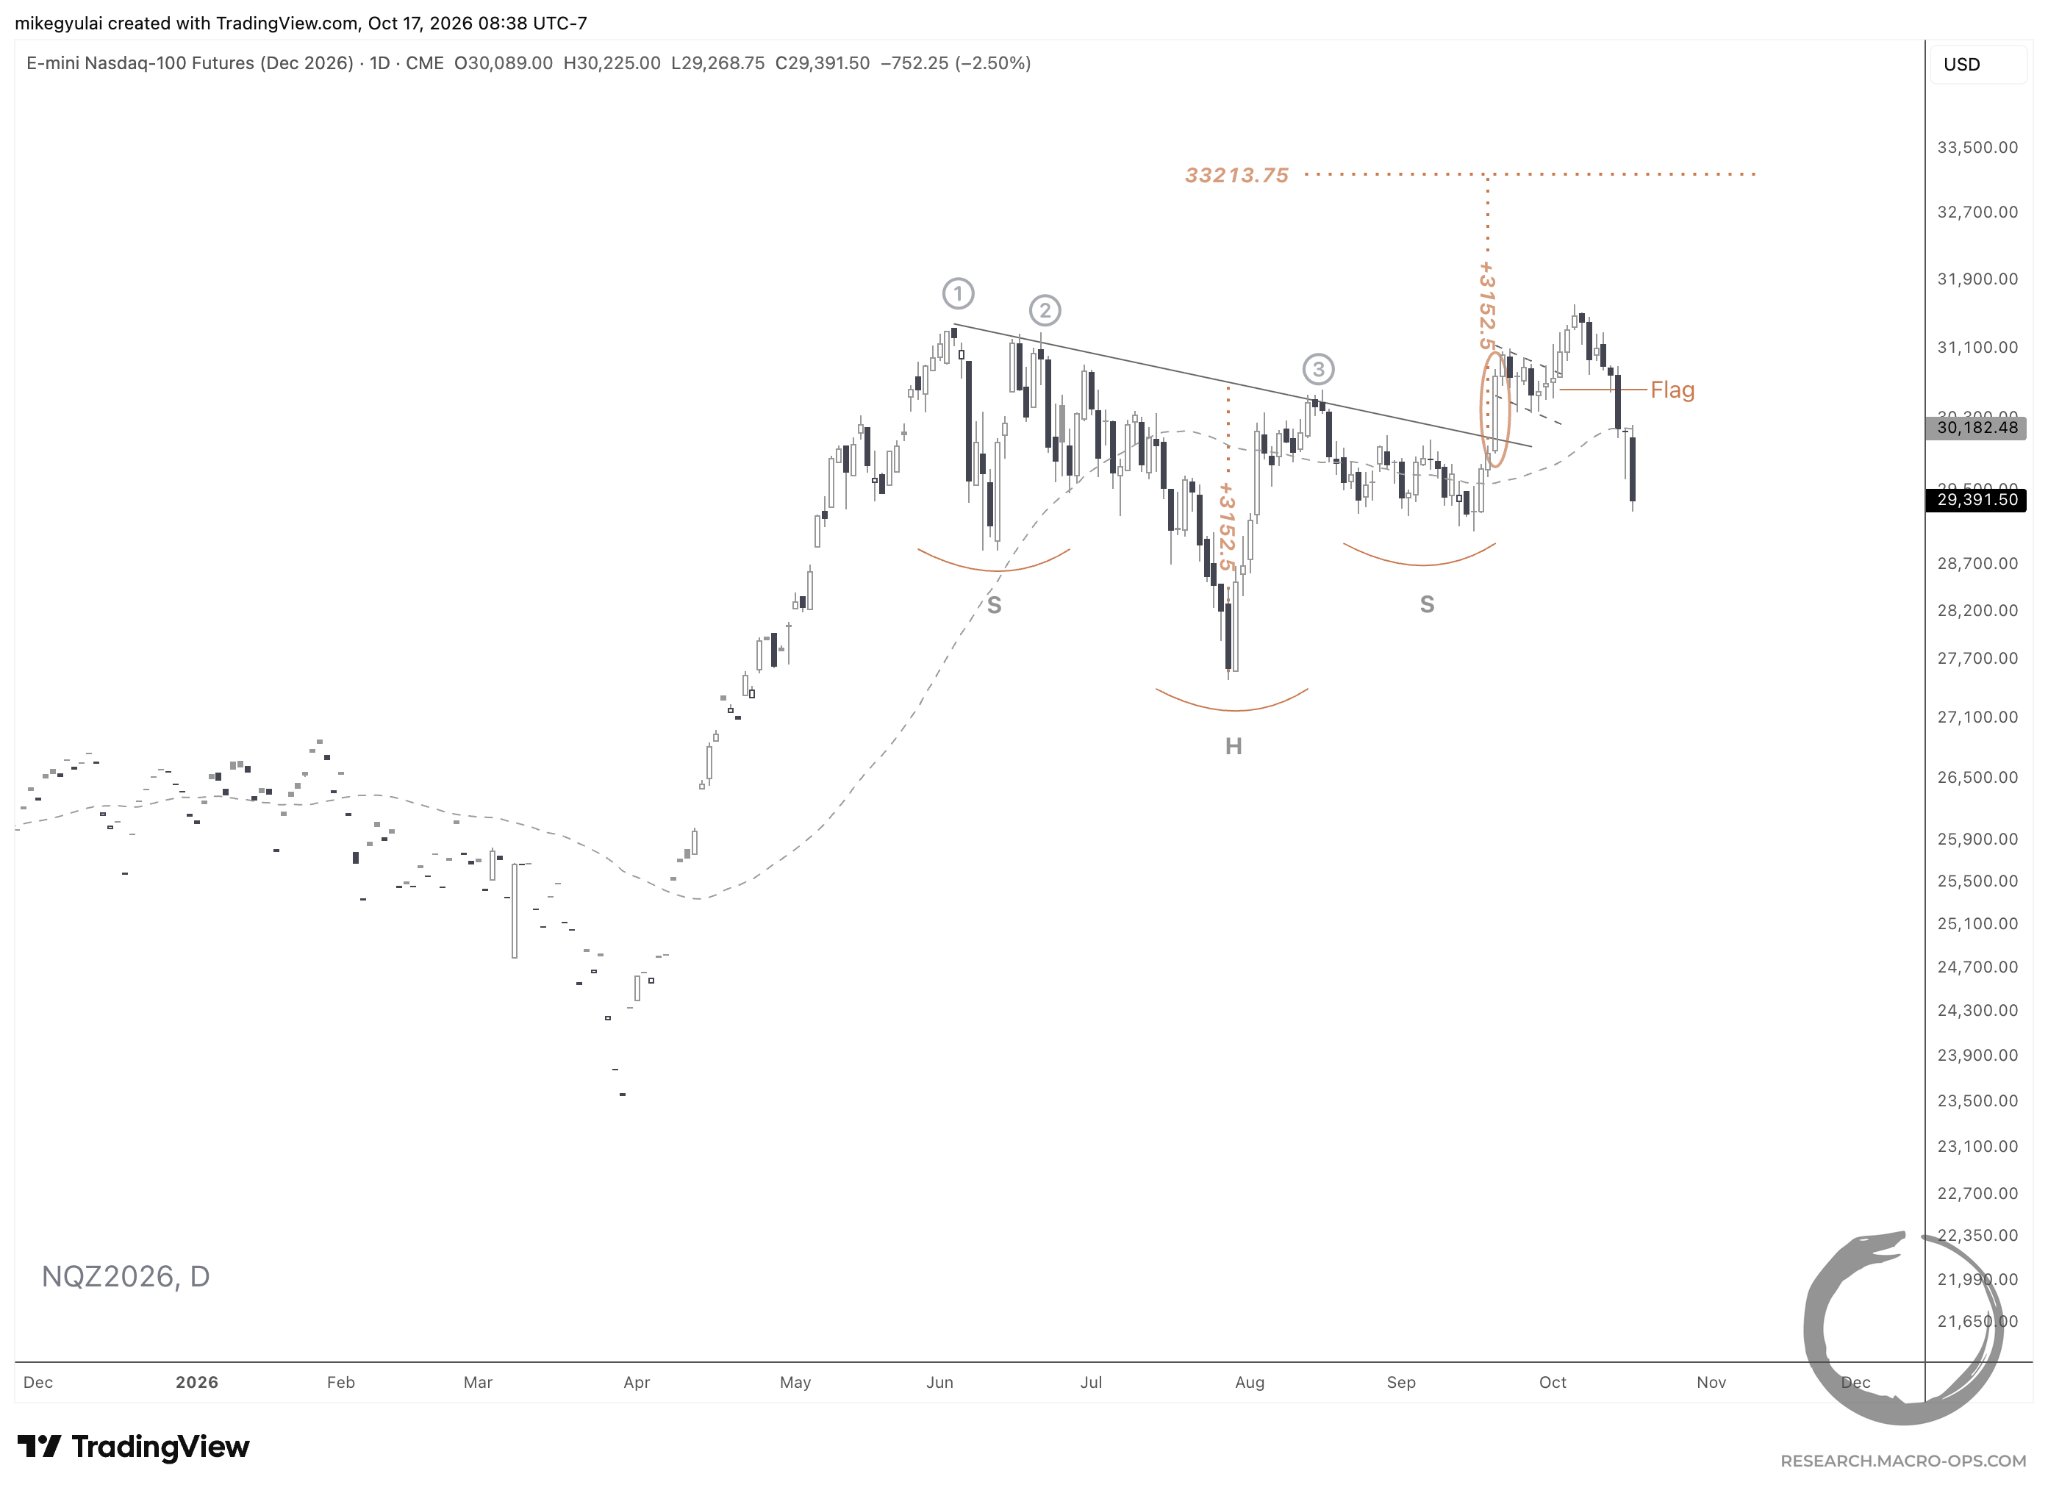
For the past two weeks, we’ve highlighted tension between equities and energy. Both looked poised to rise. One had to give. This week gave us the resolution, with the Nasdaq selling off sharply after stalling roughly halfway to the 1x measured move target of its 3.5-month head-and-shoulders continuation. The small flag that formed at the end of September offered a key level to revise stops. We closed our Nasdaq long in the Macro Ops portfolio last week, on the bull flag’s failure to follow through.
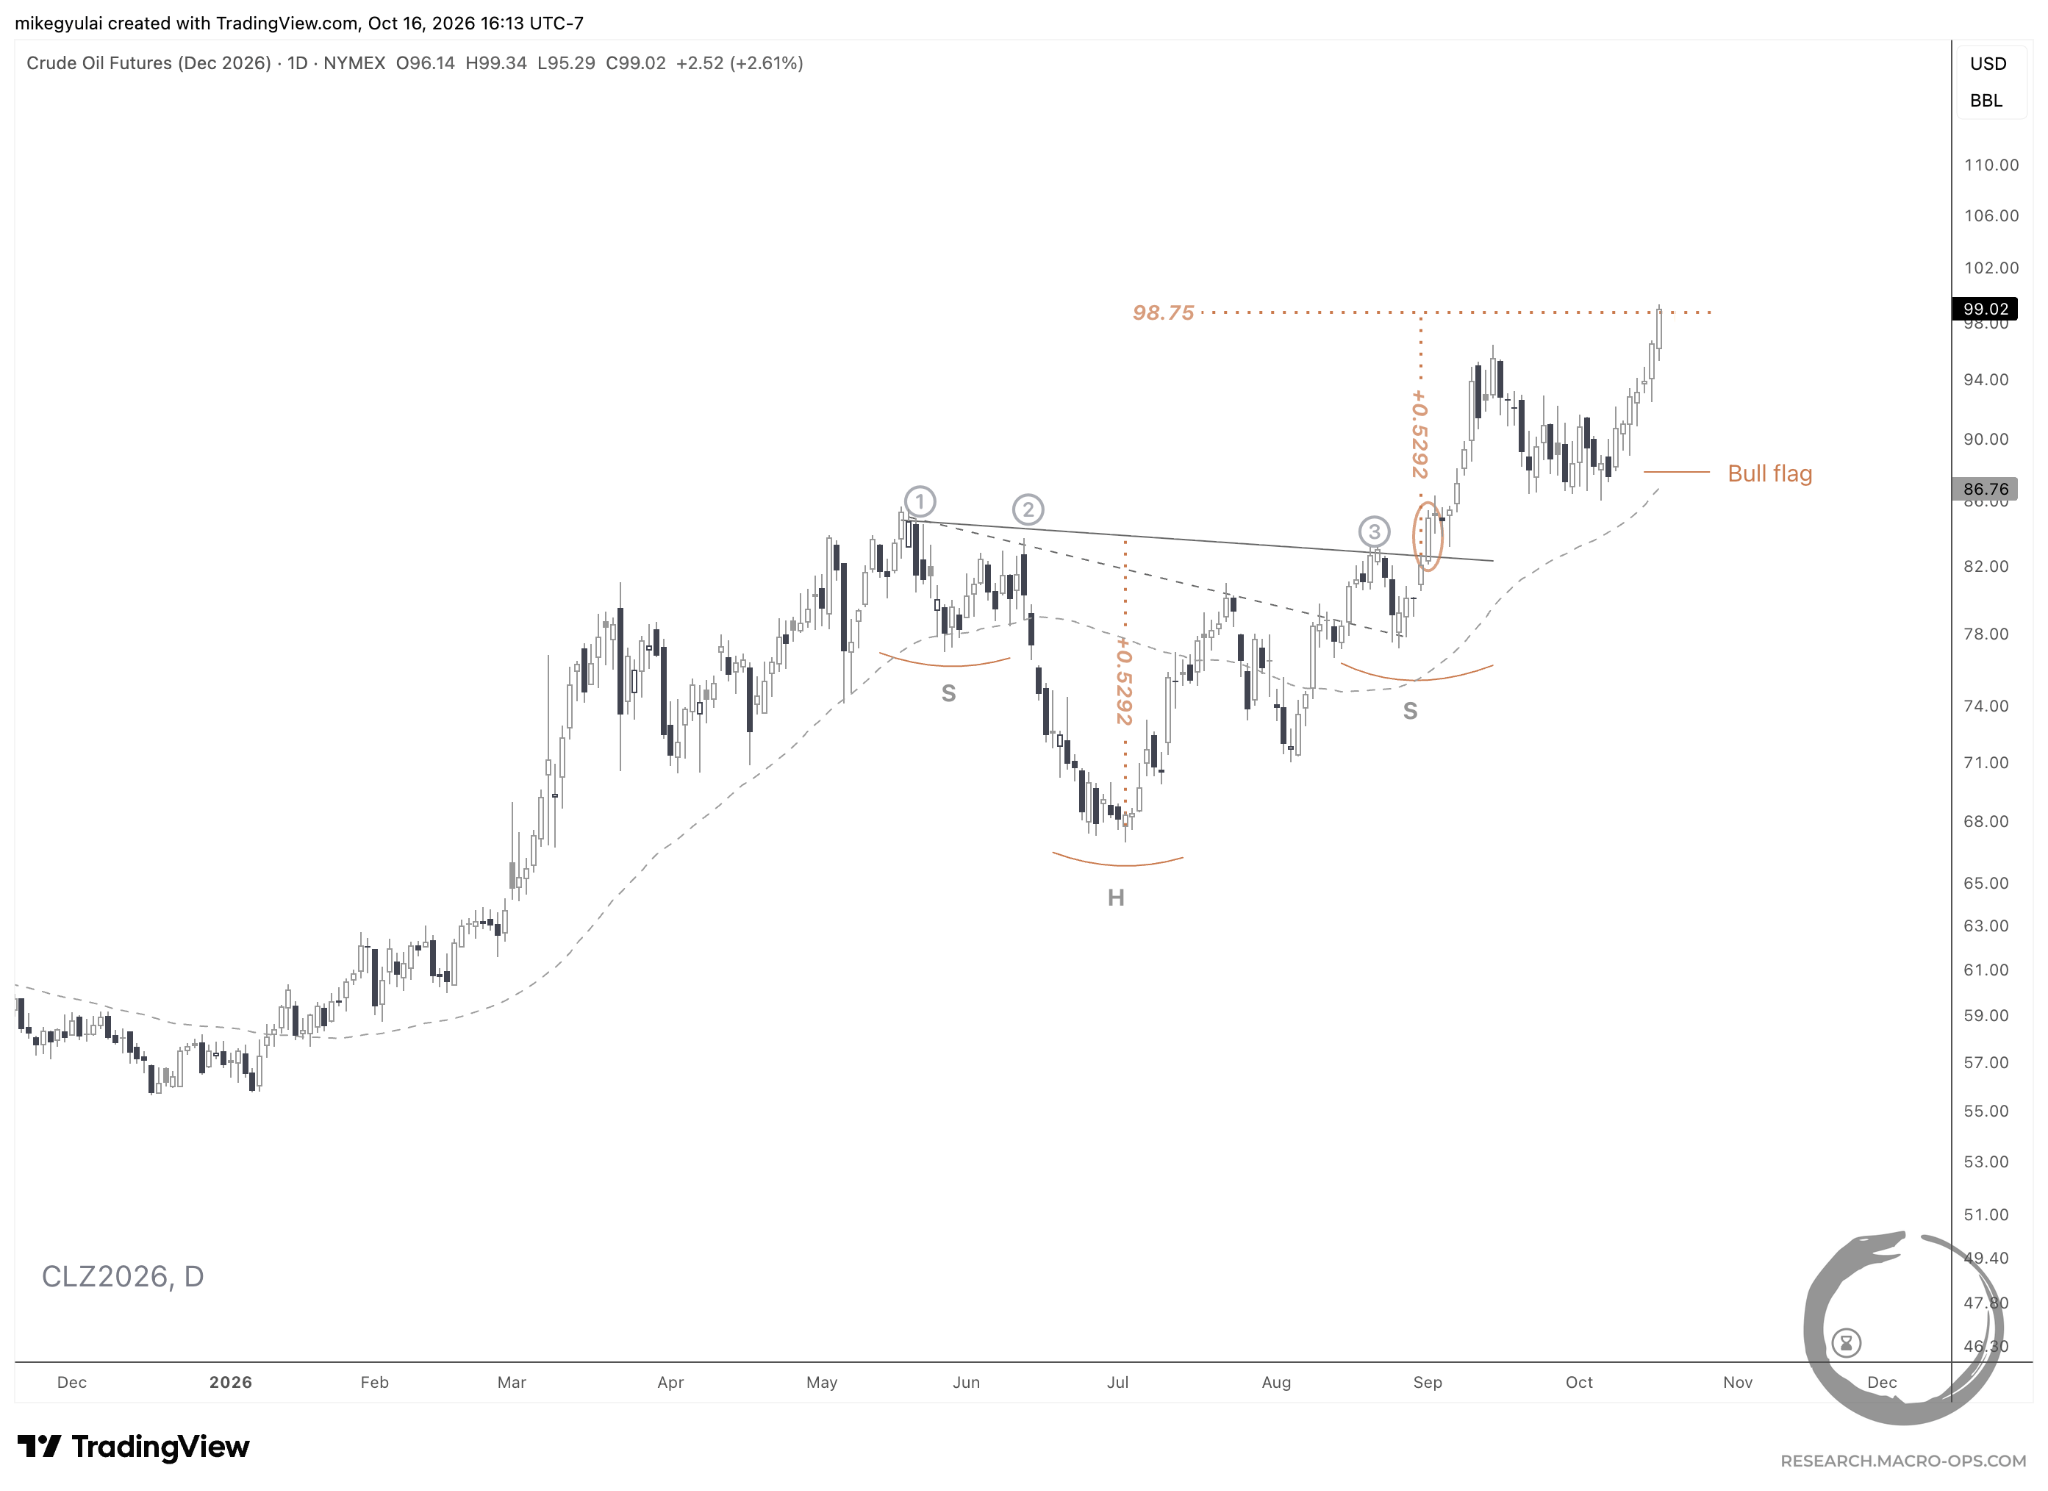
Energy, meanwhile, pushed higher, with December WTI crude completing the bull flag cited last week. Price reached the 1x measured move target of 98.75 on Friday for the underlying 3.5-month head-and-shoulders continuation.
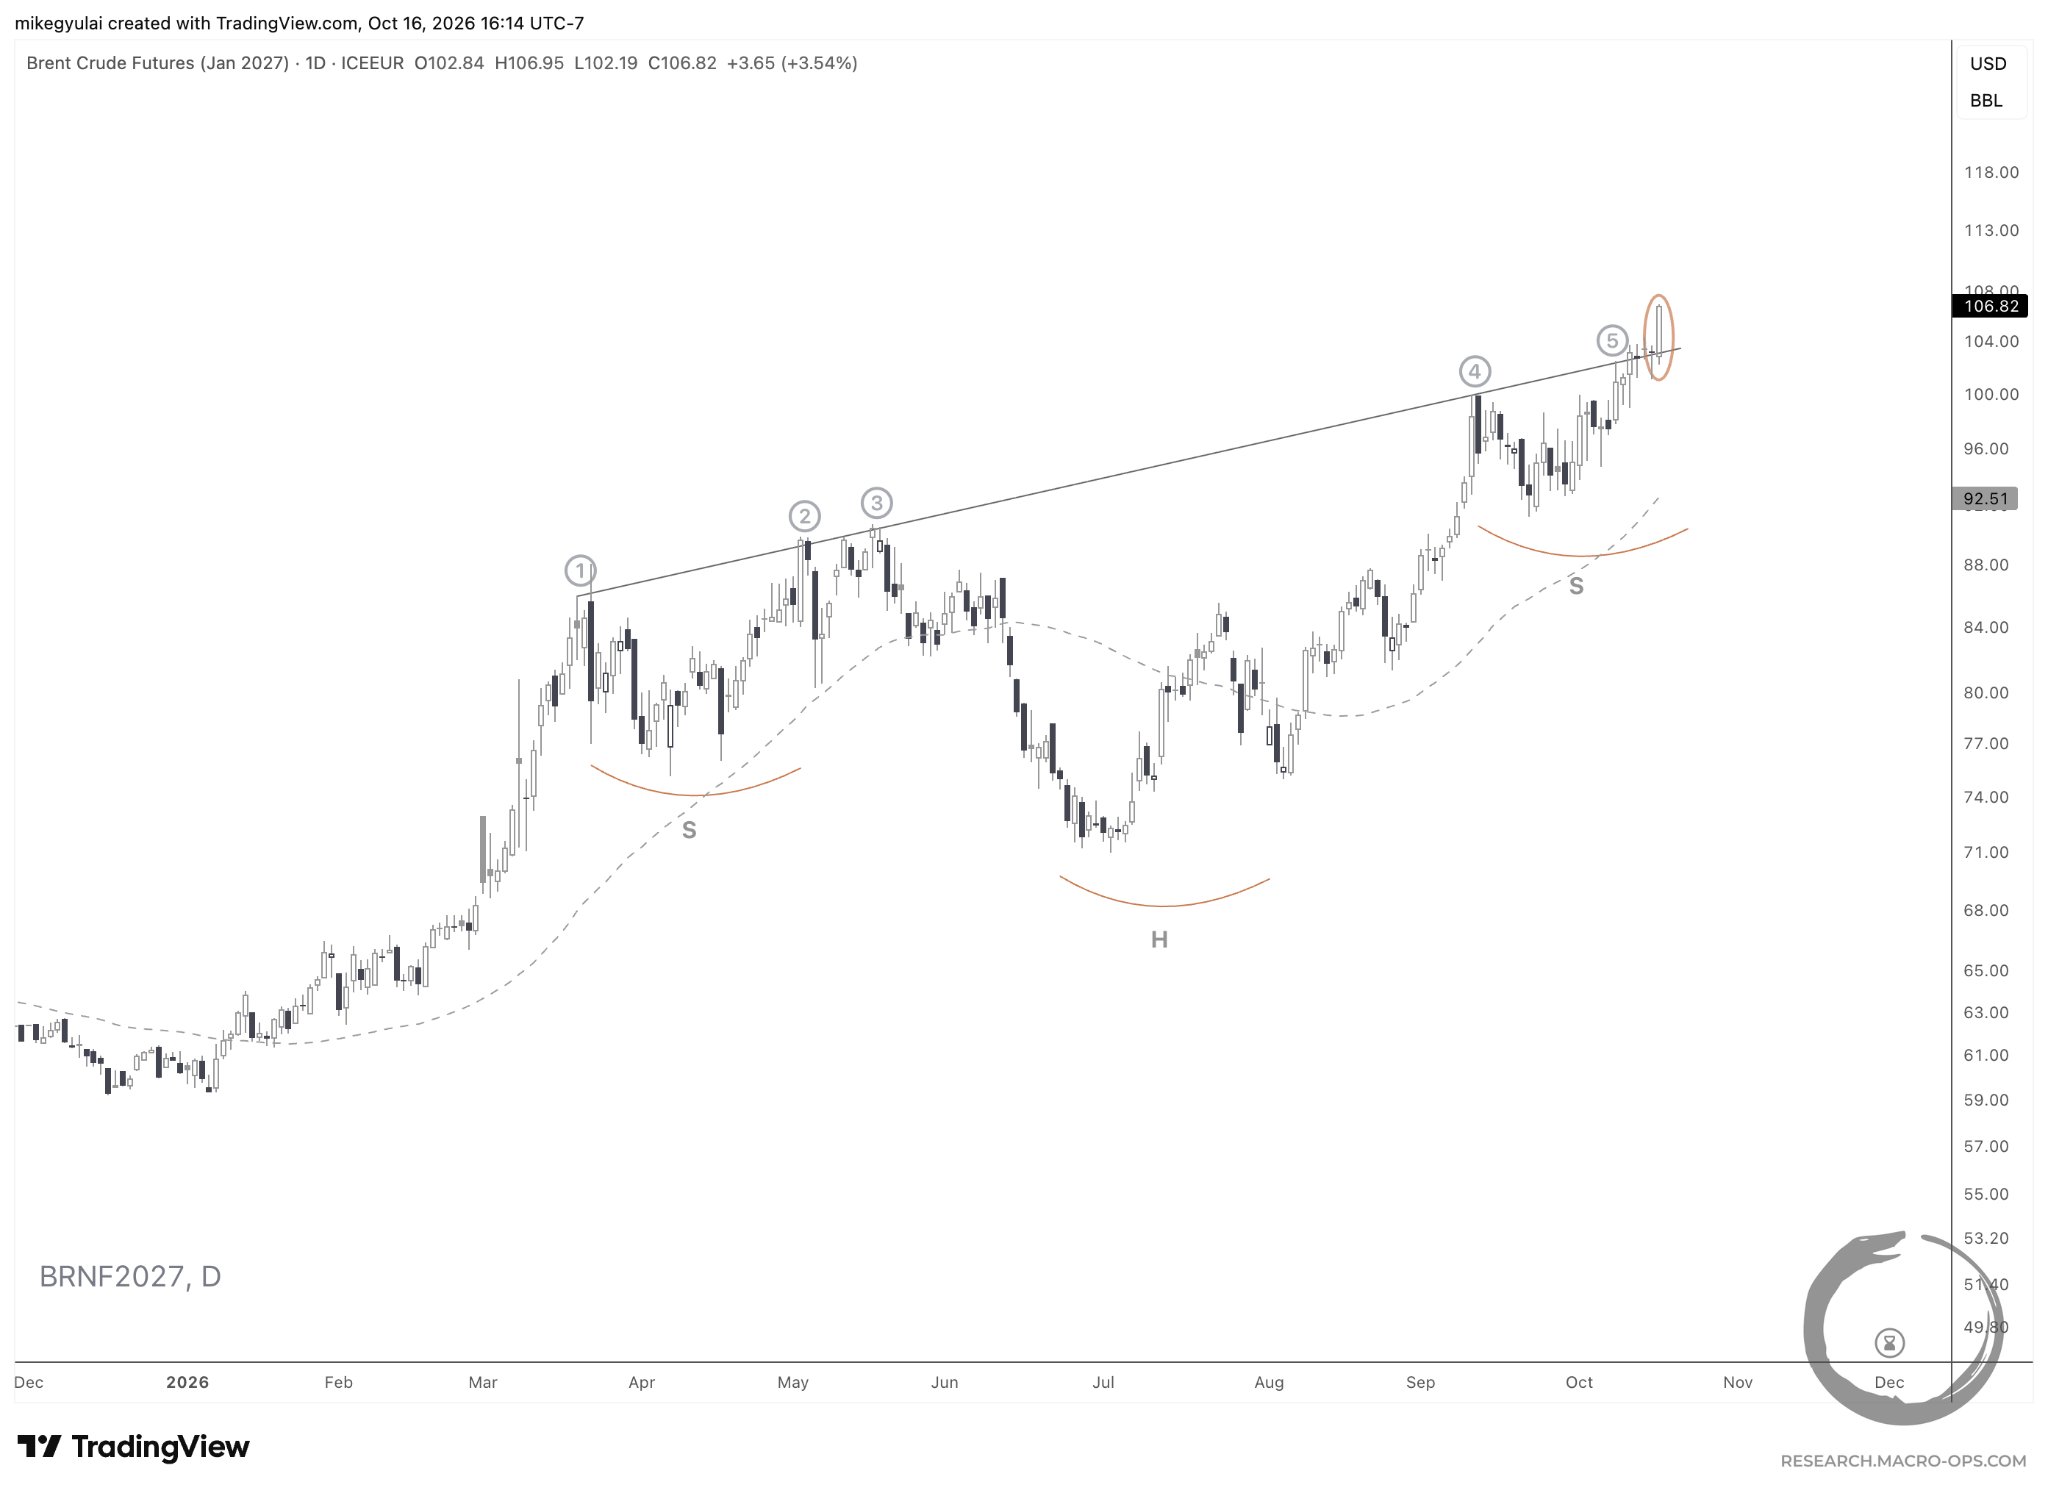
January Brent also broke out on Friday from a 7-month head-and-shoulders continuation. The upward-sloping neckline displays the strength of the trend thus far. We’re long both December Brent and November heating oil in the Macro Ops portfolio.
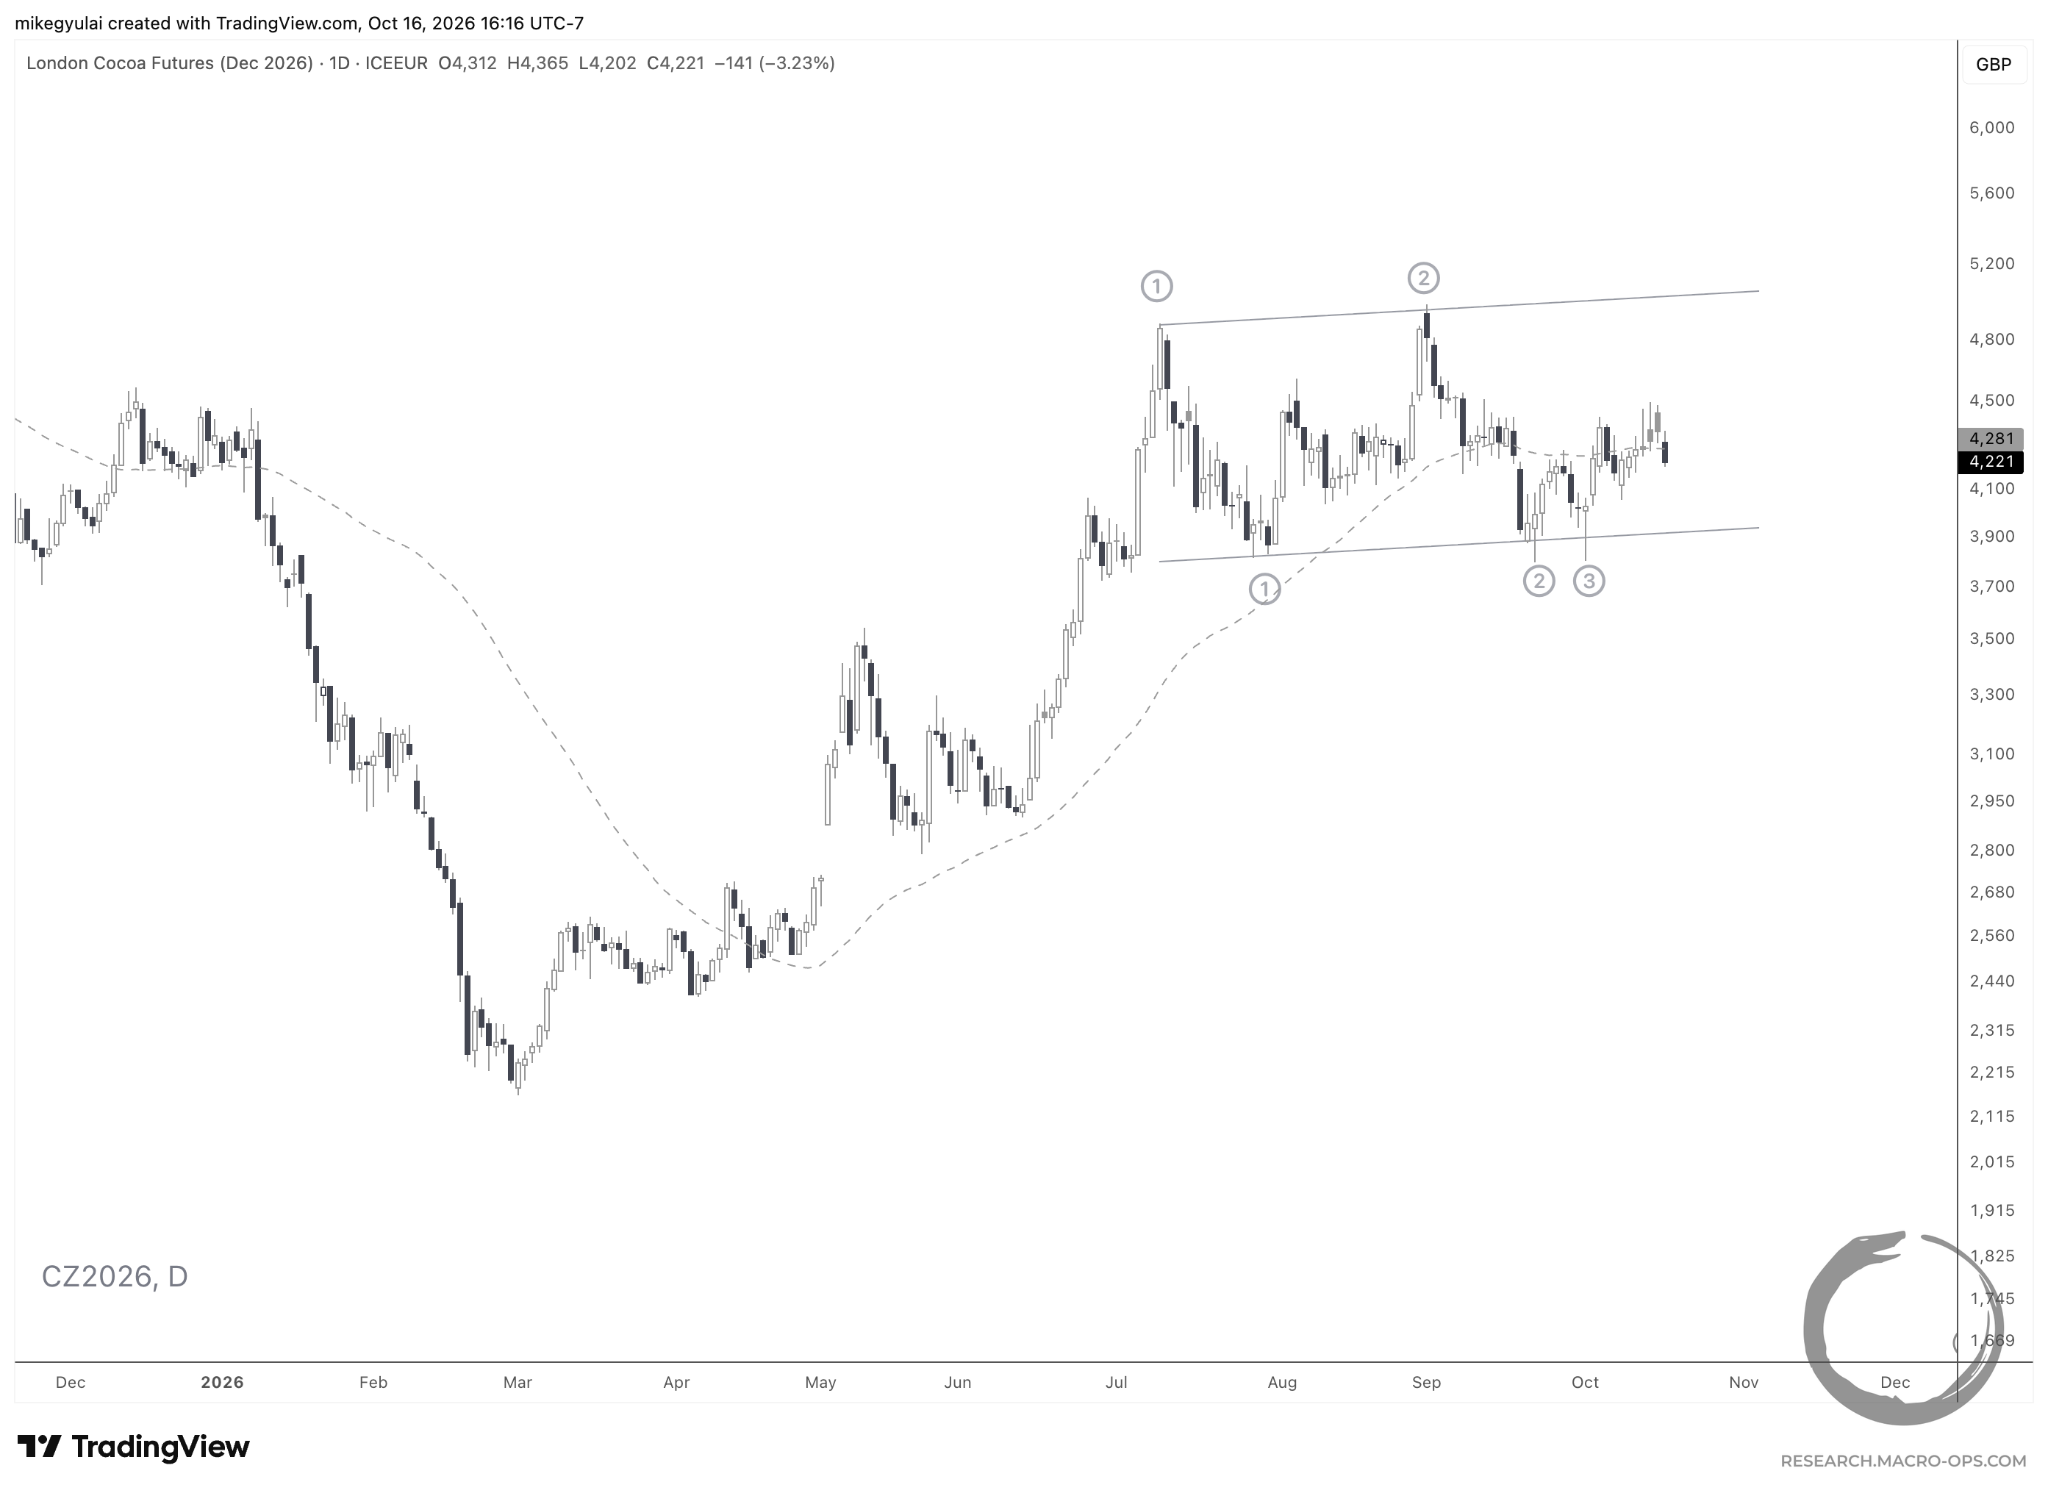
Elsewhere in commodities, December London cocoa continued to consolidate inside a 3-month ascending channel.
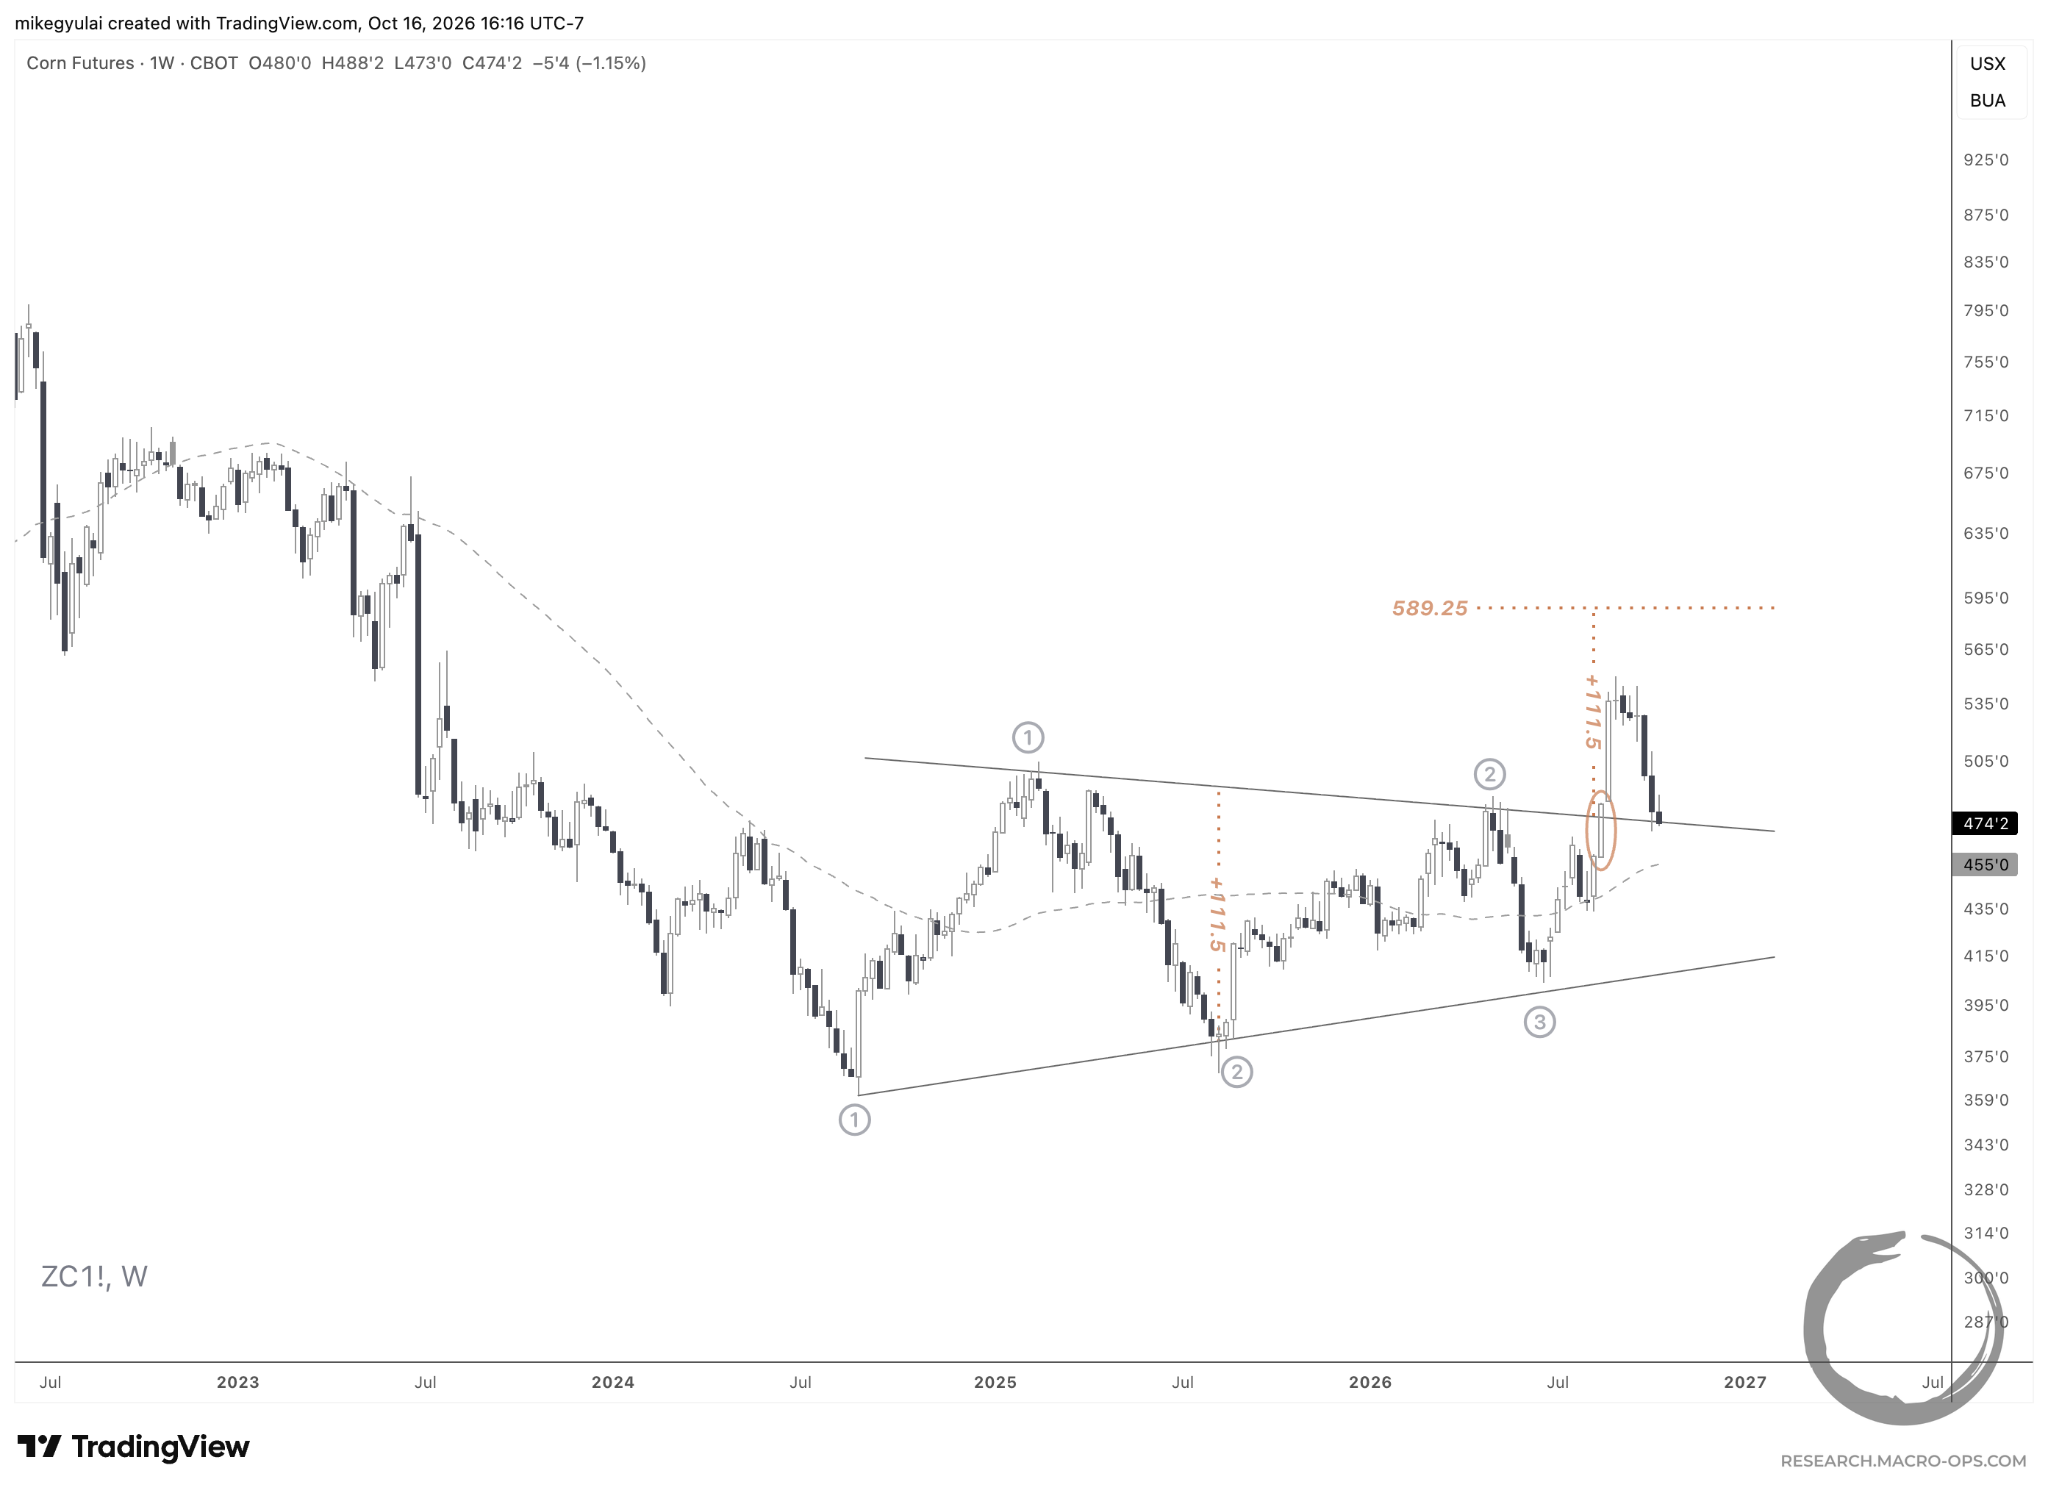
Corn futures sold off hard last Friday following the USDA Crop Production report and found little relief this week. Price is now retesting the upper boundary of a 2-year symmetrical triangle.
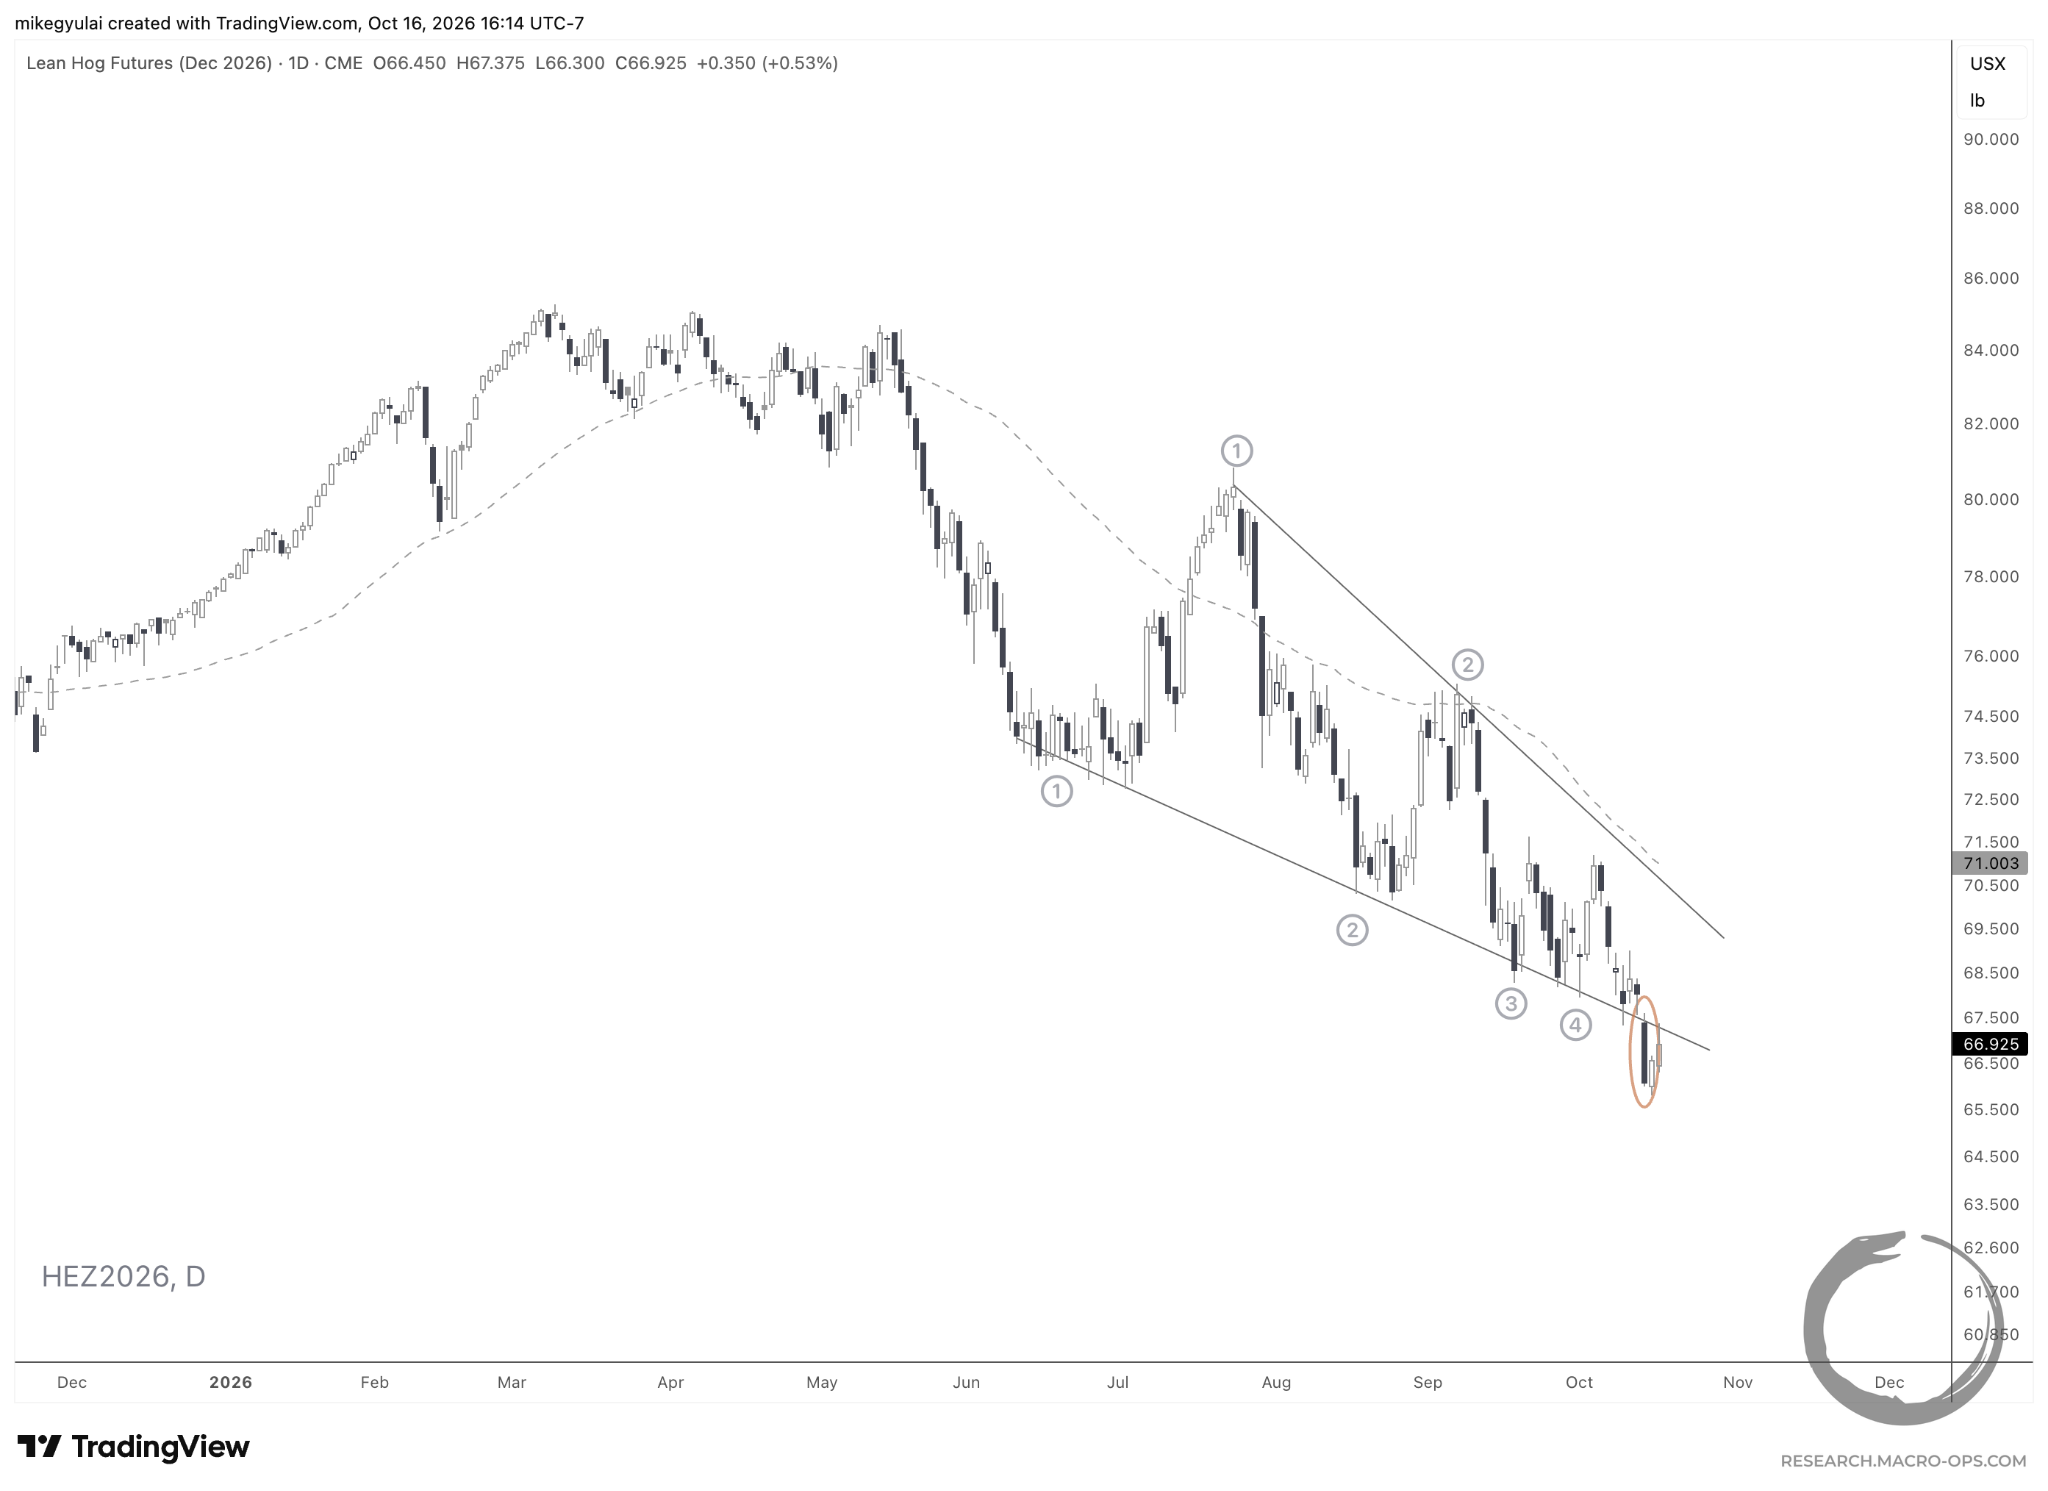
December hogs broke out on Wednesday from a 4-month running wedge and are now retesting the lower boundary.
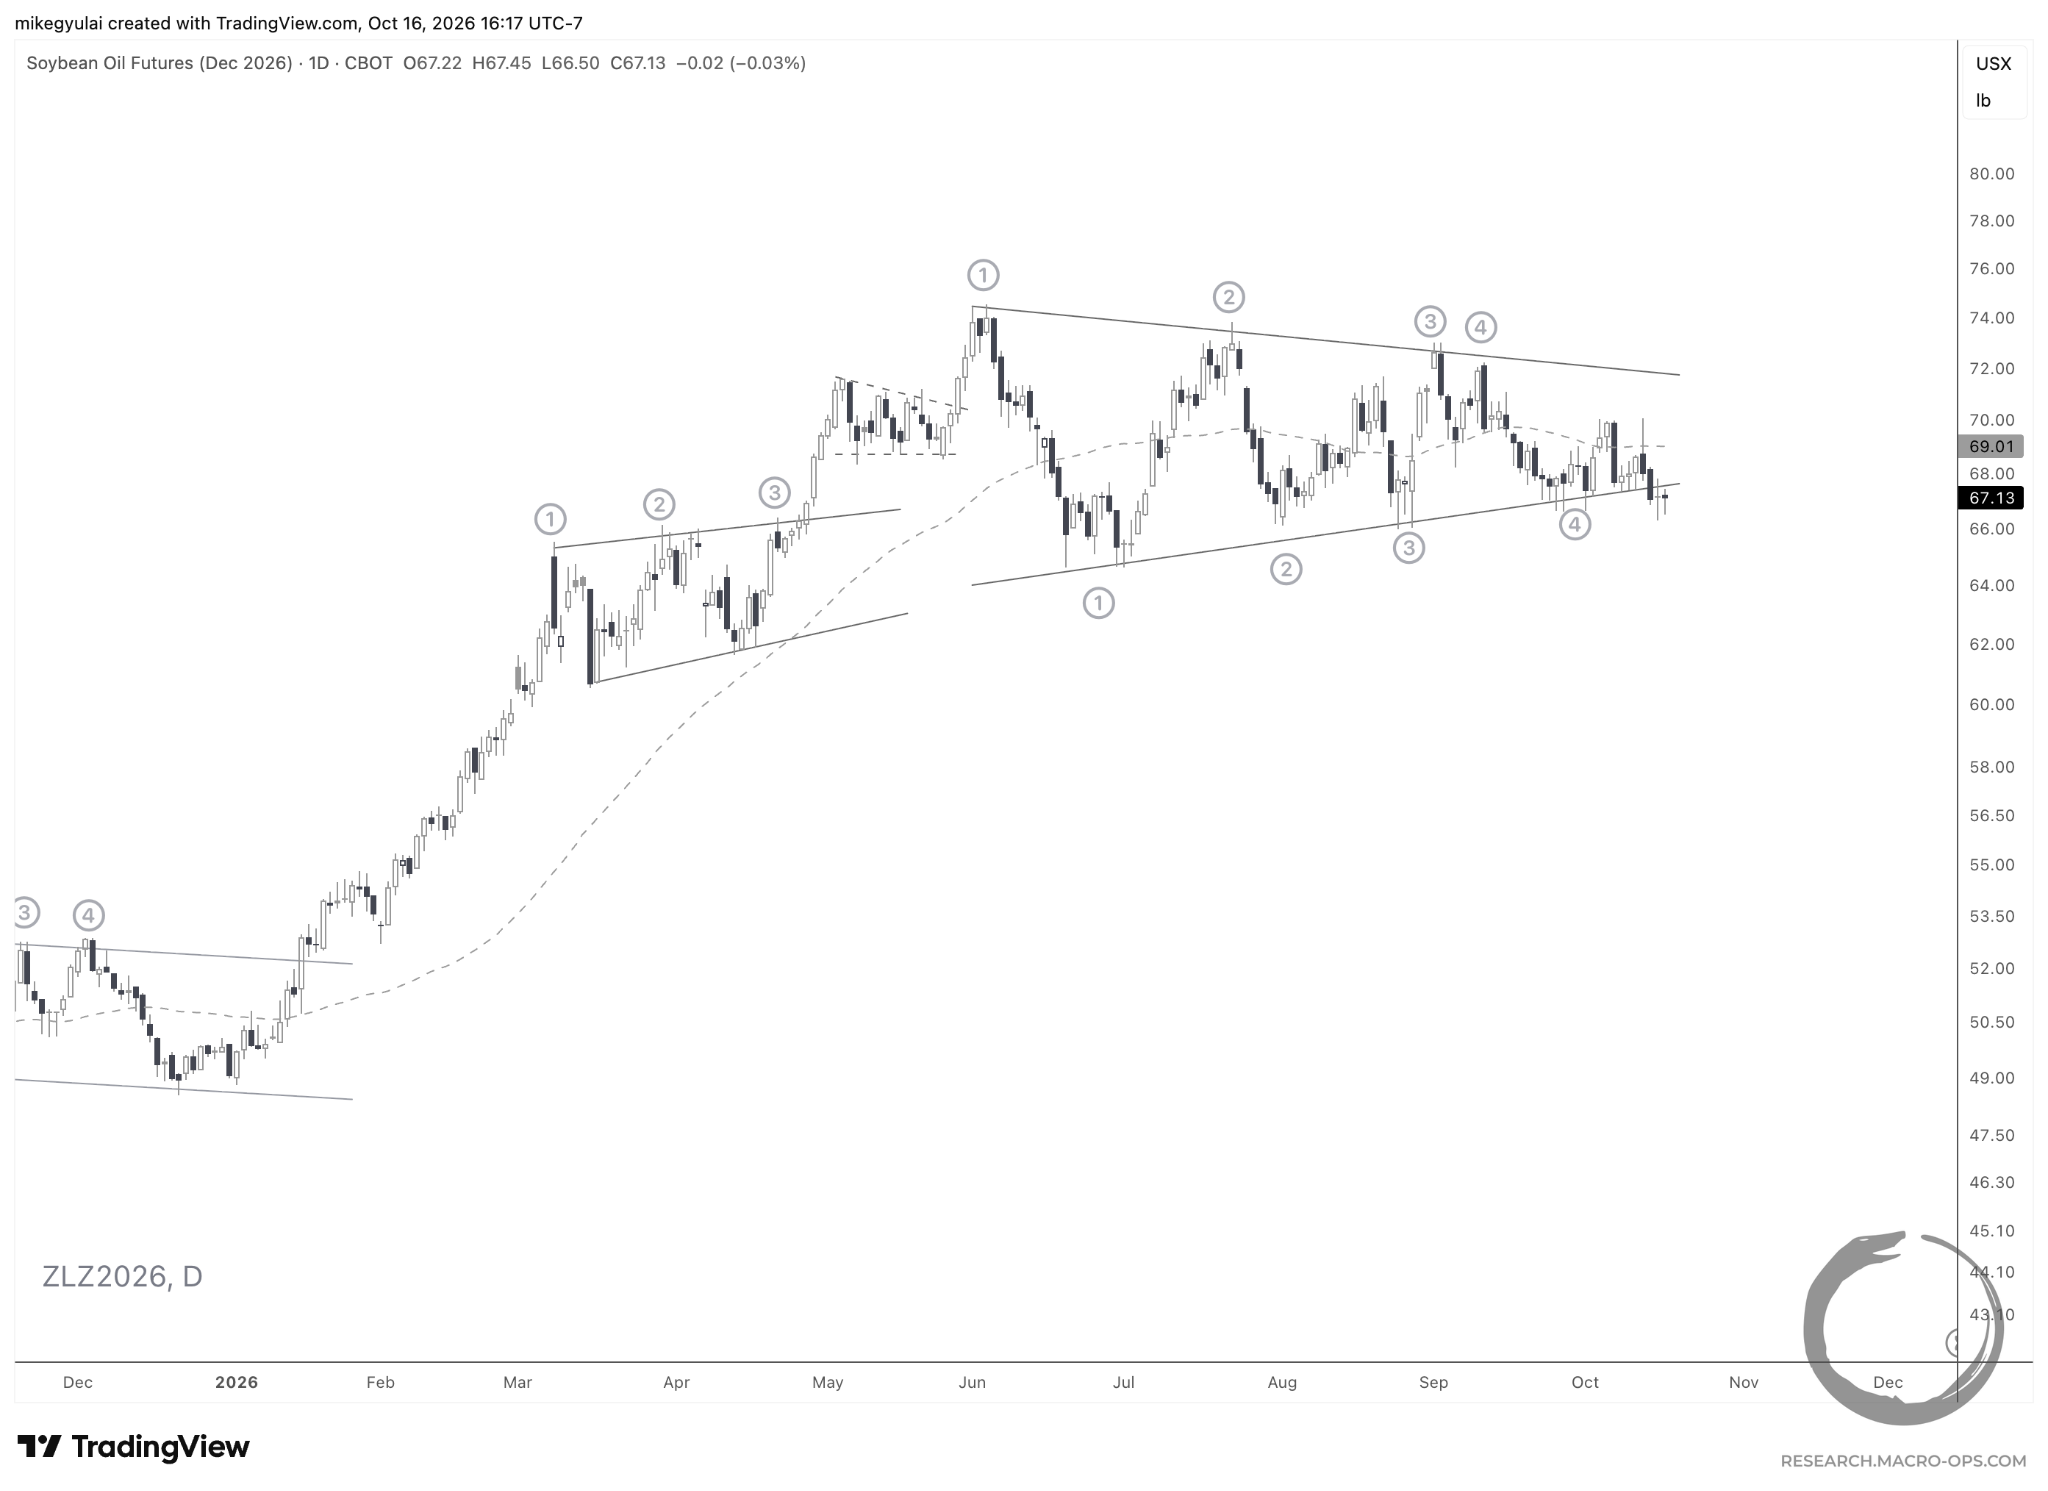
December soybean oil spent another week dancing at the lower boundary of its 4-month symmetrical triangle. No breakout yet.
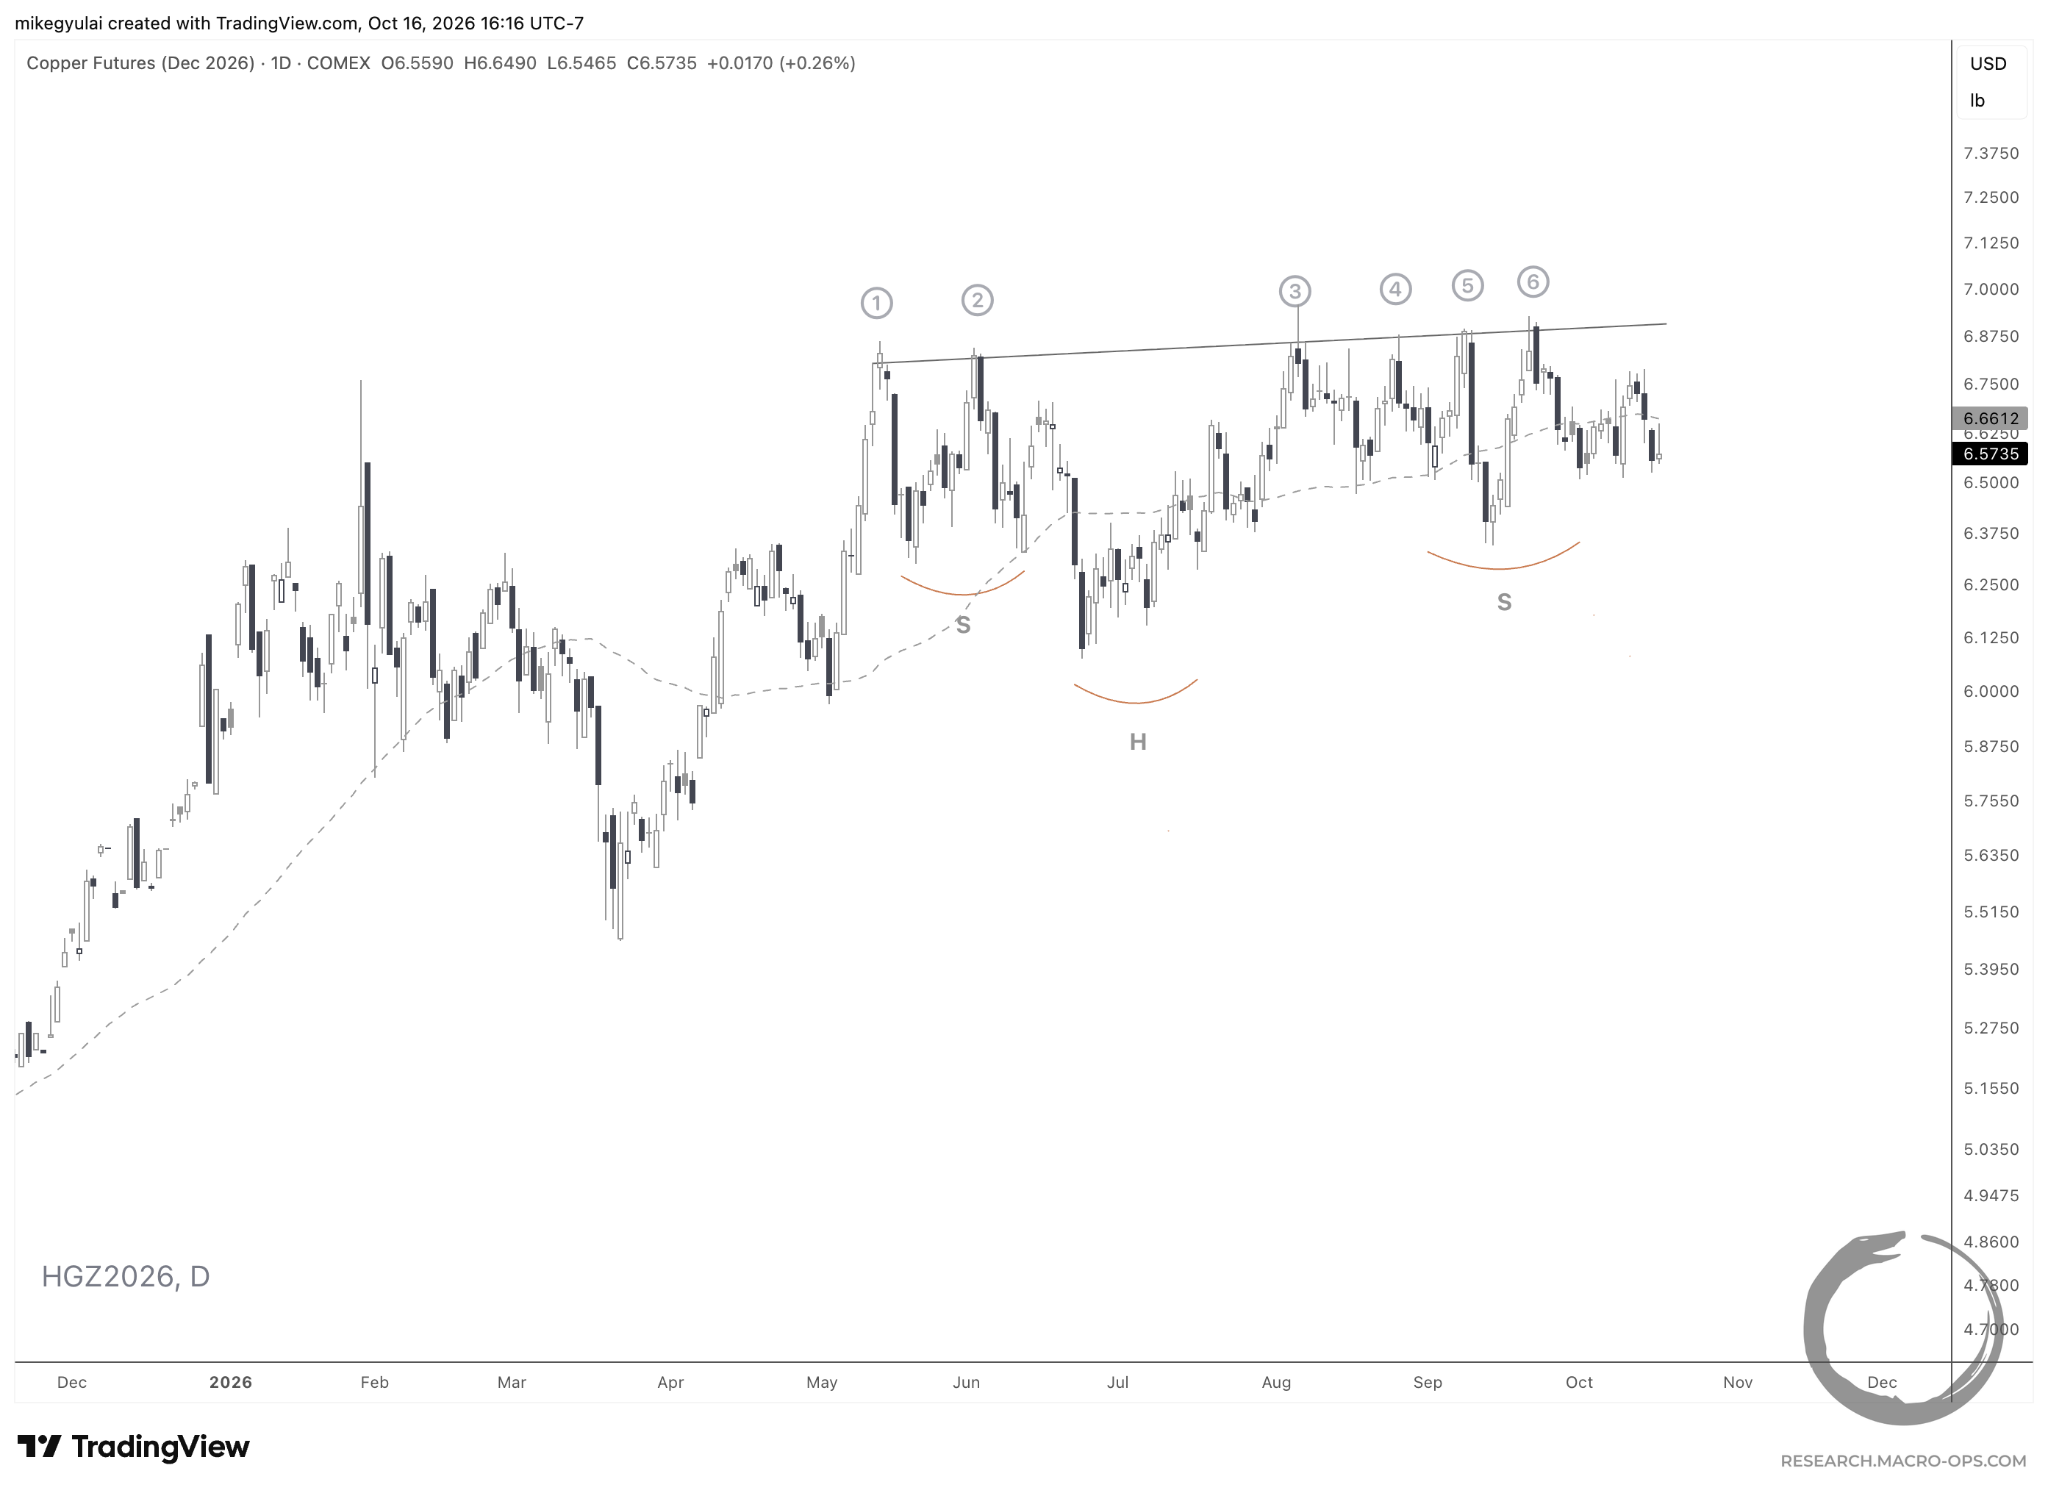
And December copper continues to consolidate within a 4.5-month head-and-shoulders continuation.
The Pauses That Refresh
The Tactical Composite Trend Model from our Lead Equity Market Strategist, Dean Christians, fired a Risk-Off signal this past week. It is just the 30th such signal since 1929. Members can read his report on what it means for forward returns in the research portal.
The latest equity screen revealed several bullish formations across integrated oil stocks. In other industries, consolidations that formed above their 200-day EMAs are now testing support at or below those averages. Below are the names that stood out this week:
Active watchlists, real-time positioning updates, and live portfolio tracking are reserved for members of The Collective, our premier service offering discussions on high-level theory and performance, differentiated research, and a global community of serious traders and investors dedicated to mastery. Learn more about The Collective here.