


Summary: The lockout rally continues as price runs towards its technical target at the upper end of the broadening top pattern in Qs, which is just over 2% higher. The market keeps narrowing with tech and energy catching nearly all of the flows. While we expect further risk-on over the next week or two, the first concerning cracks are beginning to appear, with LQD/IEF (our favorite internal) diverging from the indices. Rates have broken out from a major compression regime, capital goods new orders are running hot, and the Ag space is our primary market of interest at the moment.
MO Portfolio & Trades
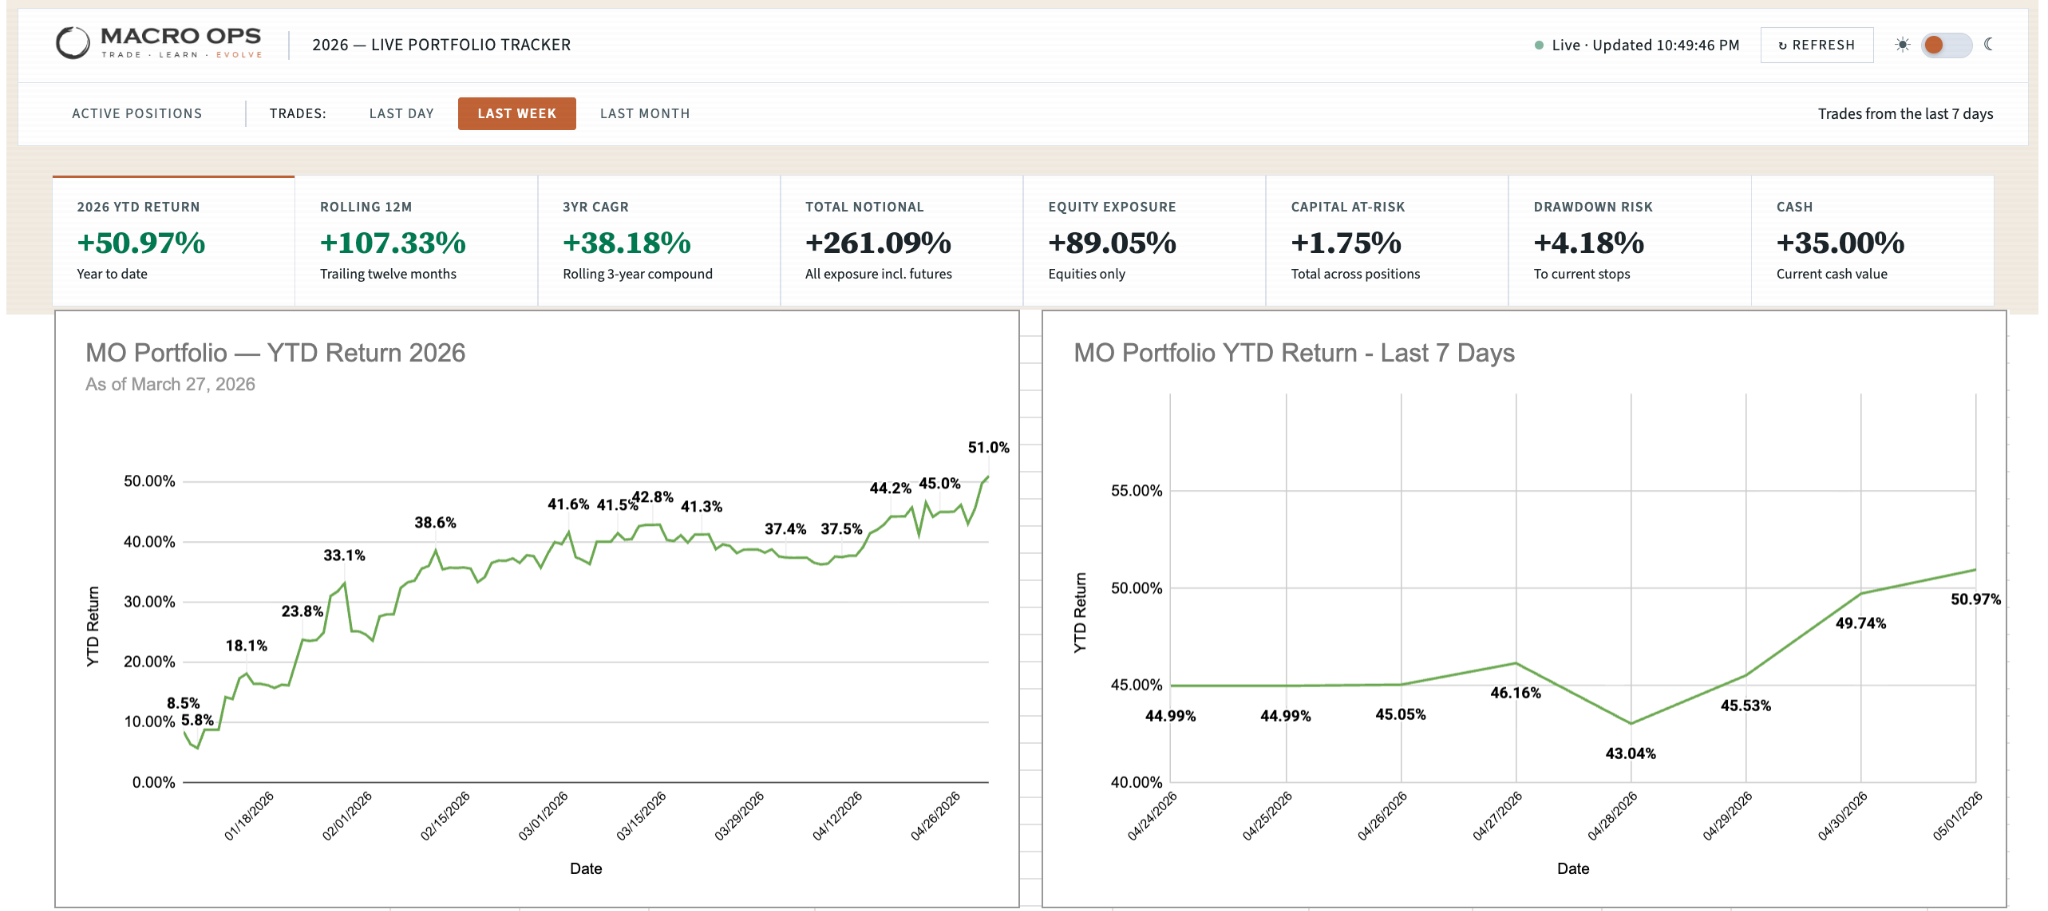
1. Portfolio rose +597bps last week, sitting at +50.9% YTD.
Our core book: long AI and semi plays, long RTY, long BTC, short SOLUSD, short DAX, long silver, long BBG Commodities ETF, long KC HR Wheat, long Dec Brent, long RBOB Dec gas, long 2y USTs, long lithium and RE miners, plus a couple idiosyncratic equity names.
2. We wrote about the budding mean reversion set up in cocoa last month, and while the tape hasn’t kicked off on a bull leg yet, price continues to compress and the Trifecta setup (positioning, technicals, macro/fundamentals) is there.
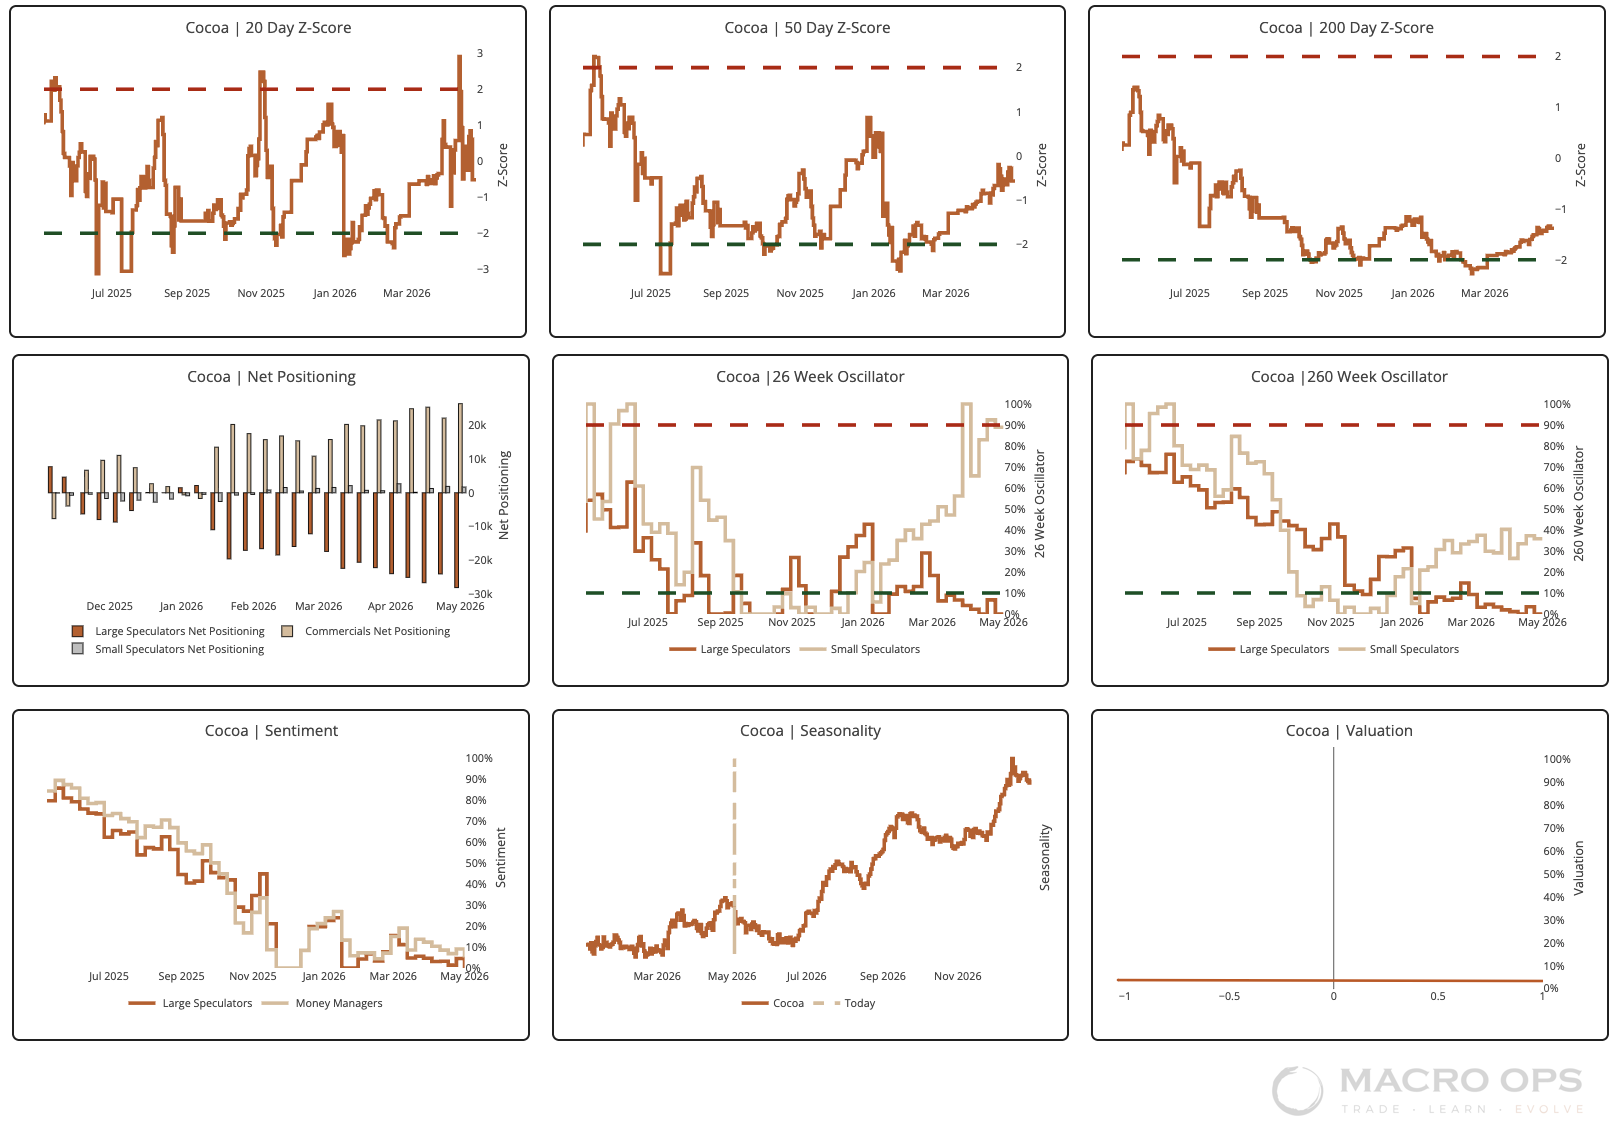
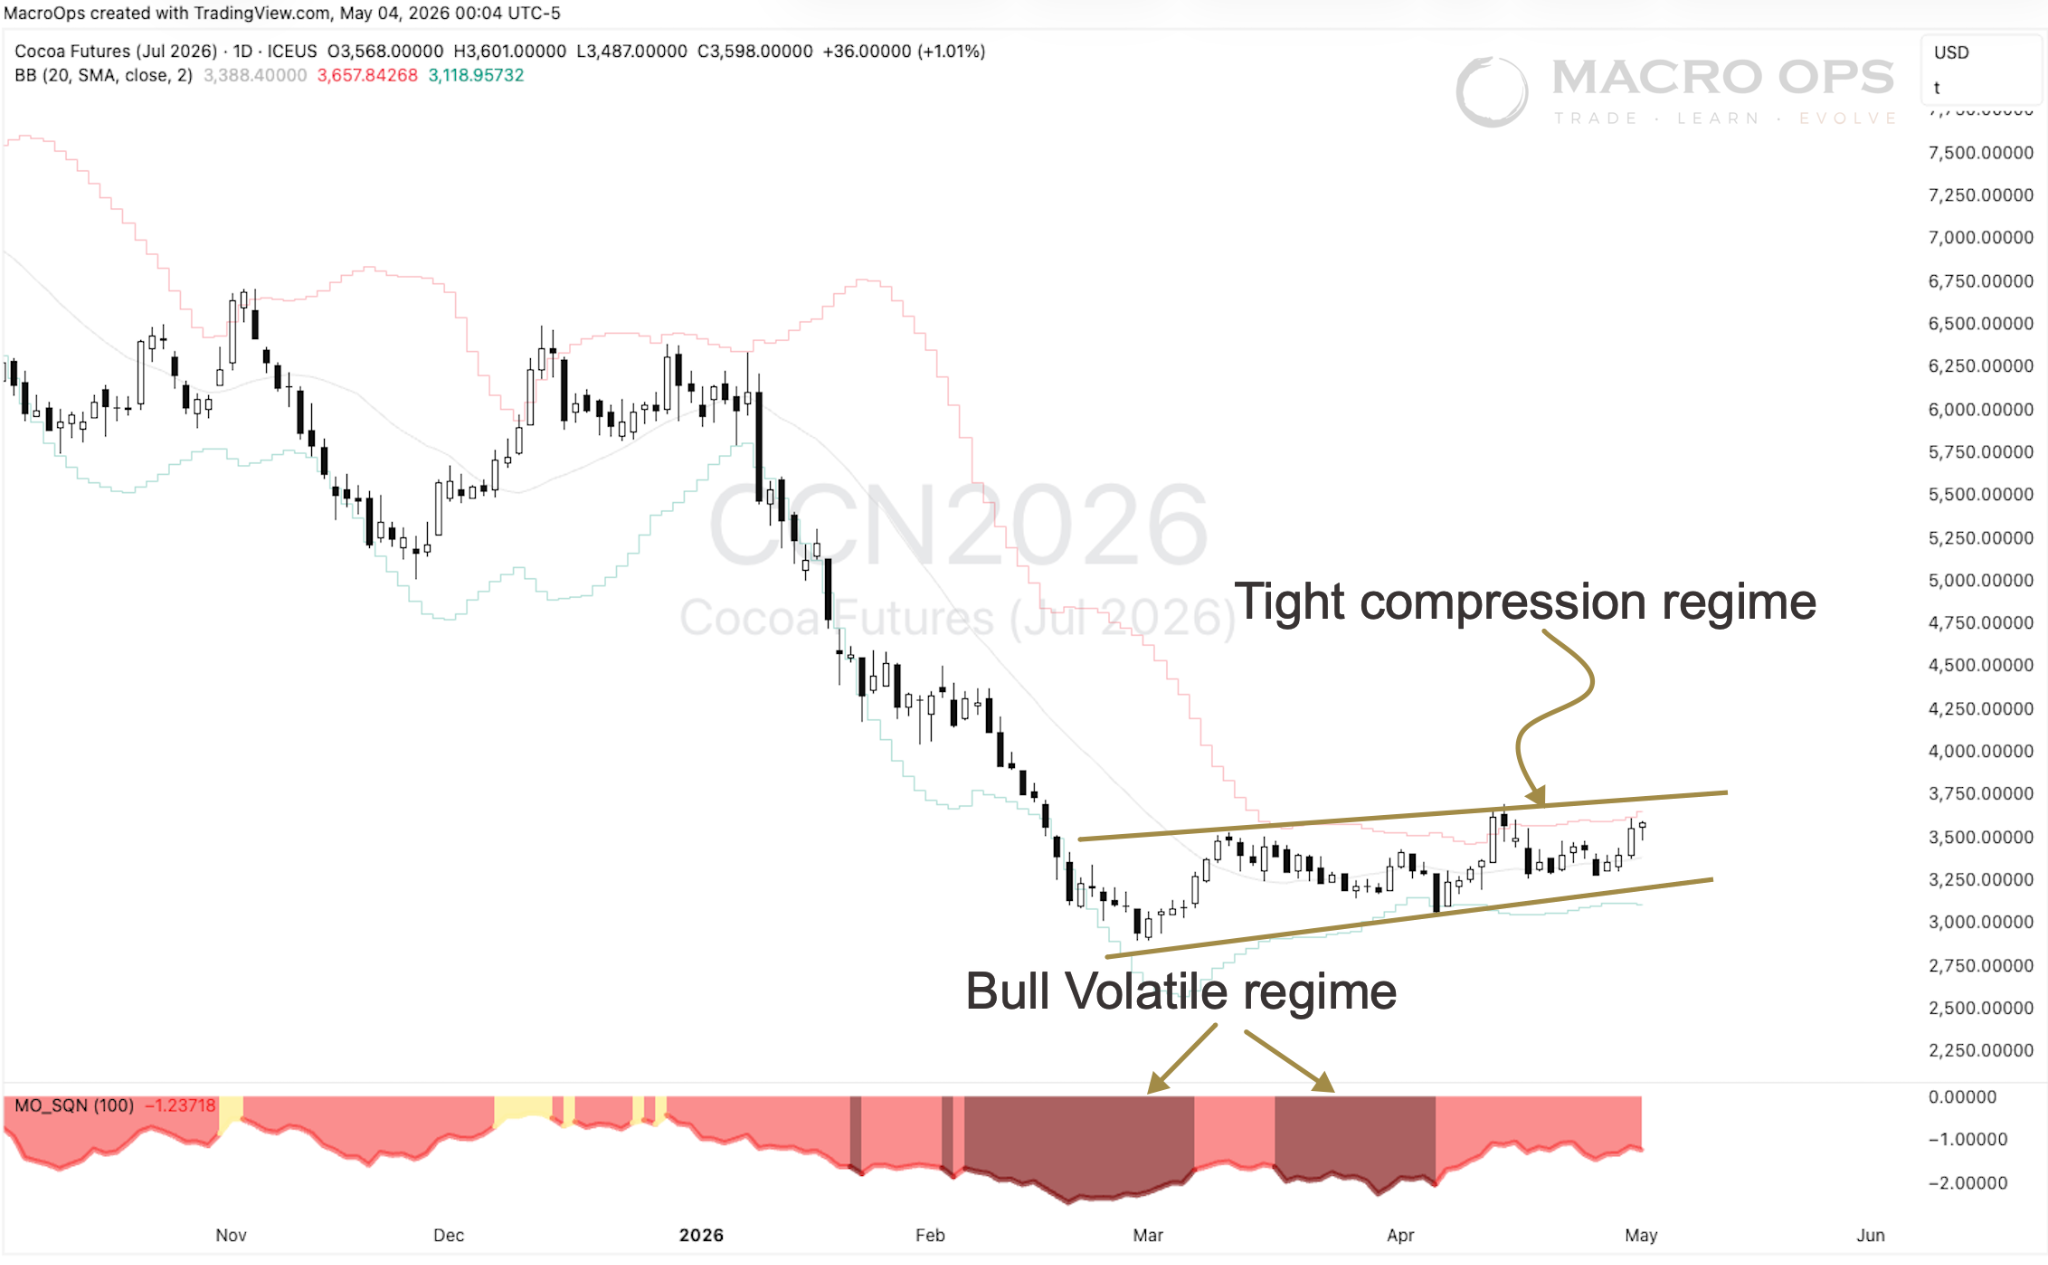
3. We have a tight compression regime following deep Bull Volatile SQN readings, which tend to mark significant lows. We’re long and have orders to add on a volatility breakout.
Trifecta Charts
4. Last week I wrote that Qs will run quickly to the top of their broadening top pattern. They’re now 2.25% away and we think they close the rest of the gap fast.
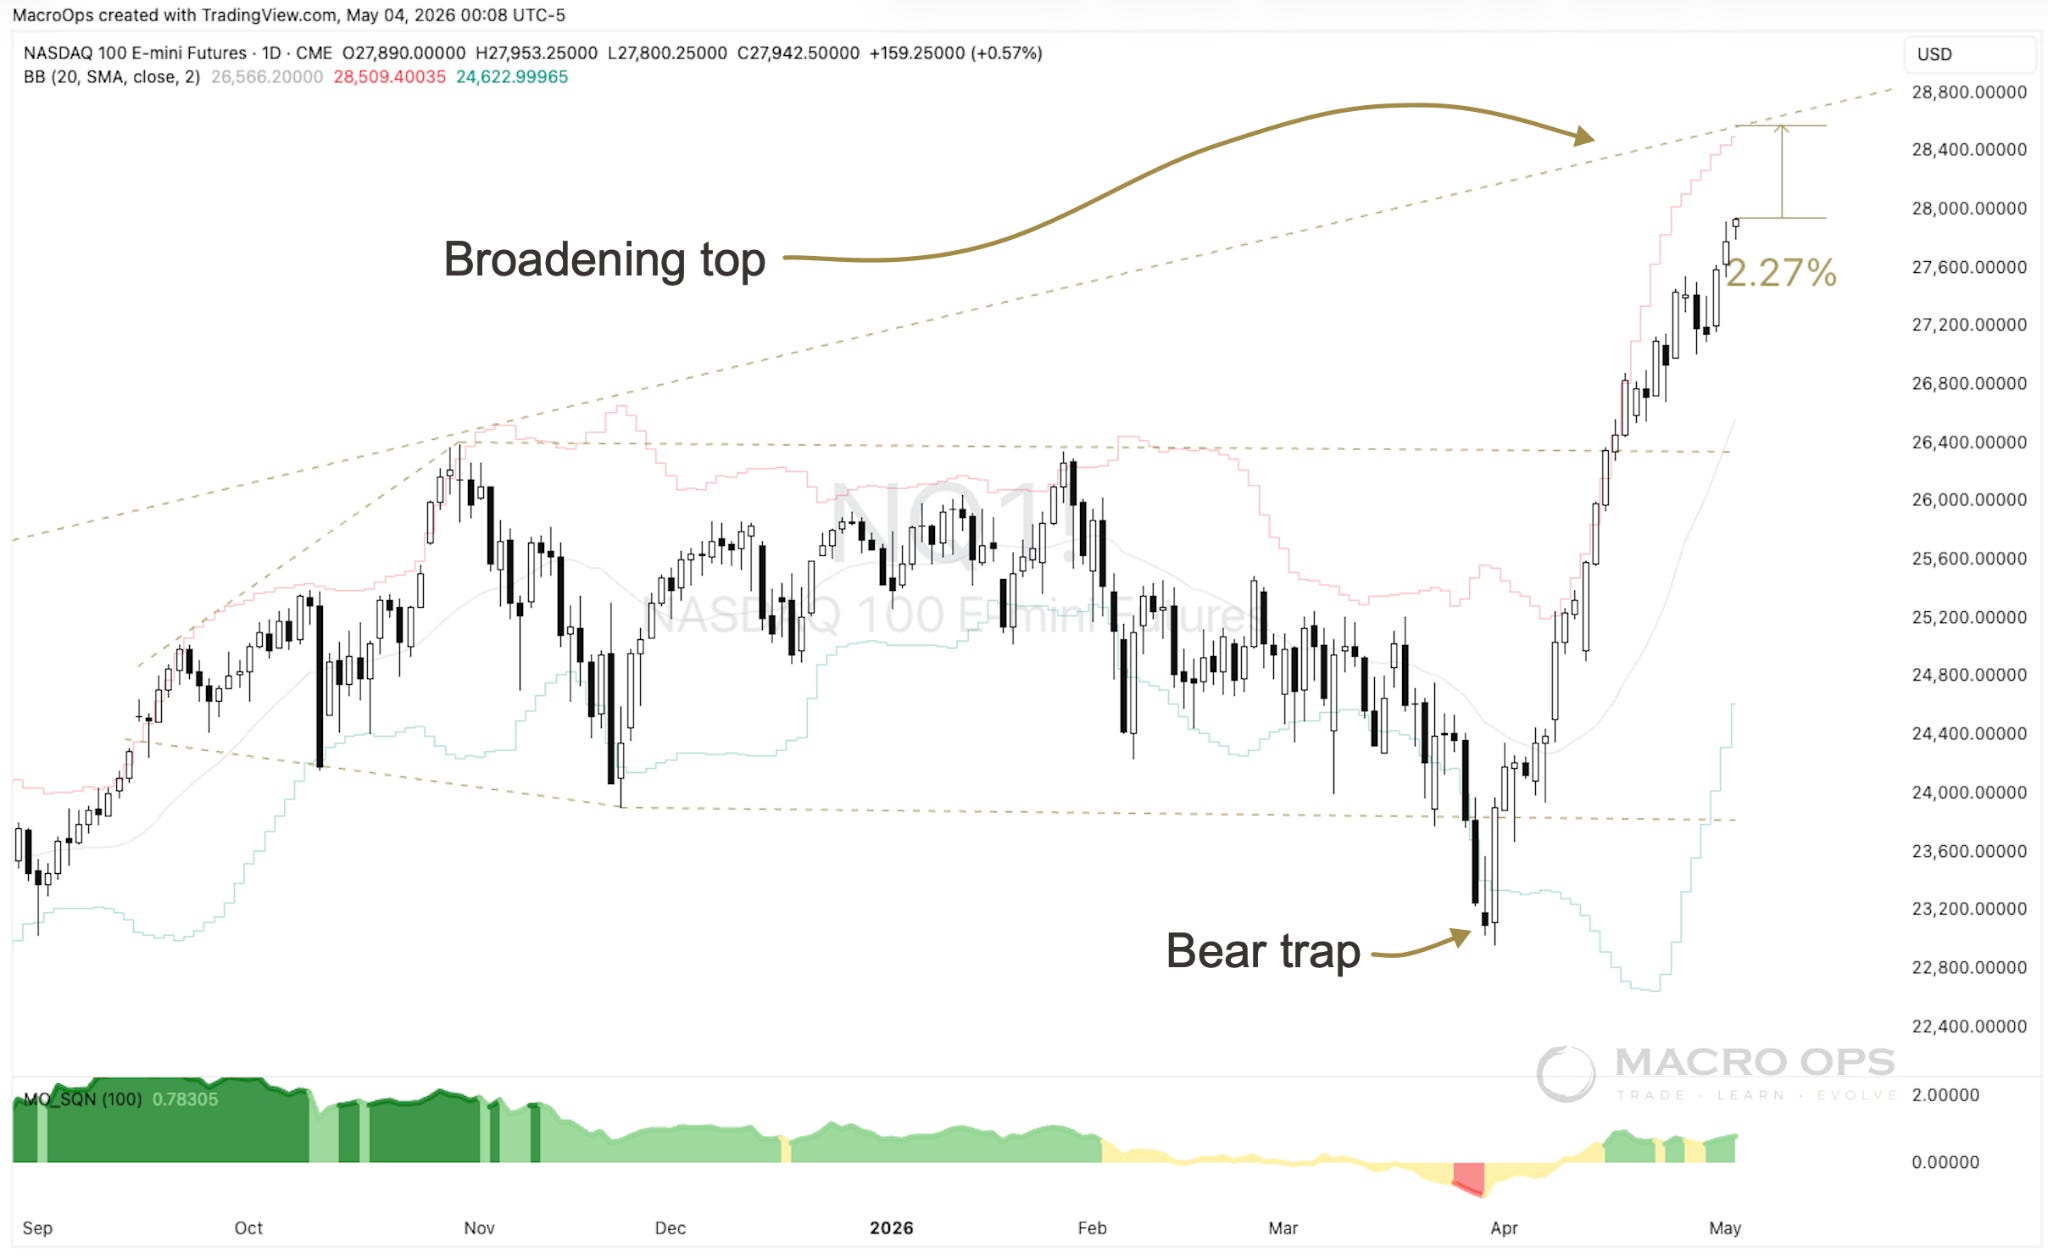
5. We’re bullish and think the tape continues to run over the next 1-2 weeks, but concentration is narrowing and we’re starting to see some concerning divergence in measures of credit, one of our favorite internals (tan line).
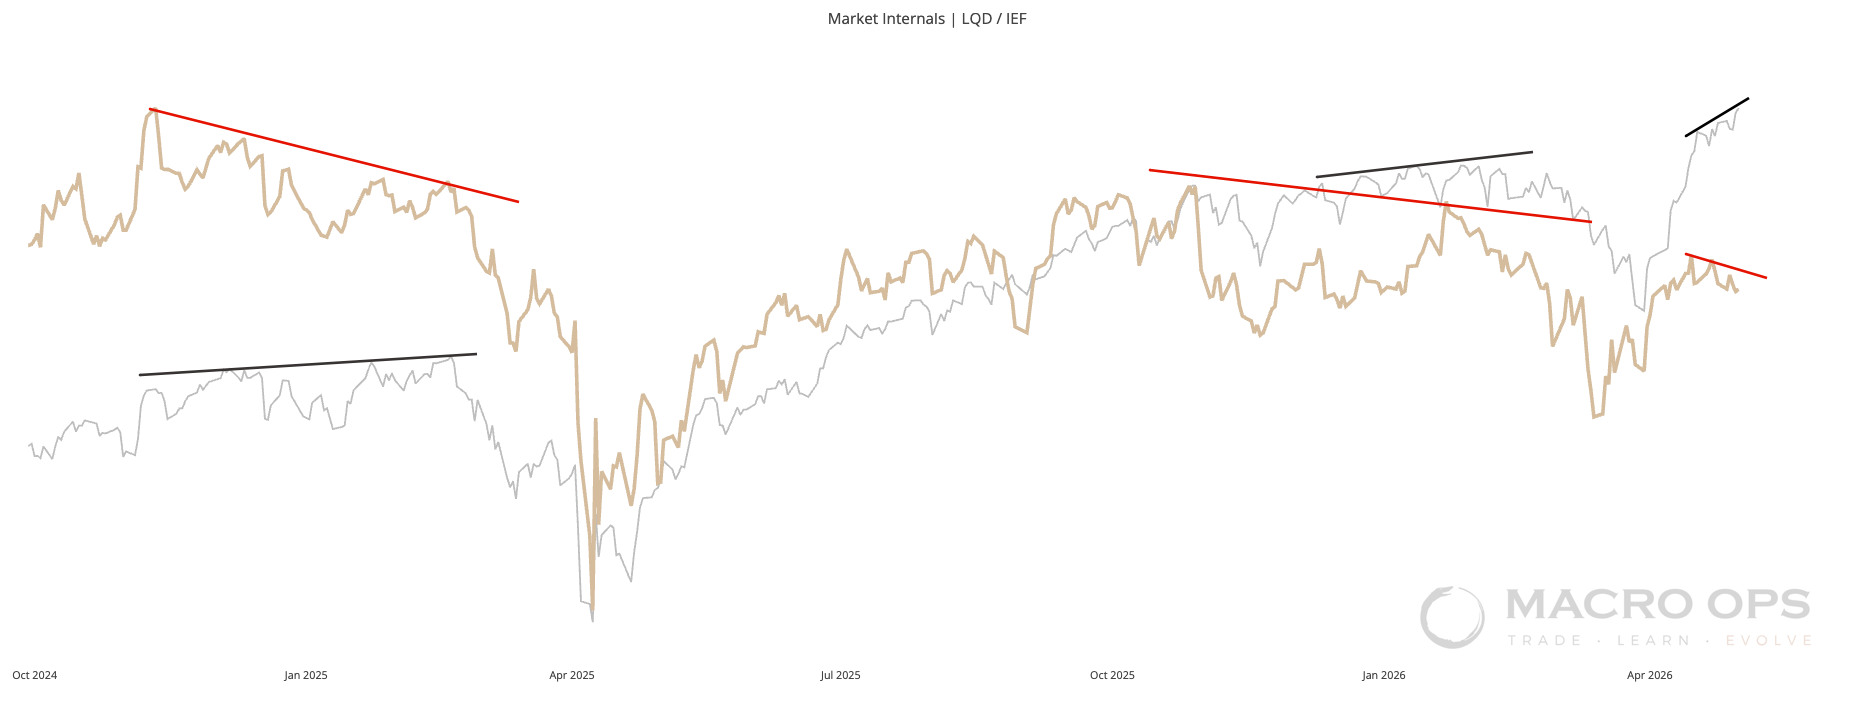
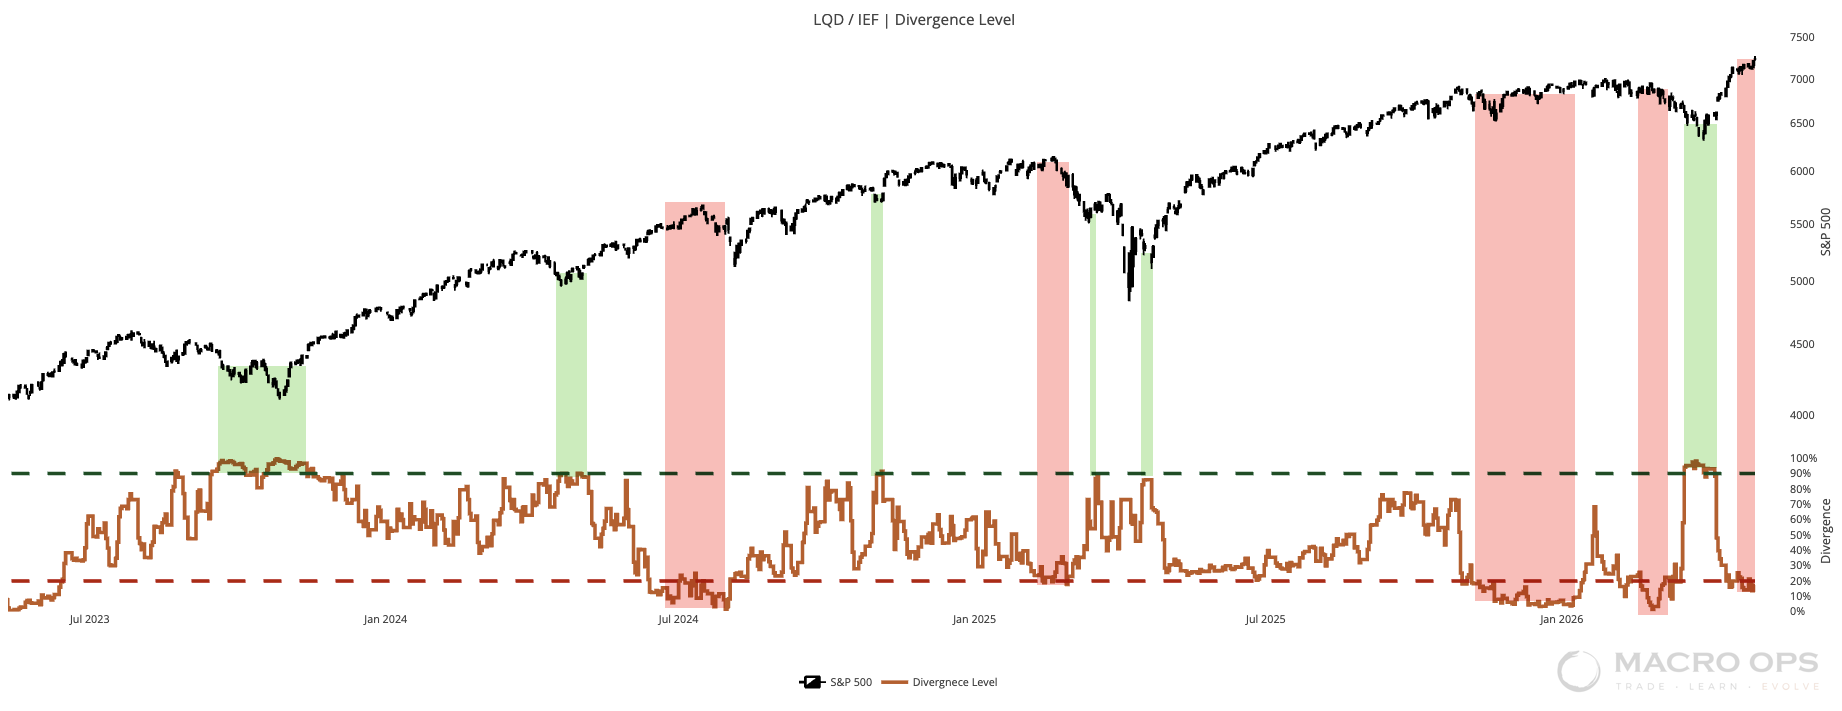
6. Here’s another way of looking at the same chart, but on a divergence oscillator basis. Credit is not confirming the recent bull trend in the stocks. This doesn’t mean anything over the very short-term. But if it continues, it will significantly raise the odds that NQ is setting up for a larger corrective period..
Macro
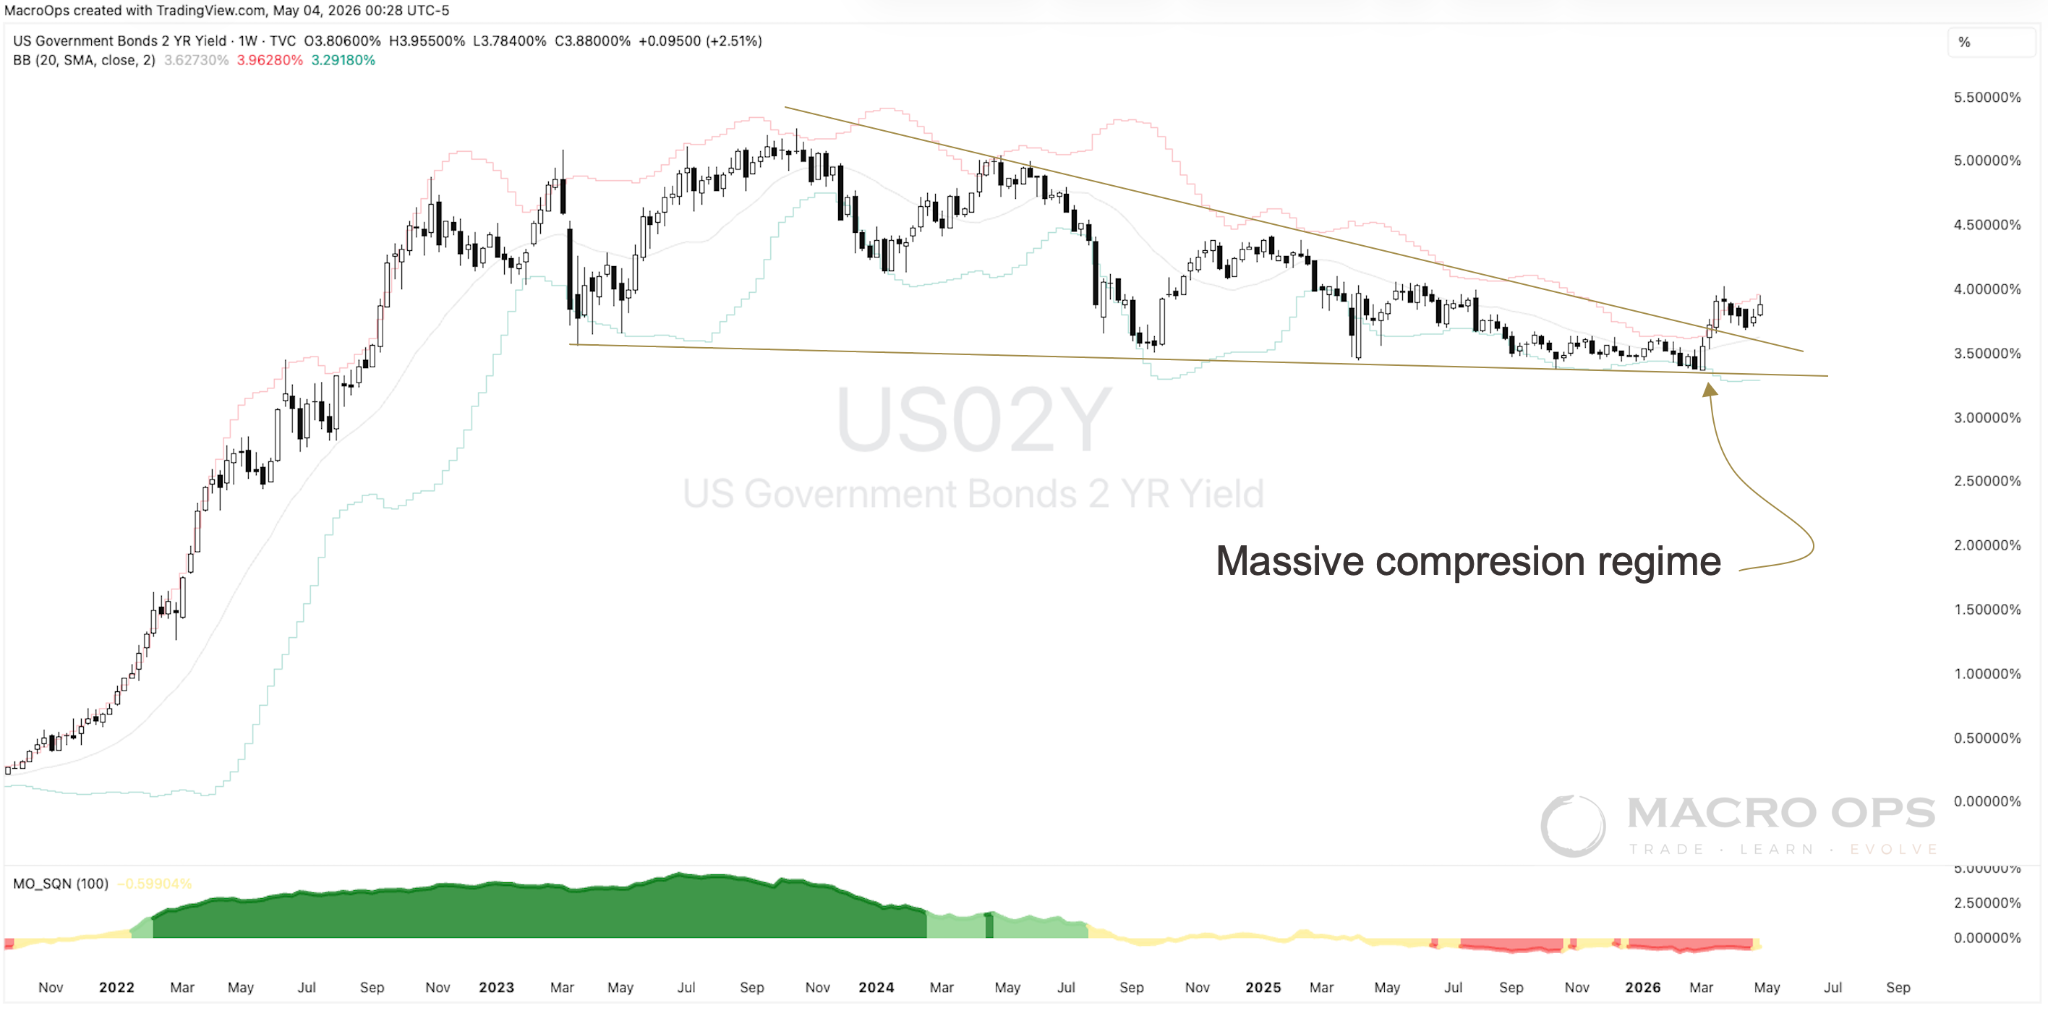
7. What will be the thing that turns this market cycle over? The same thing as always: rising rates and tightening liquidity.
Here’s a weekly chart of UST 2yr yields. It’s broken out from a MAJOR compression regime. Compression regimes precede expansionary regimes (BIG trends). A big trend is coming and that trend looks more and more like it’ll be up.
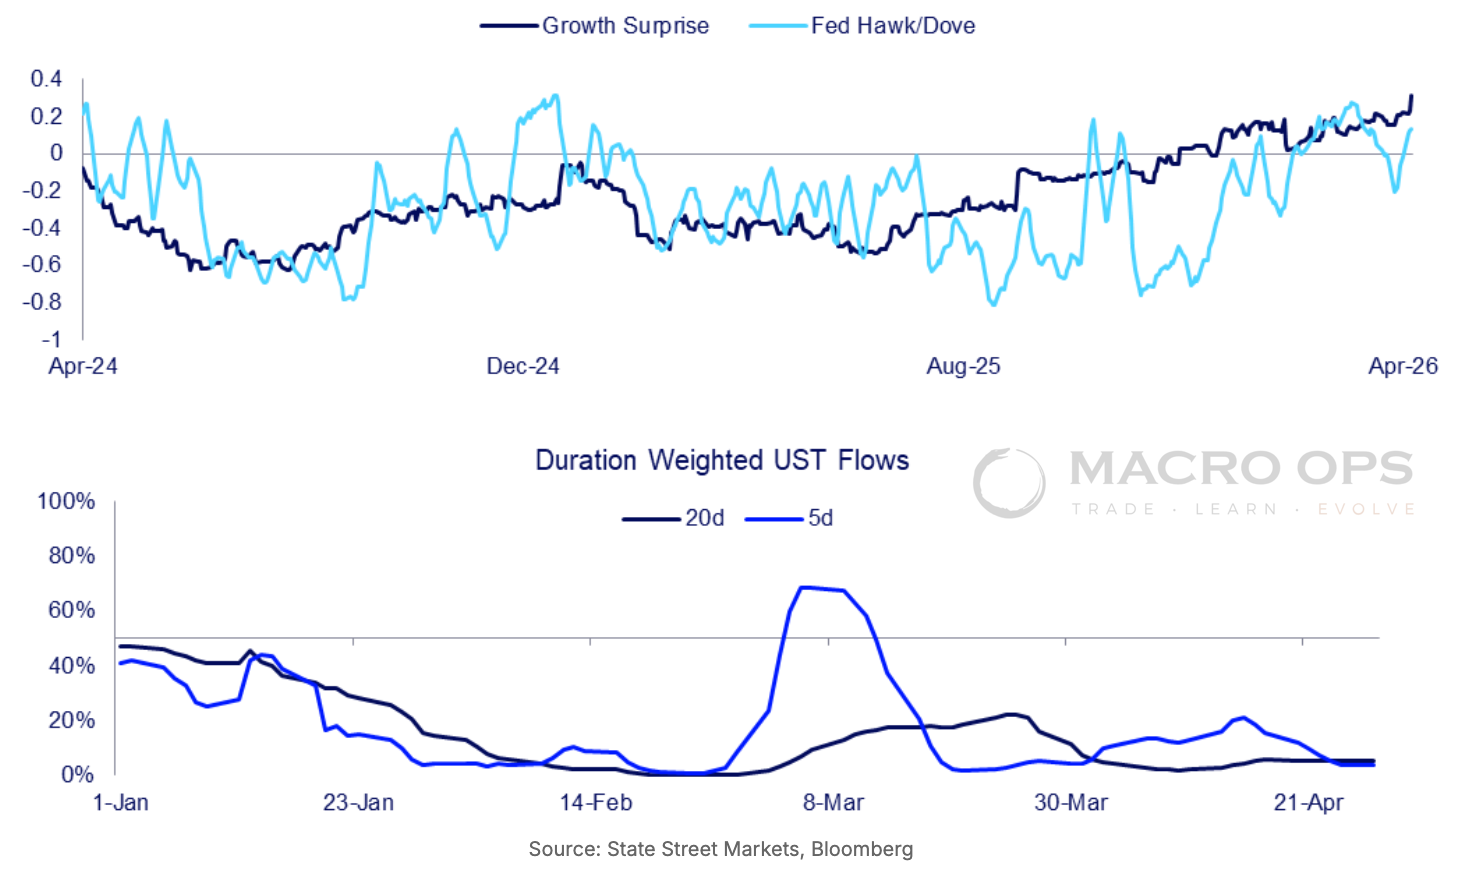
8. From StateStreet: “Hard to find a reason to be dovish… Although uncertainty is high, justifications for Fed dovishness are fading. Even ahead of the FOMC meeting, the media began to interpret Fed speak as net hawkish. And while US GDP came in weaker than expected, there are few signs of outright weakness in the economy, especially as services consumption is growing at a pace still above pre-Covid averages… Inflation pressures, the potential for rising term premium and uncertainty over economic impacts have added two-way risks to the Fed’s next move, whenever that may come.”
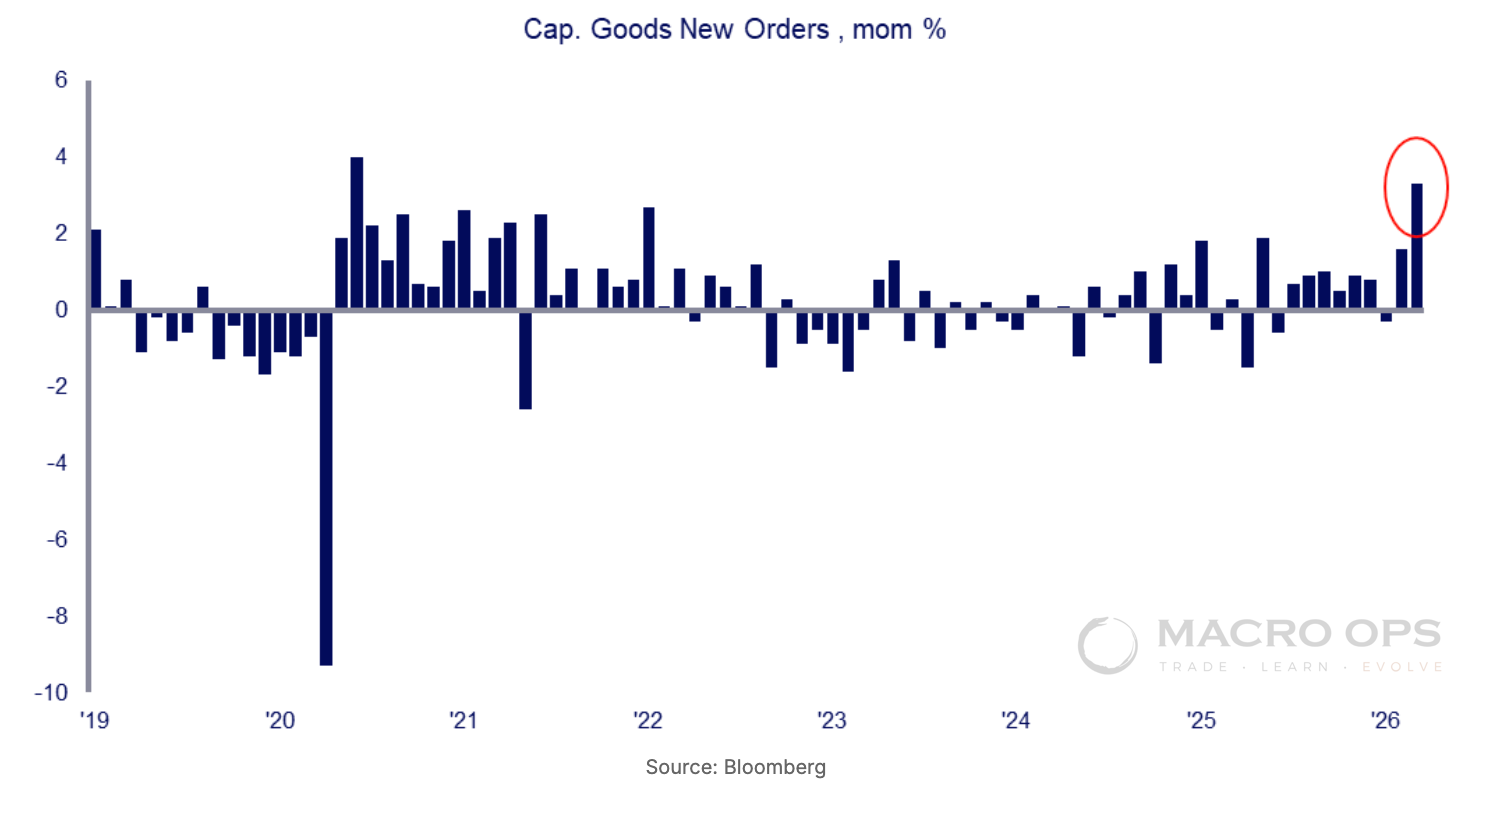
9. U.S. Capital goods orders (nondefense ex-aircraft) just posted its largest MoM increase since 2020, signaling a significant pickup in business investment activity (chart via StateStreet).
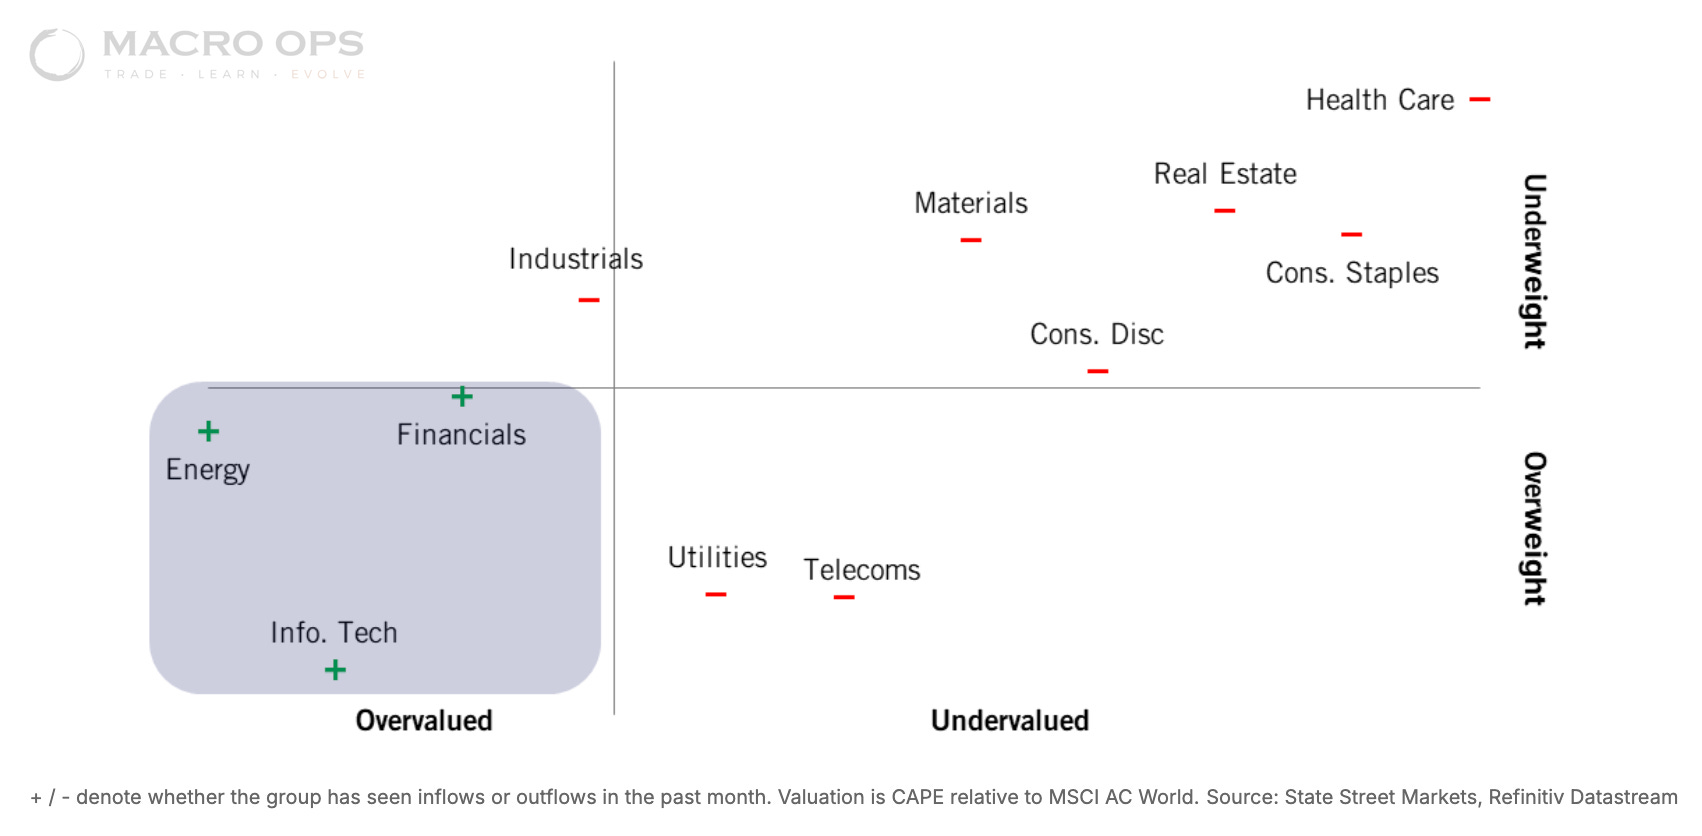
10. Concentration risks are mounting… From StateStreet “As recently as a few quarters ago, equity investors were lamenting concentration and its associated risks. This concentration has returned in force, yet market participants are not fretting to the same degree.
“There are only 3 sectors globally where institutional investors are net buyers – Energy, IT and Financials. All three sectors are crowded and expensive but seeing robust earnings.
“The rest of the market is seeing net outflow pressure from institutions.”
Trade Setups / Topical Charts
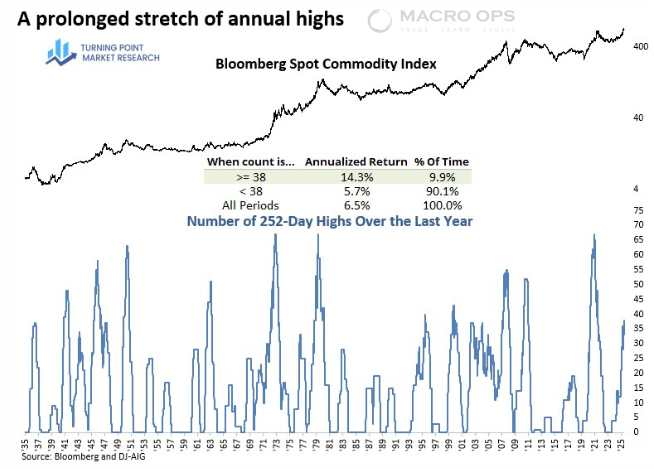
11. Dean Christian’s shared shared some great research last week (link here), showing the increasingly bullish development in both the broad commodities complex as well as Ags, specifically.
He points out that “The Bloomberg Spot Commodity Index surged to a new high this week, marking the 38th instance over the past year in which it registered a new 252-day high.
“That has happened only 11 other times in history.
“As the chart below illustrates, when the rolling count reaches 38, the index has historically generated an annualized return of 14.3%, more than double its long-term average return.”
Last week we added our fourth leg to our BCI long.
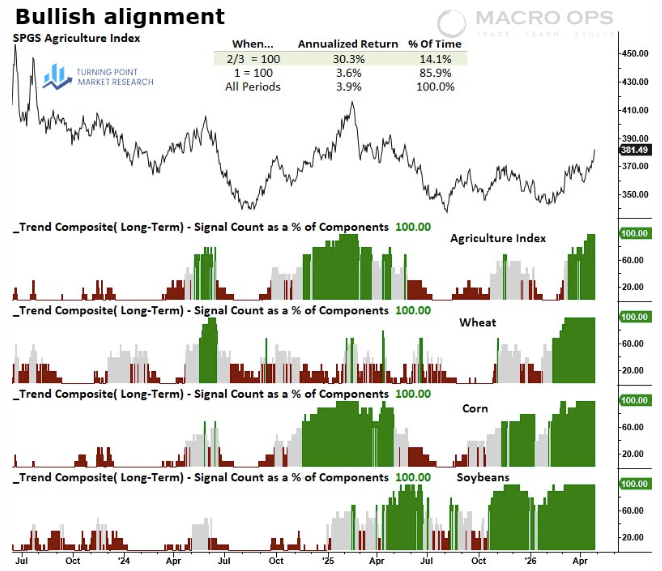
12. He specifically highlights Ags as looking bullish, with wheat, corn, and soybeans all simultaneously reaching a 100% trend composite reading for the first time since early 2022. Dean points out that “when at least two of the three grain trend composites (wheat, corn, soybeans) register 100%, the S&P GSCI Spot Agriculture Index has historically generated a 30.3% annualized return. This meaningfully outperforms environments where only a single commodity reaches 100% and across all observations since 1969.”
Last week we pitched the Ag ETF DBA. We also like MOO.
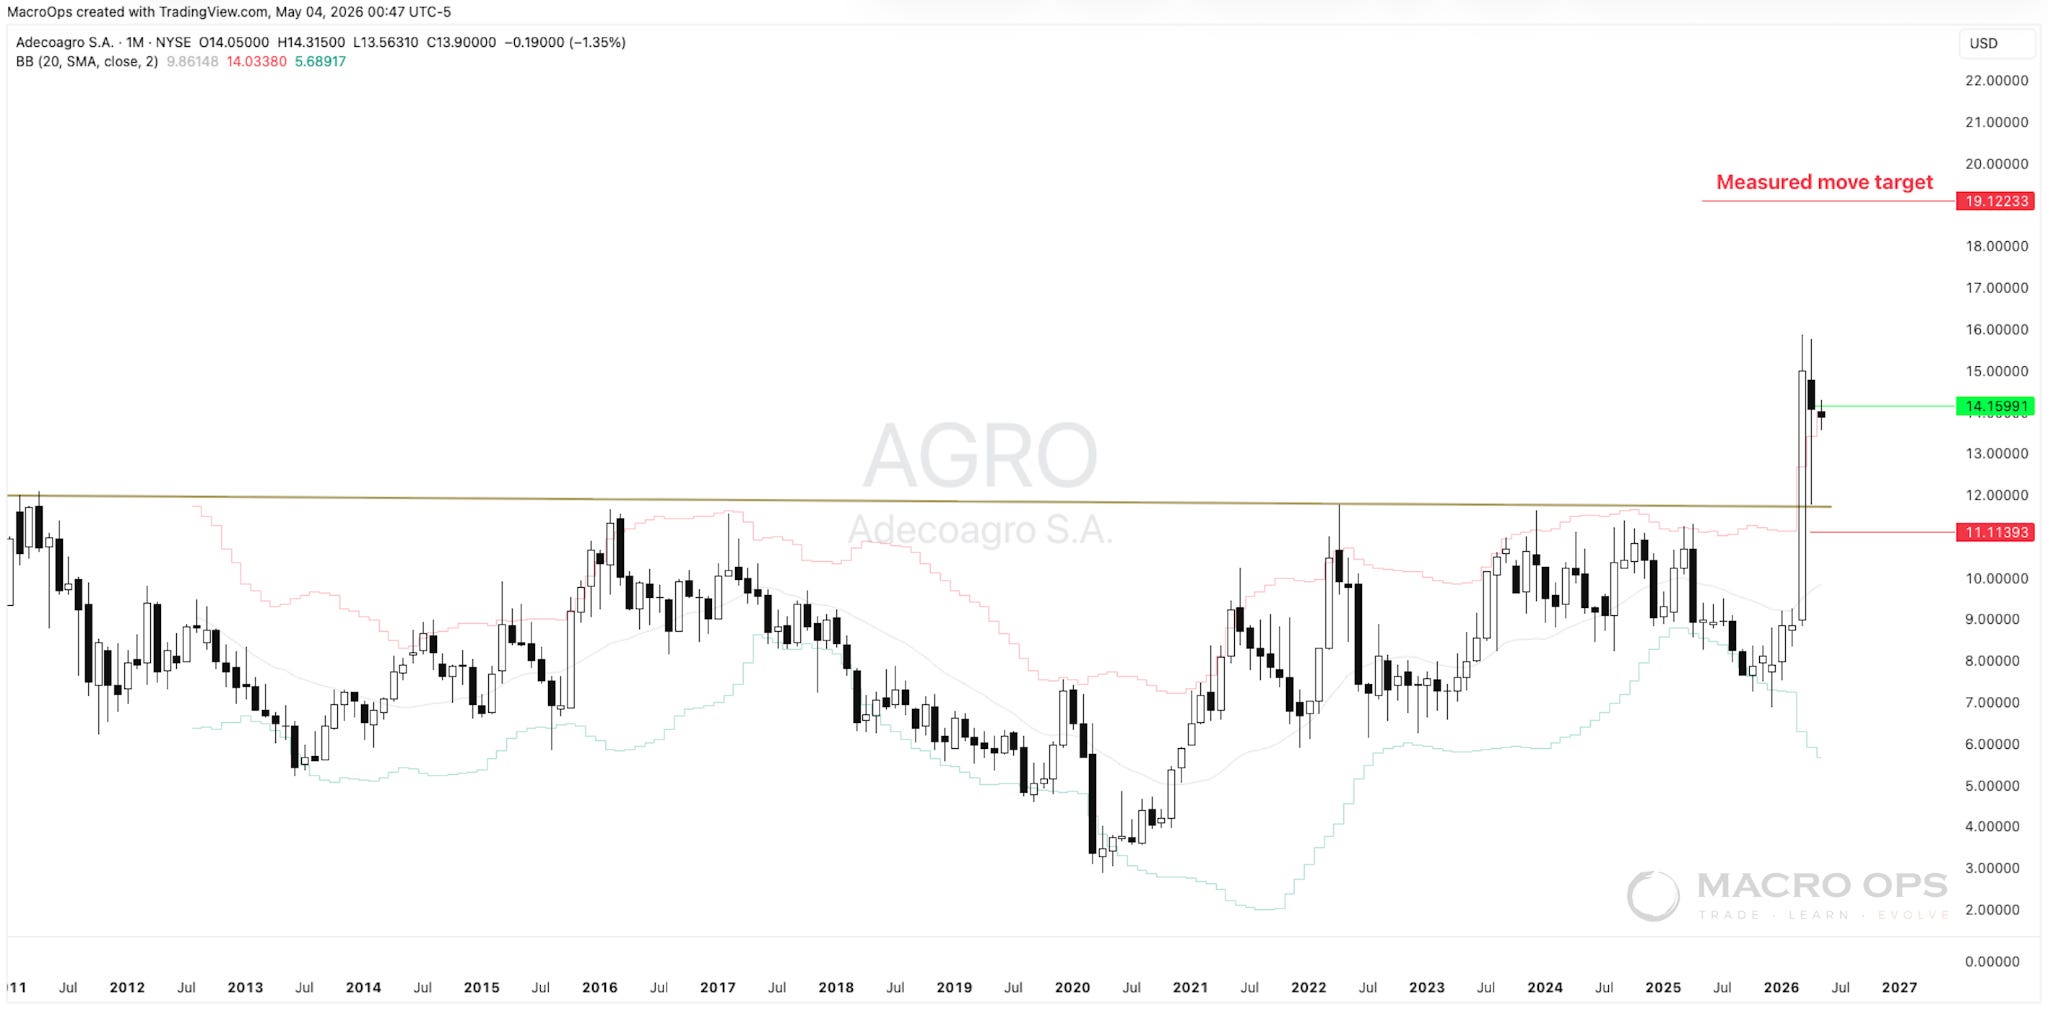
13. And we still like the Adeocagro (AGRO) to play this theme. For those of you who remember, we first pitched this name back in early March (link here). It’s since broken out of its massive consolidation pattern and is already trading over +40% higher. We think this name is a 3-5x bagger over the next few years.
Thanks for reading.
Your Macro Operator,
Alex