


It’s been one year since we declared the commodity bull had begun, seven months since I shared the structure of my commodities swing trading playbook, and two months since our special report on the developing Super El Niño, the most significant climate event in 150 years.
I’m Mike Gyulai, Lead Technical Analyst at Macro Ops. Alex reads the macro. Brandon reads the balance sheet. Dean reads the models. Tony reads the vol surface. I read the charts.
And when my read of price action lines up with the team’s macro view, the trades get big.
2026 delivered the explosive trends we expected, agricultural commodities above all. Every Saturday in This Infinite Game I’ve covered those trends through the lens of classical charting.
Today, I’m sharing charts of this year’s best moves: the ones now permanently in my playbook. I keep a chartbook like this for one reason. When markets turn sluggish, noisy, and “make no sense,” it reminds me what classical chart patterns are at their best: moments of order and clarity surfacing from otherwise random oscillations in price.
Across just this year, heating oil hit its 2x measured move target three days after the 1x. Rough rice took two months, backing and filling to key moving averages before resuming its trend. Cotton and crude reversed their first breakouts and recompleted weeks later.
I encourage you to read each chart as a trade, not just a picture. Ask where you would have entered, where you would have placed your risk point, and what you would have done on the first hard retest of the breakout boundary, or at the 1x measured move target.
Then meet me after the last chart. That’s where the real work of tactical swing trading begins.
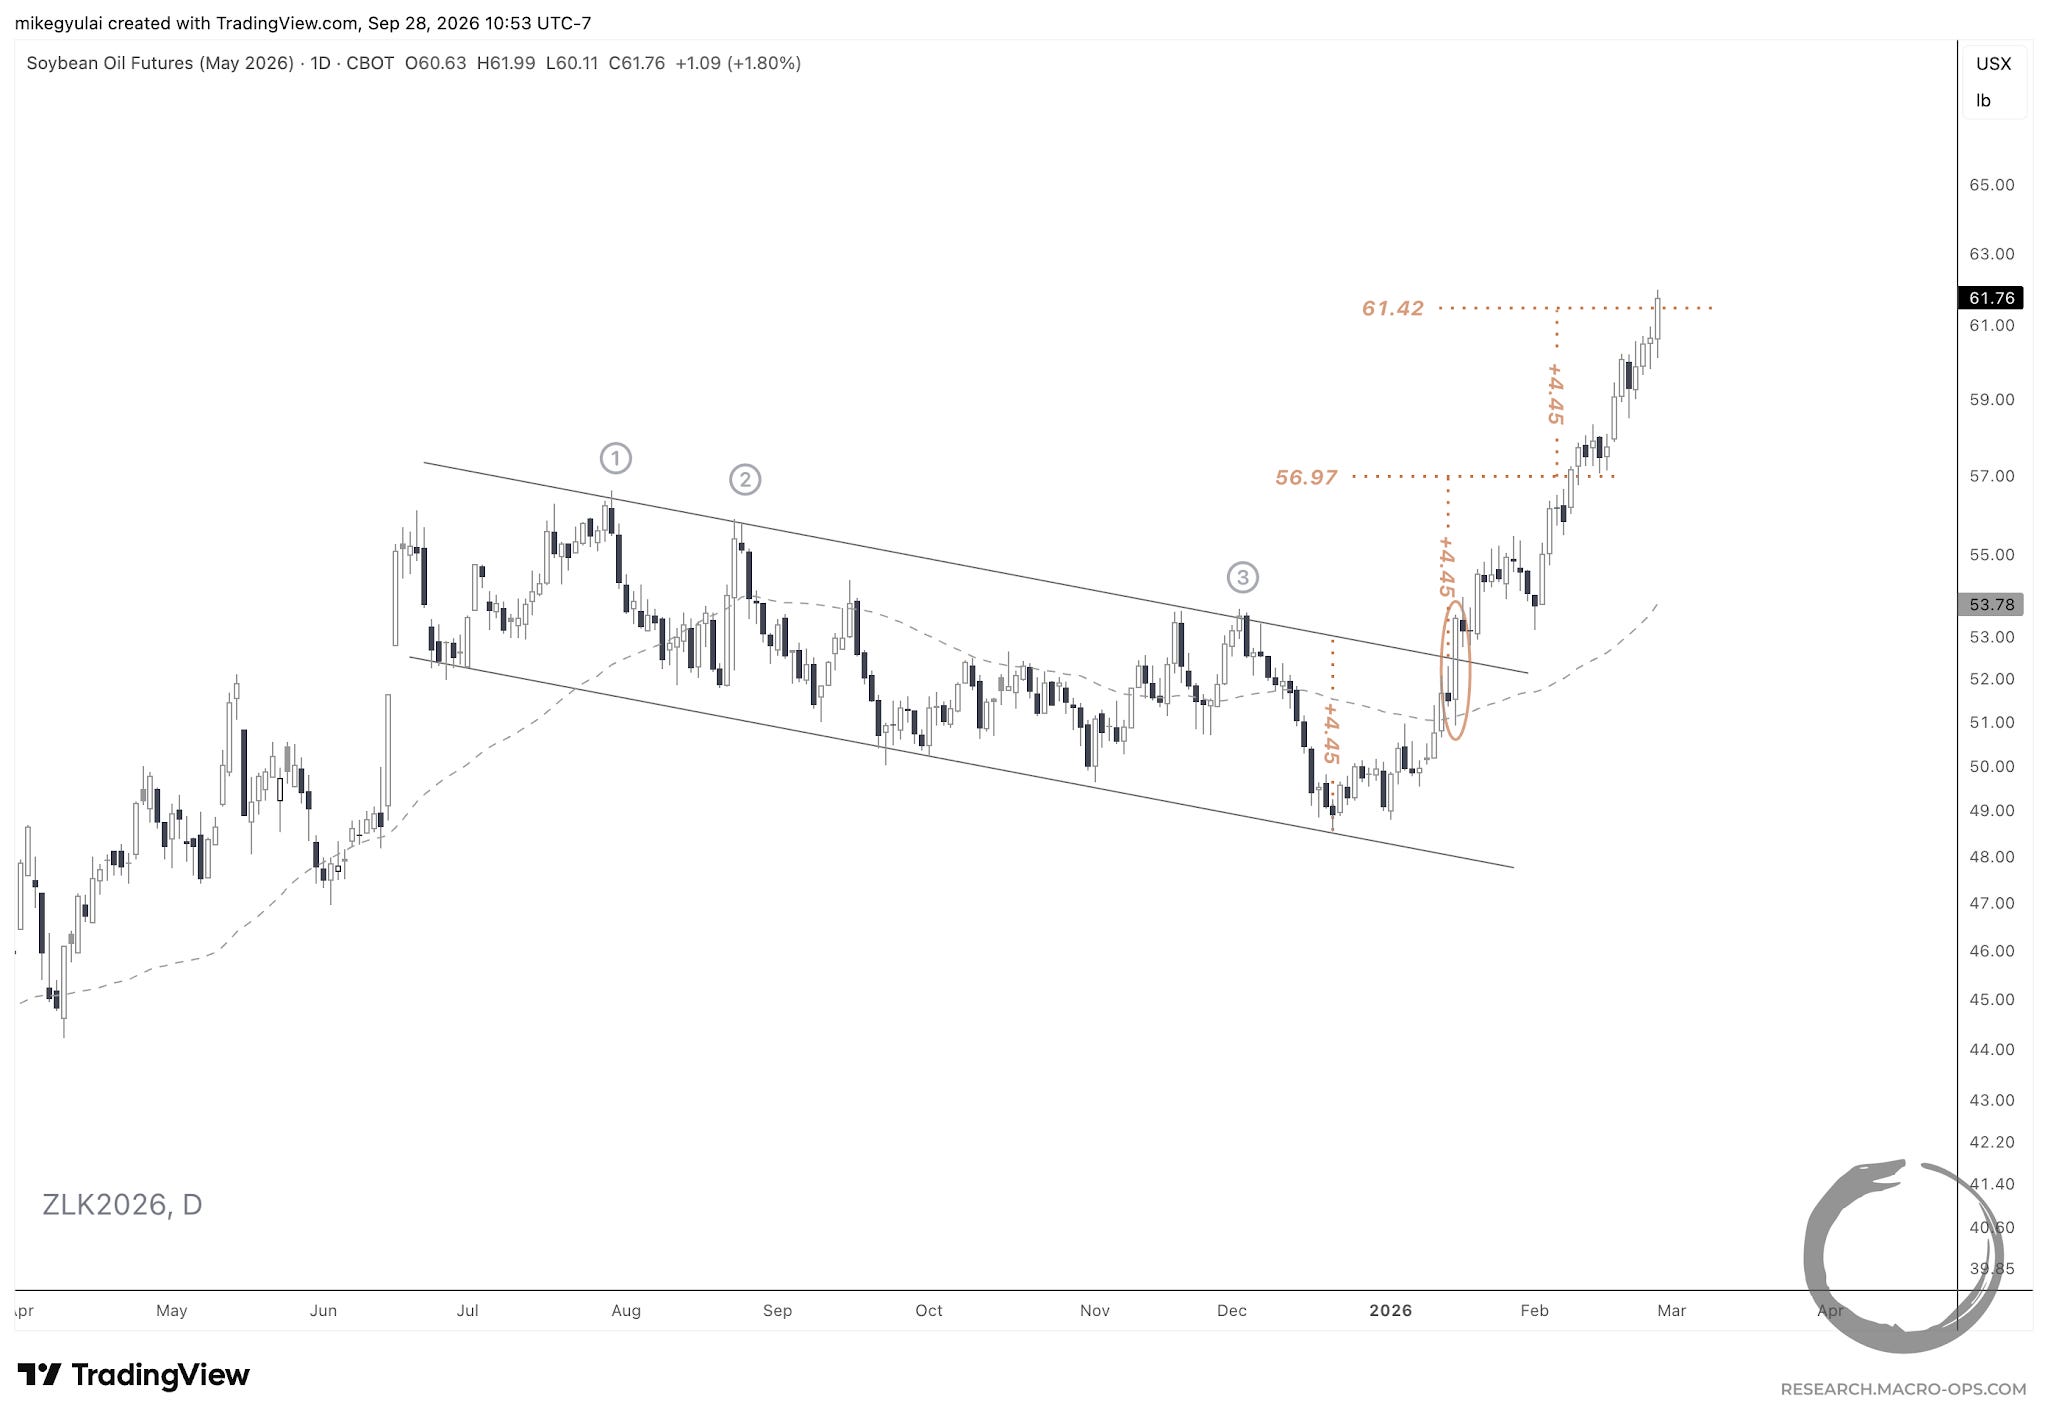
May soybean oil broke out of a 5.5-month descending channel on January 15, 2026, reaching its 1x measured move target of 56.97 three and a half weeks later on February 9, 2026, and its 2x target of 61.42 on February 26, 2026.
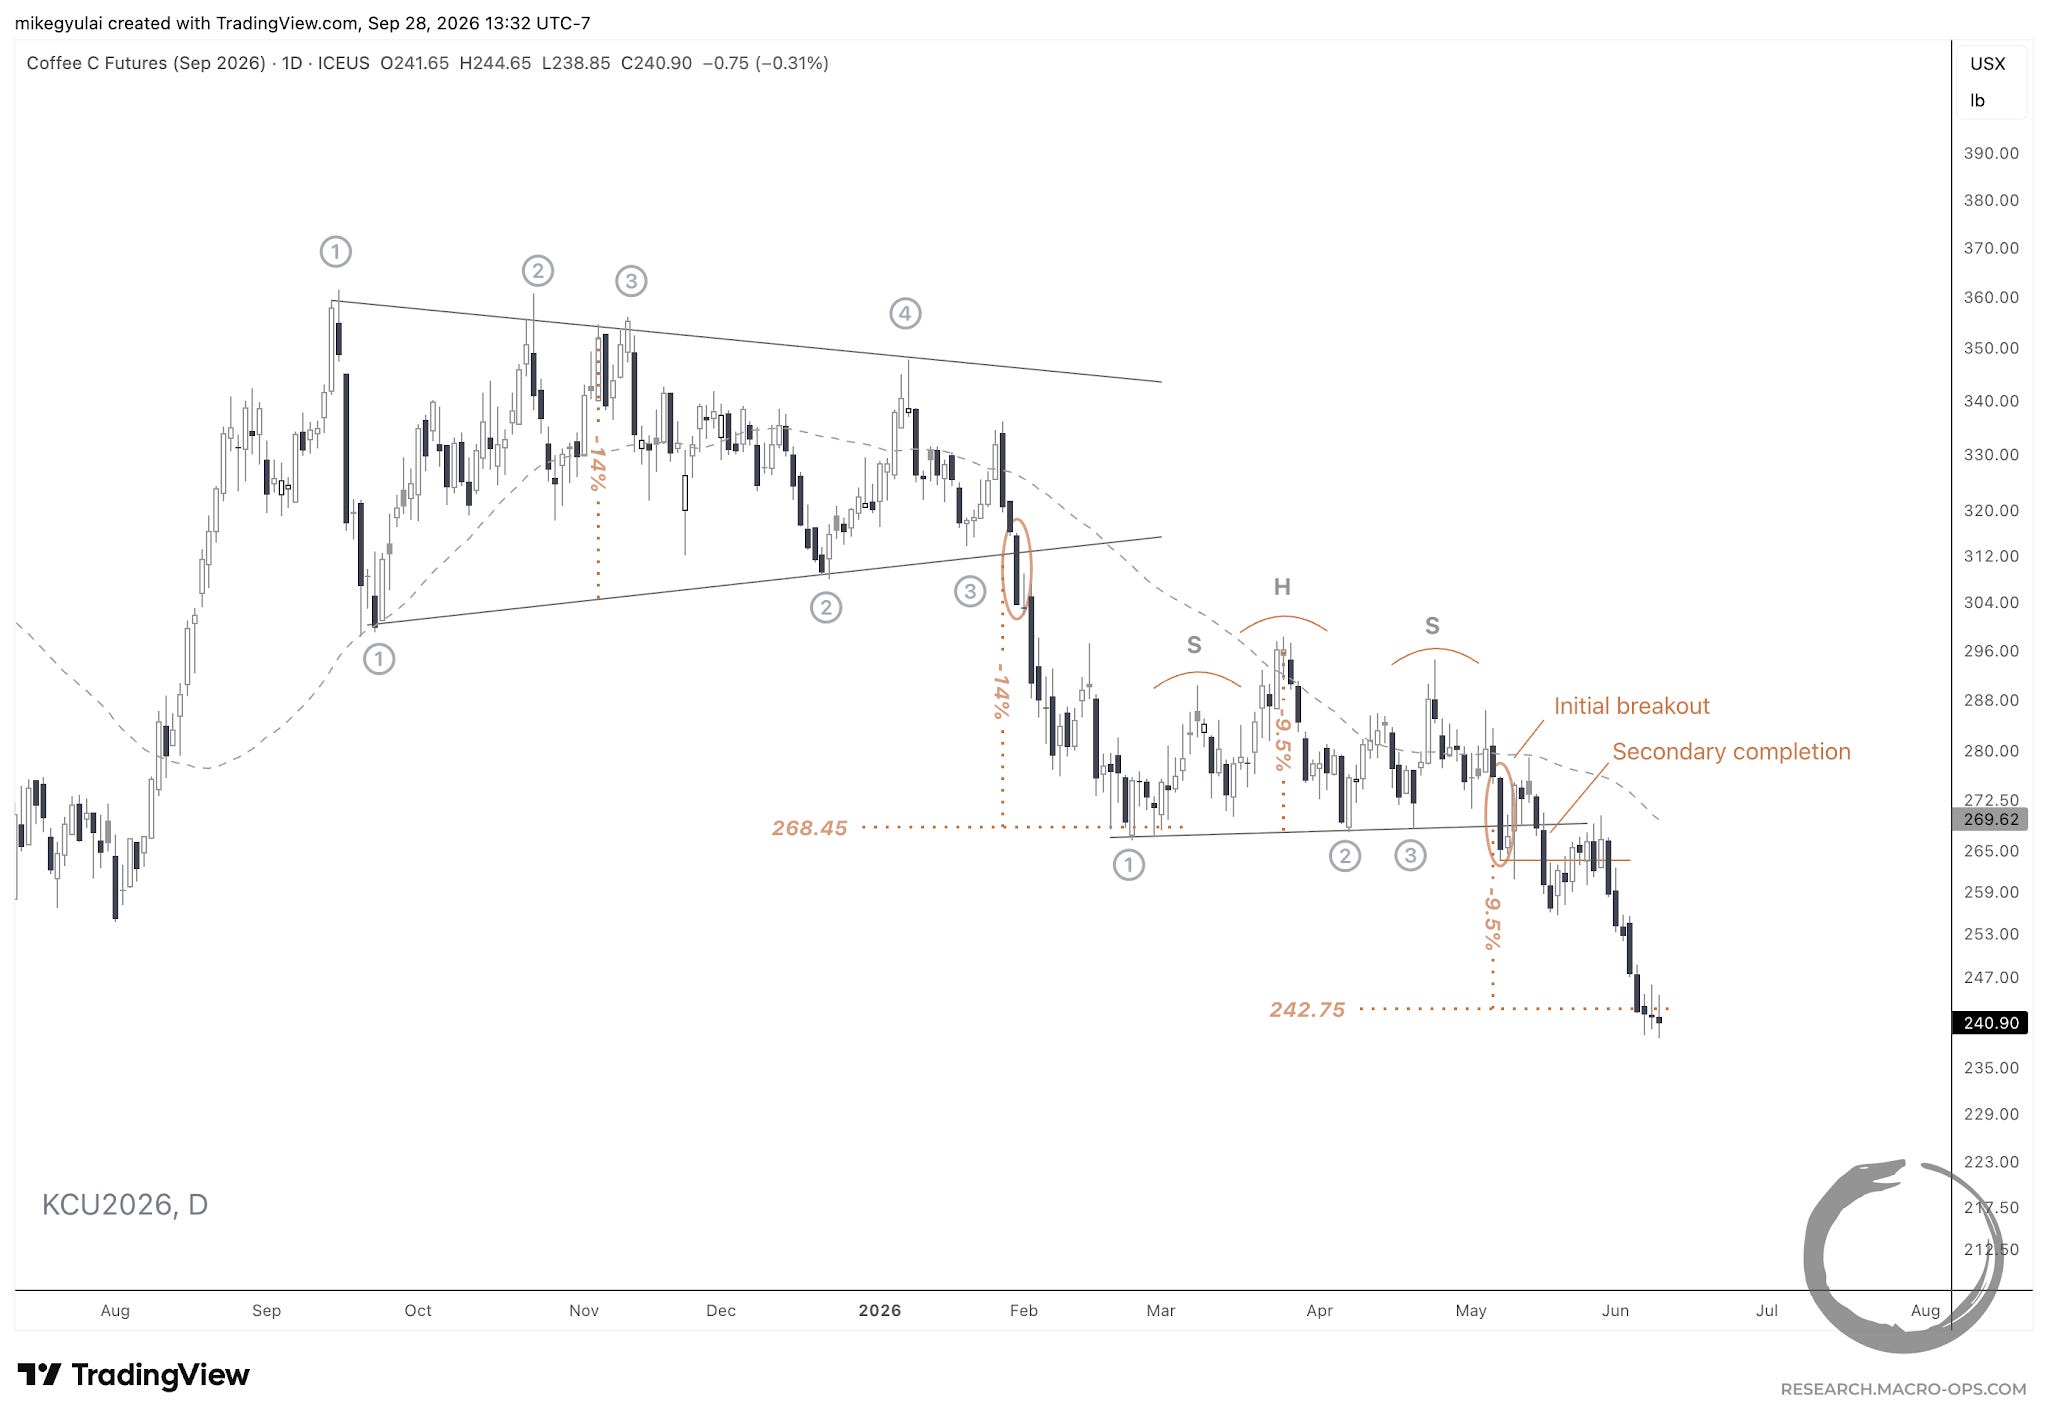
September coffee broke down from a 4.5-month symmetrical triangle on January 30, 2026, reaching its 1x measured move target of 268.45 three weeks later on February 19, 2026. Coffee then formed a 2.5-month head-and-shoulders continuation, which extended the downtrend to its 1x measured move target of 242.75 on June 4, 2026.
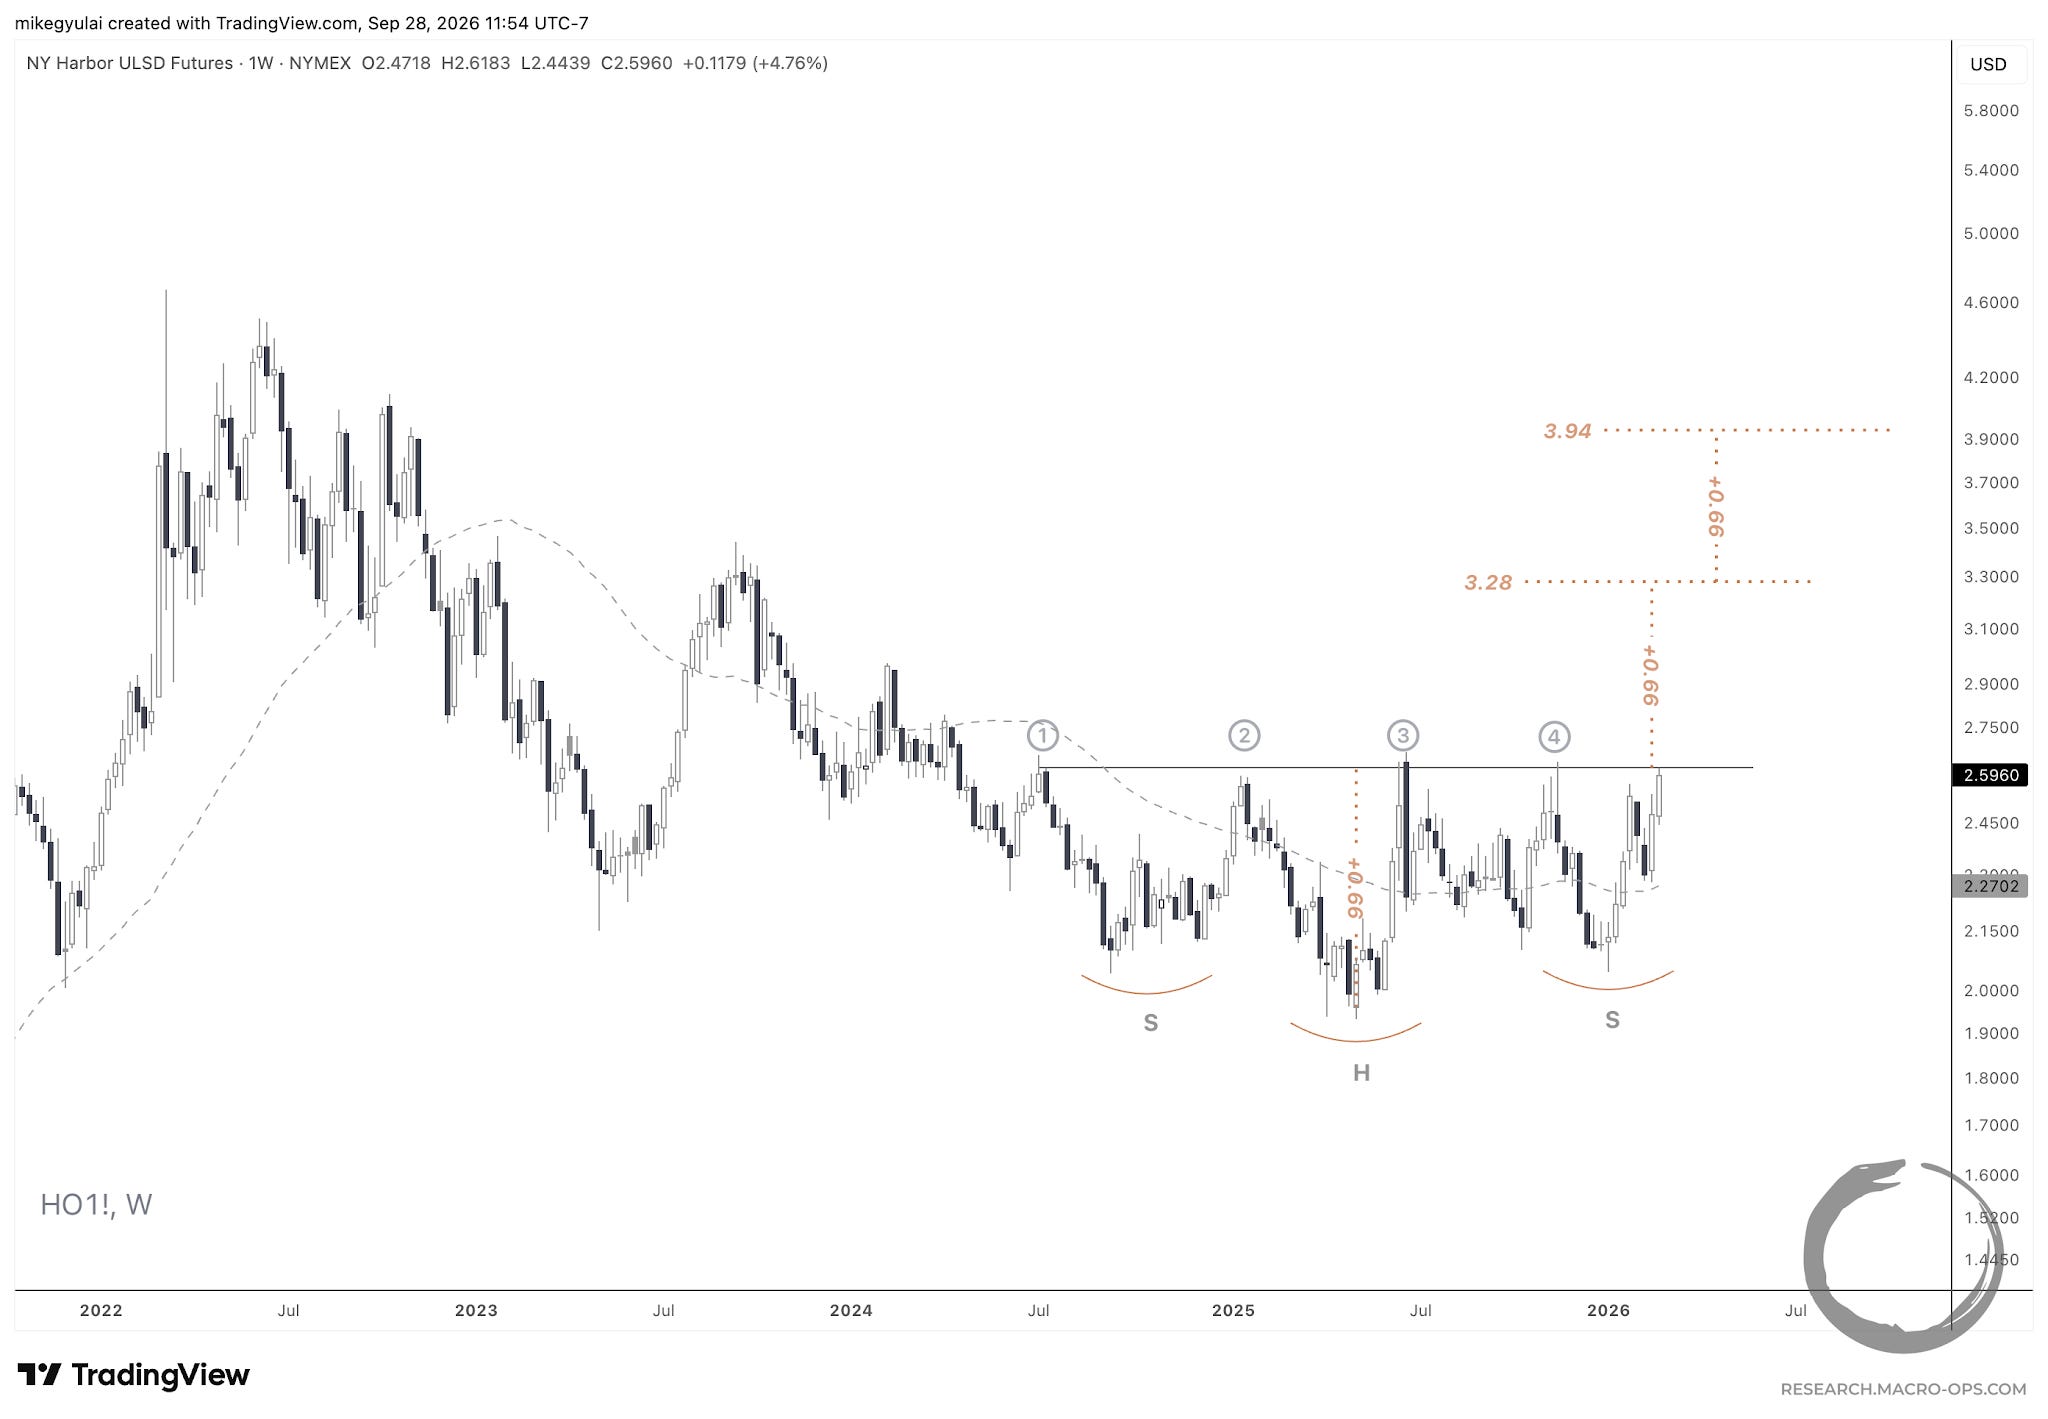
Heating oil futures formed a 1.5-year head-and-shoulders bottom on the weekly chart. The 1x measured move target sat at 3.28, the 2x at 3.94.
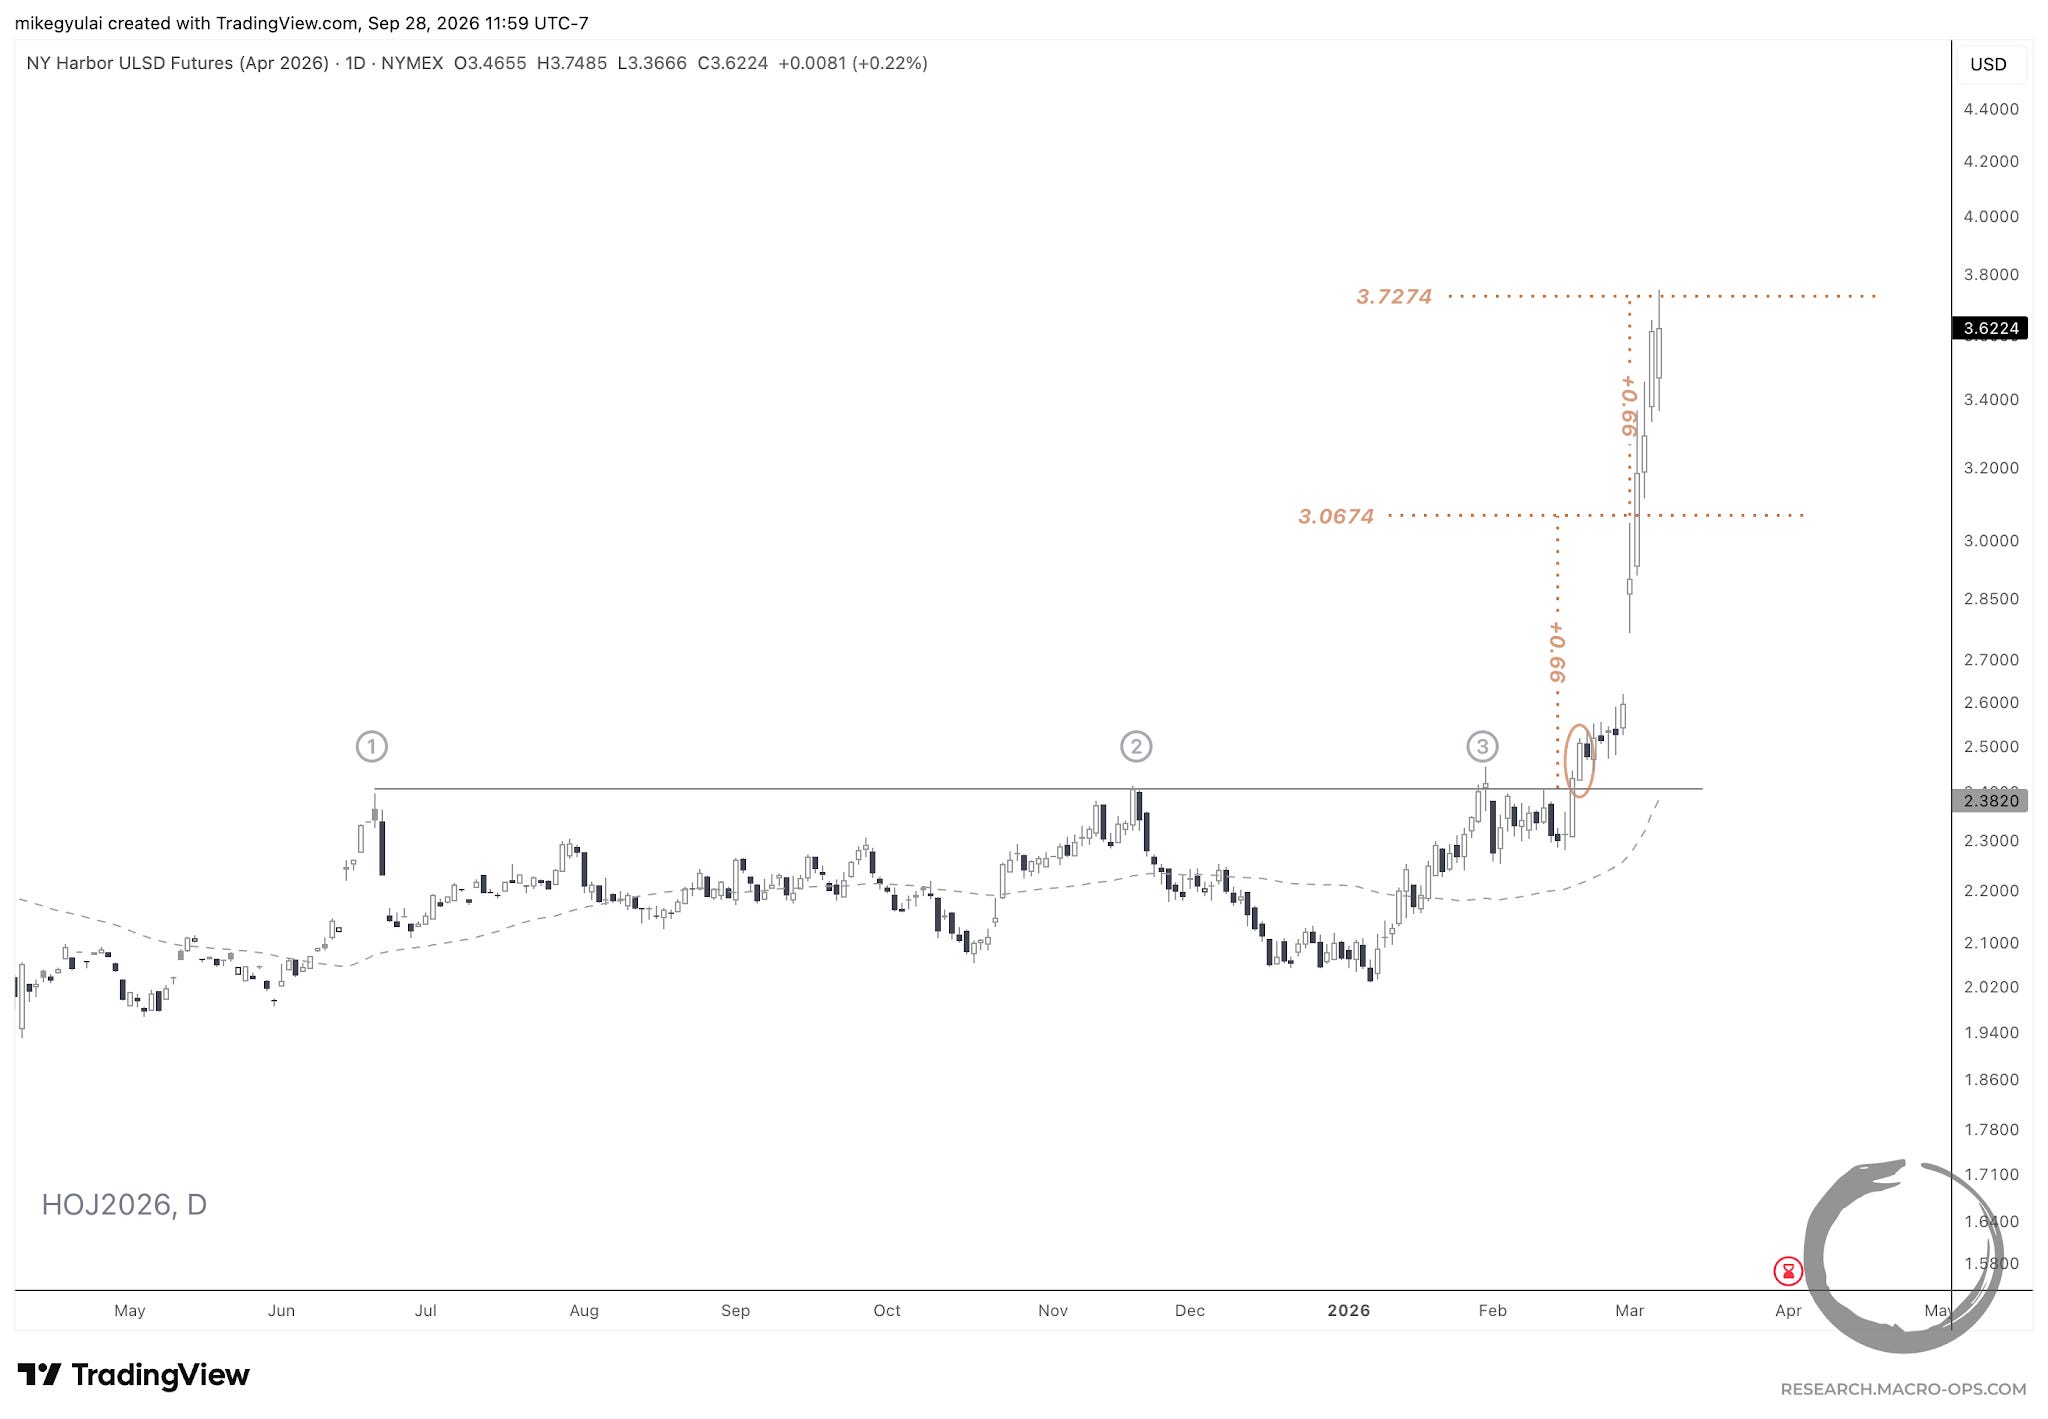
The trigger was the April contract, which broke out above an 8-month resistance line on February 19, 2026, reaching its 1x measured move target of 3.0674 on March 3, 2026, and its 2x target of 3.7274 three days later on March 6, 2026.
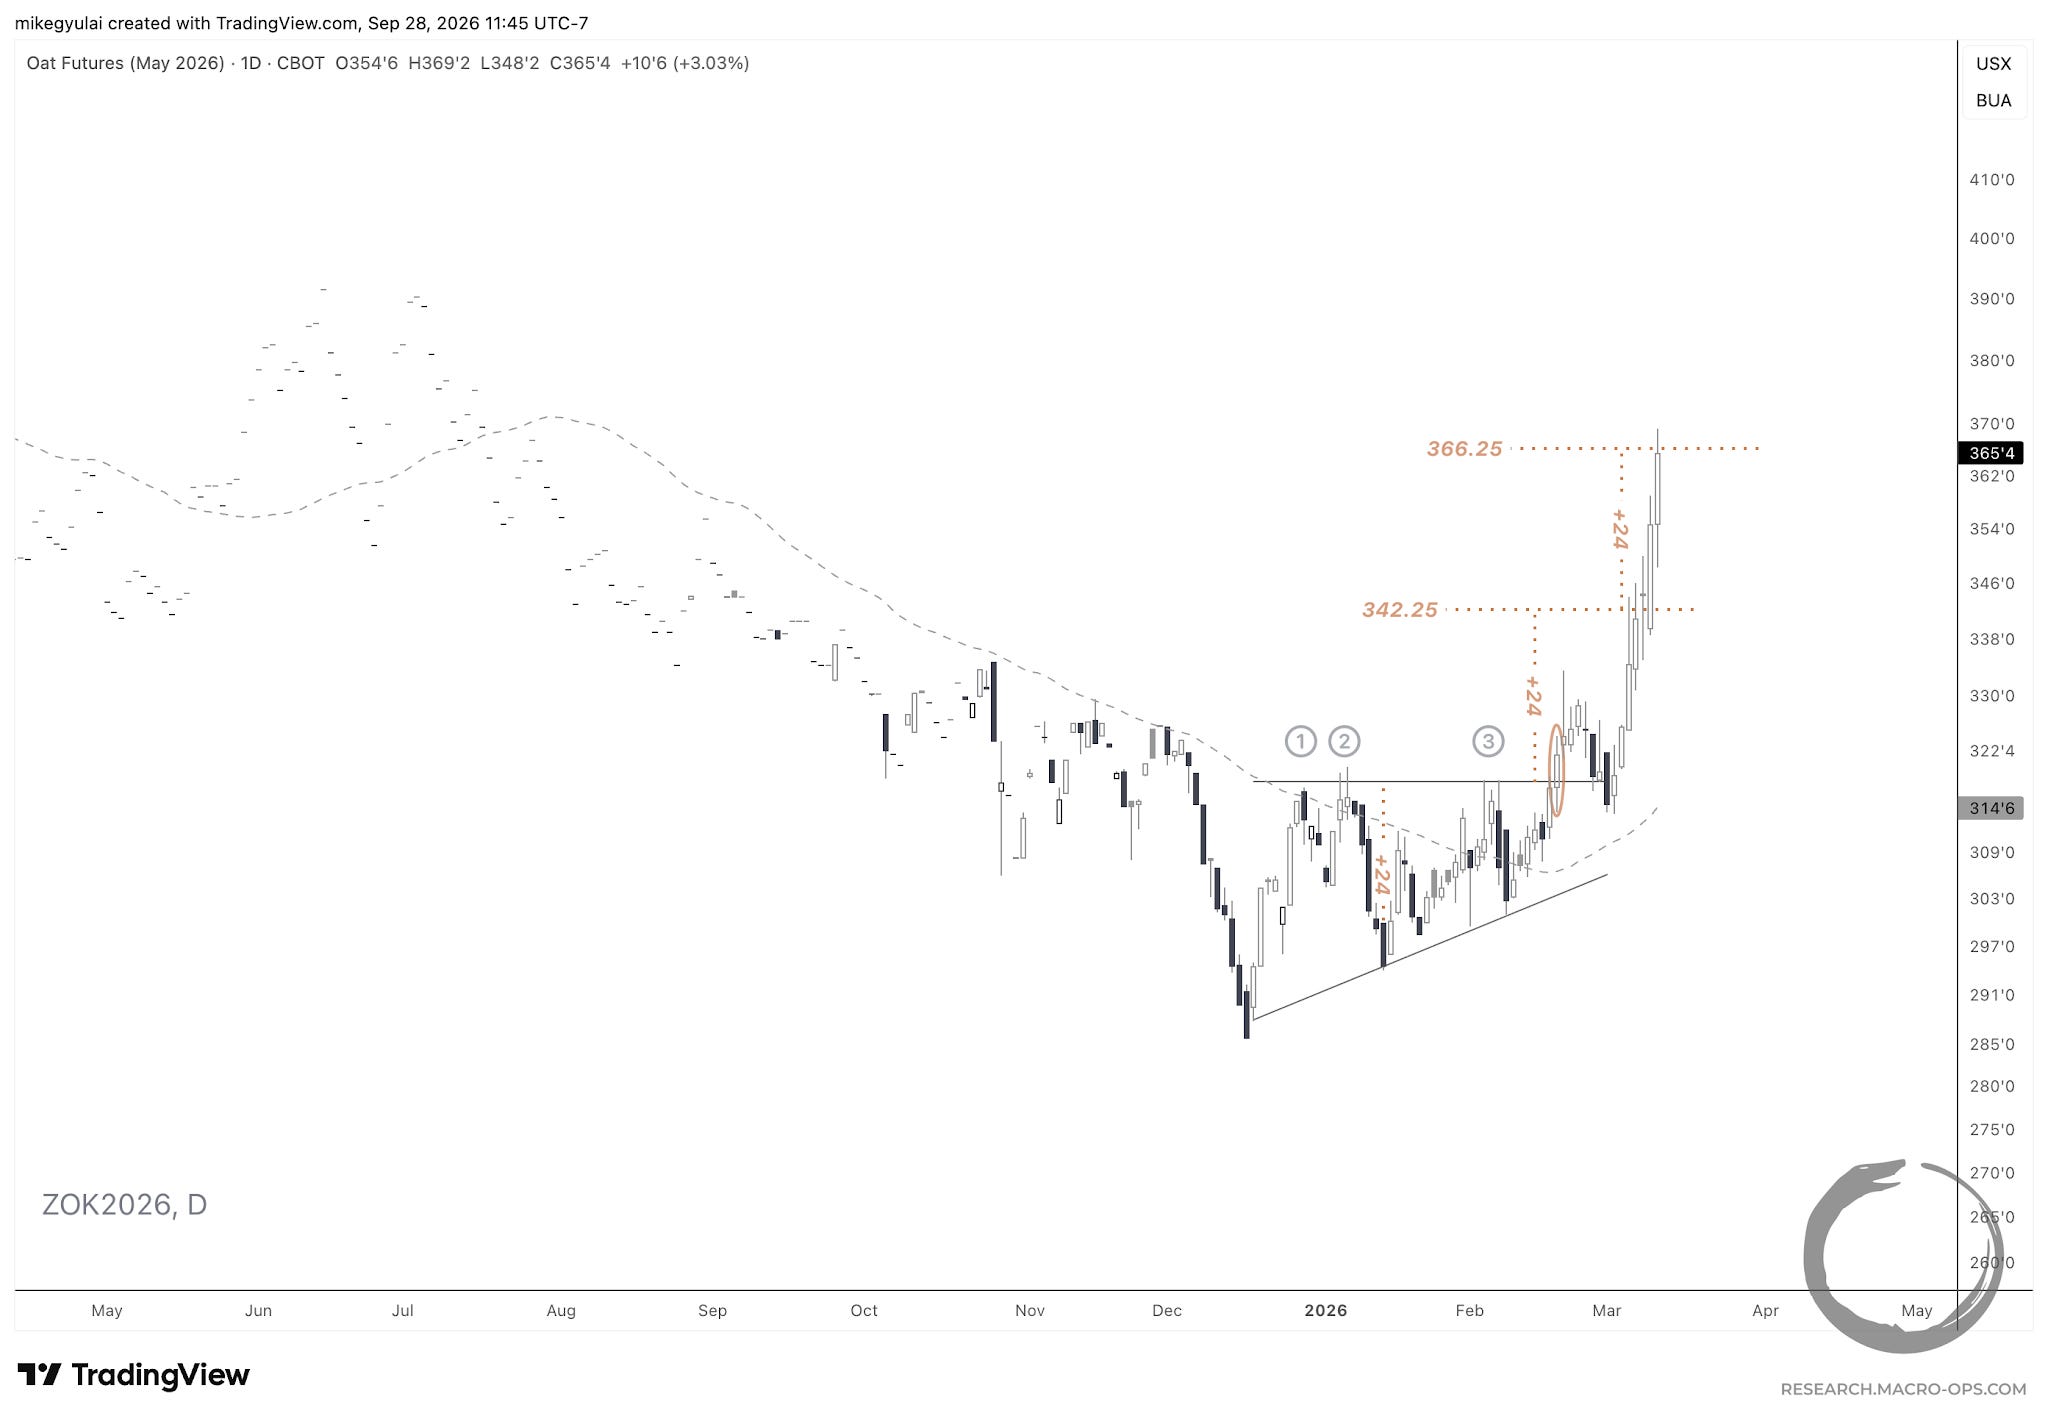
May oats broke out of a 2-month ascending triangle bottom on February 19, 2026, reaching their 1x measured move target of 342.25 two weeks later on March 5, 2026, and their 2x target of 366.25 on March 11, 2026.
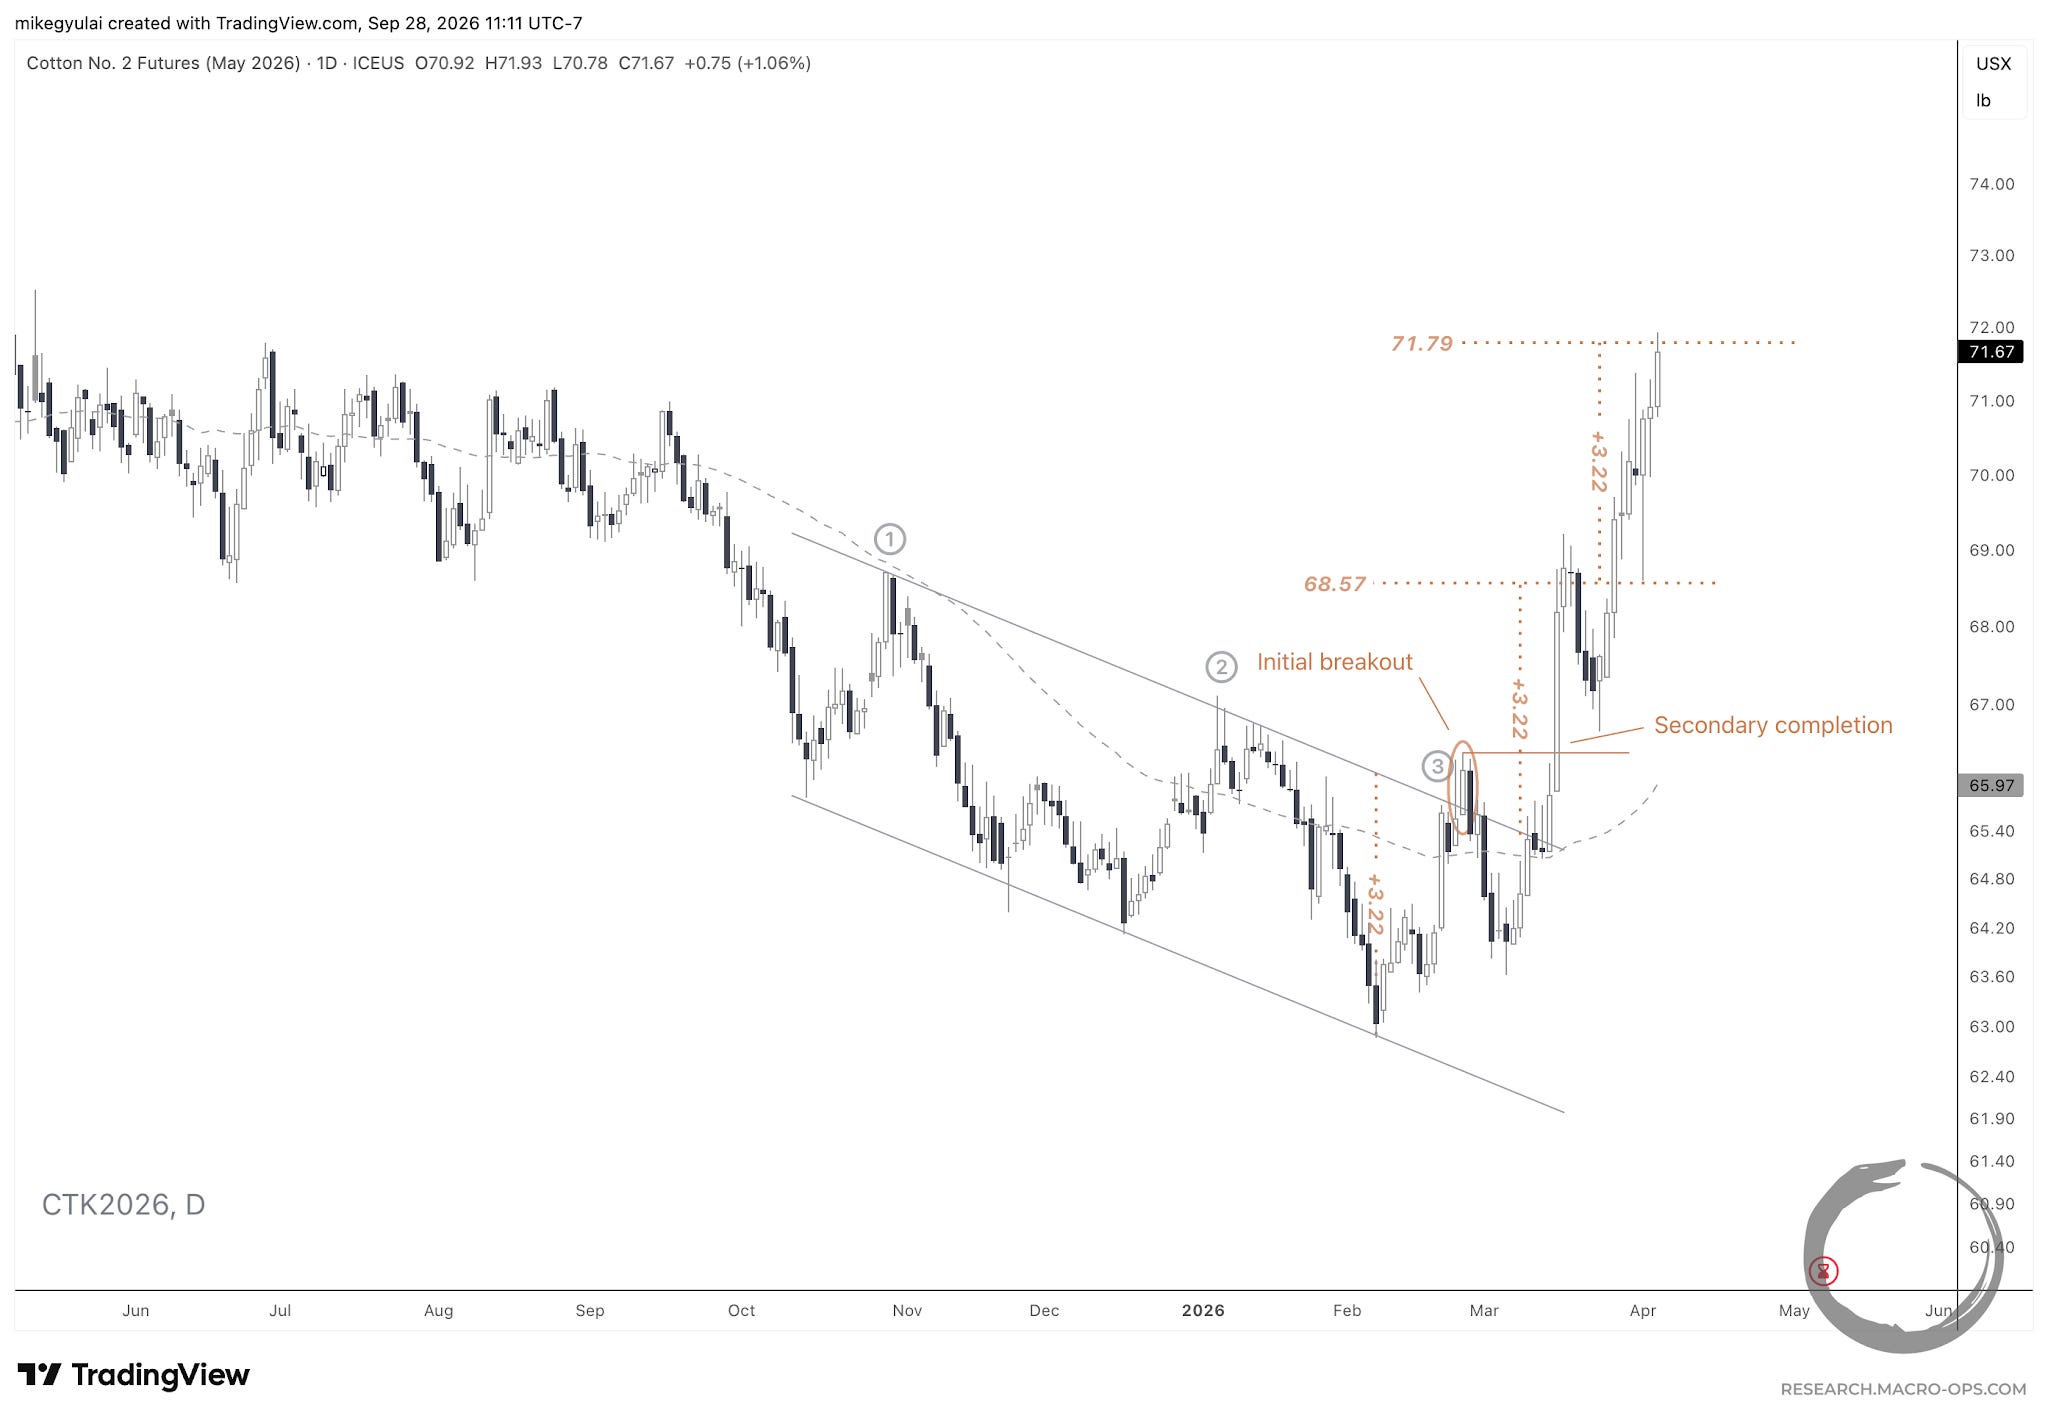
May cotton broke out of a 3.5-month descending channel on February 25, 2026, recompleting on March 16 after an initial pullback, and reaching its 1x measured move target of 68.57 that same day, then its 2x target of 71.79 on April 6, 2026.
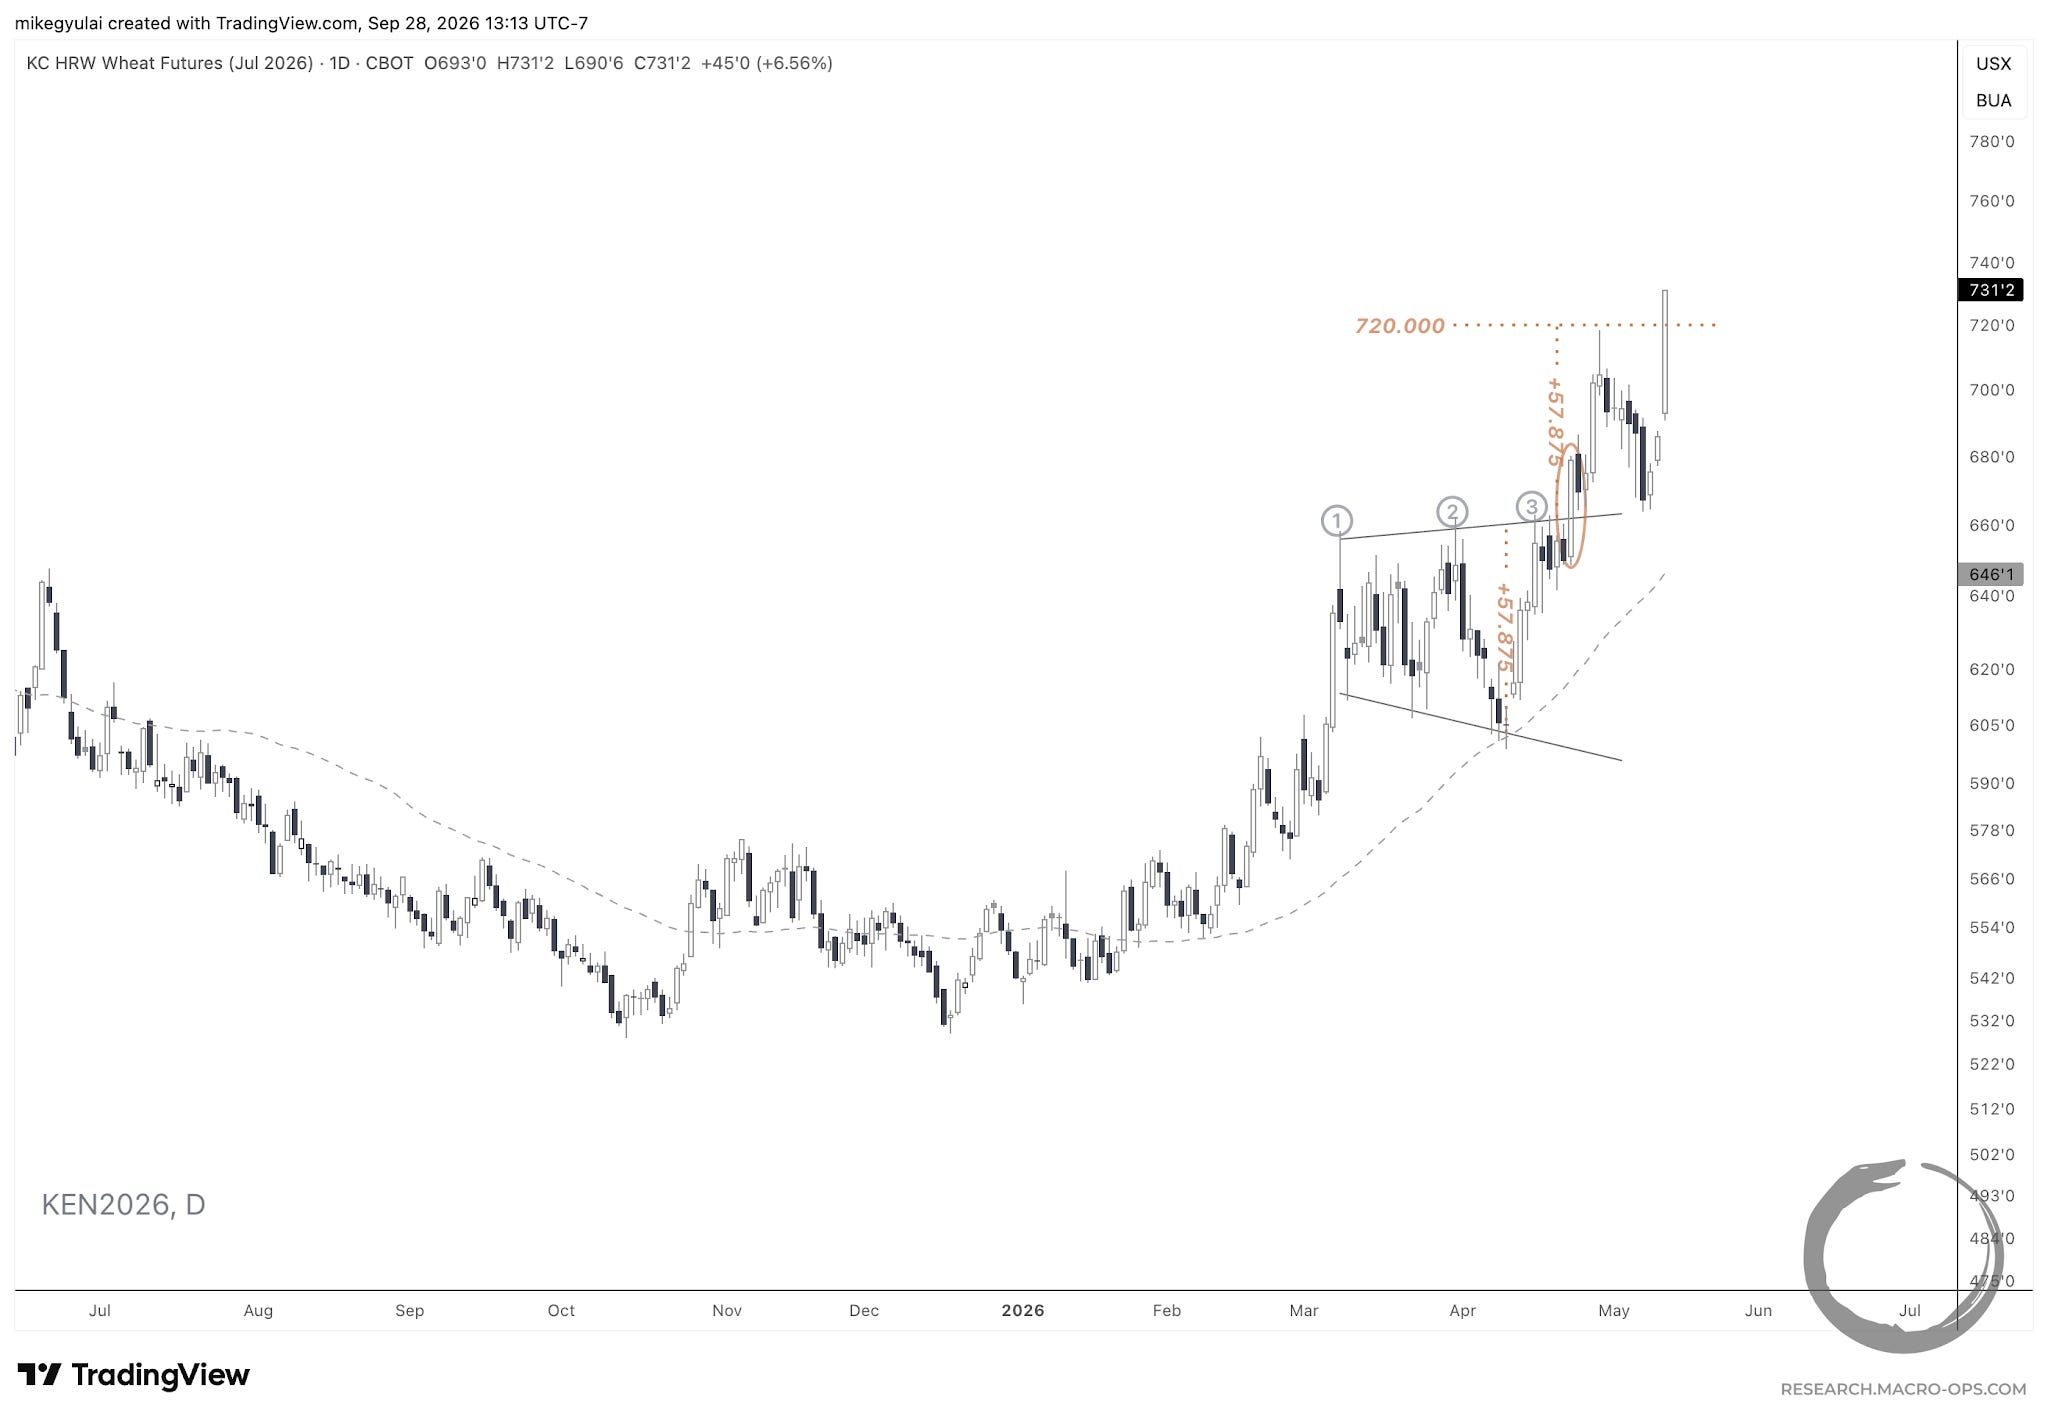
July KC wheat broke out of a 1.5-month broadening pattern on April 23, 2026, reaching its 1x measured move target of 720 three weeks later on May 12, 2026.
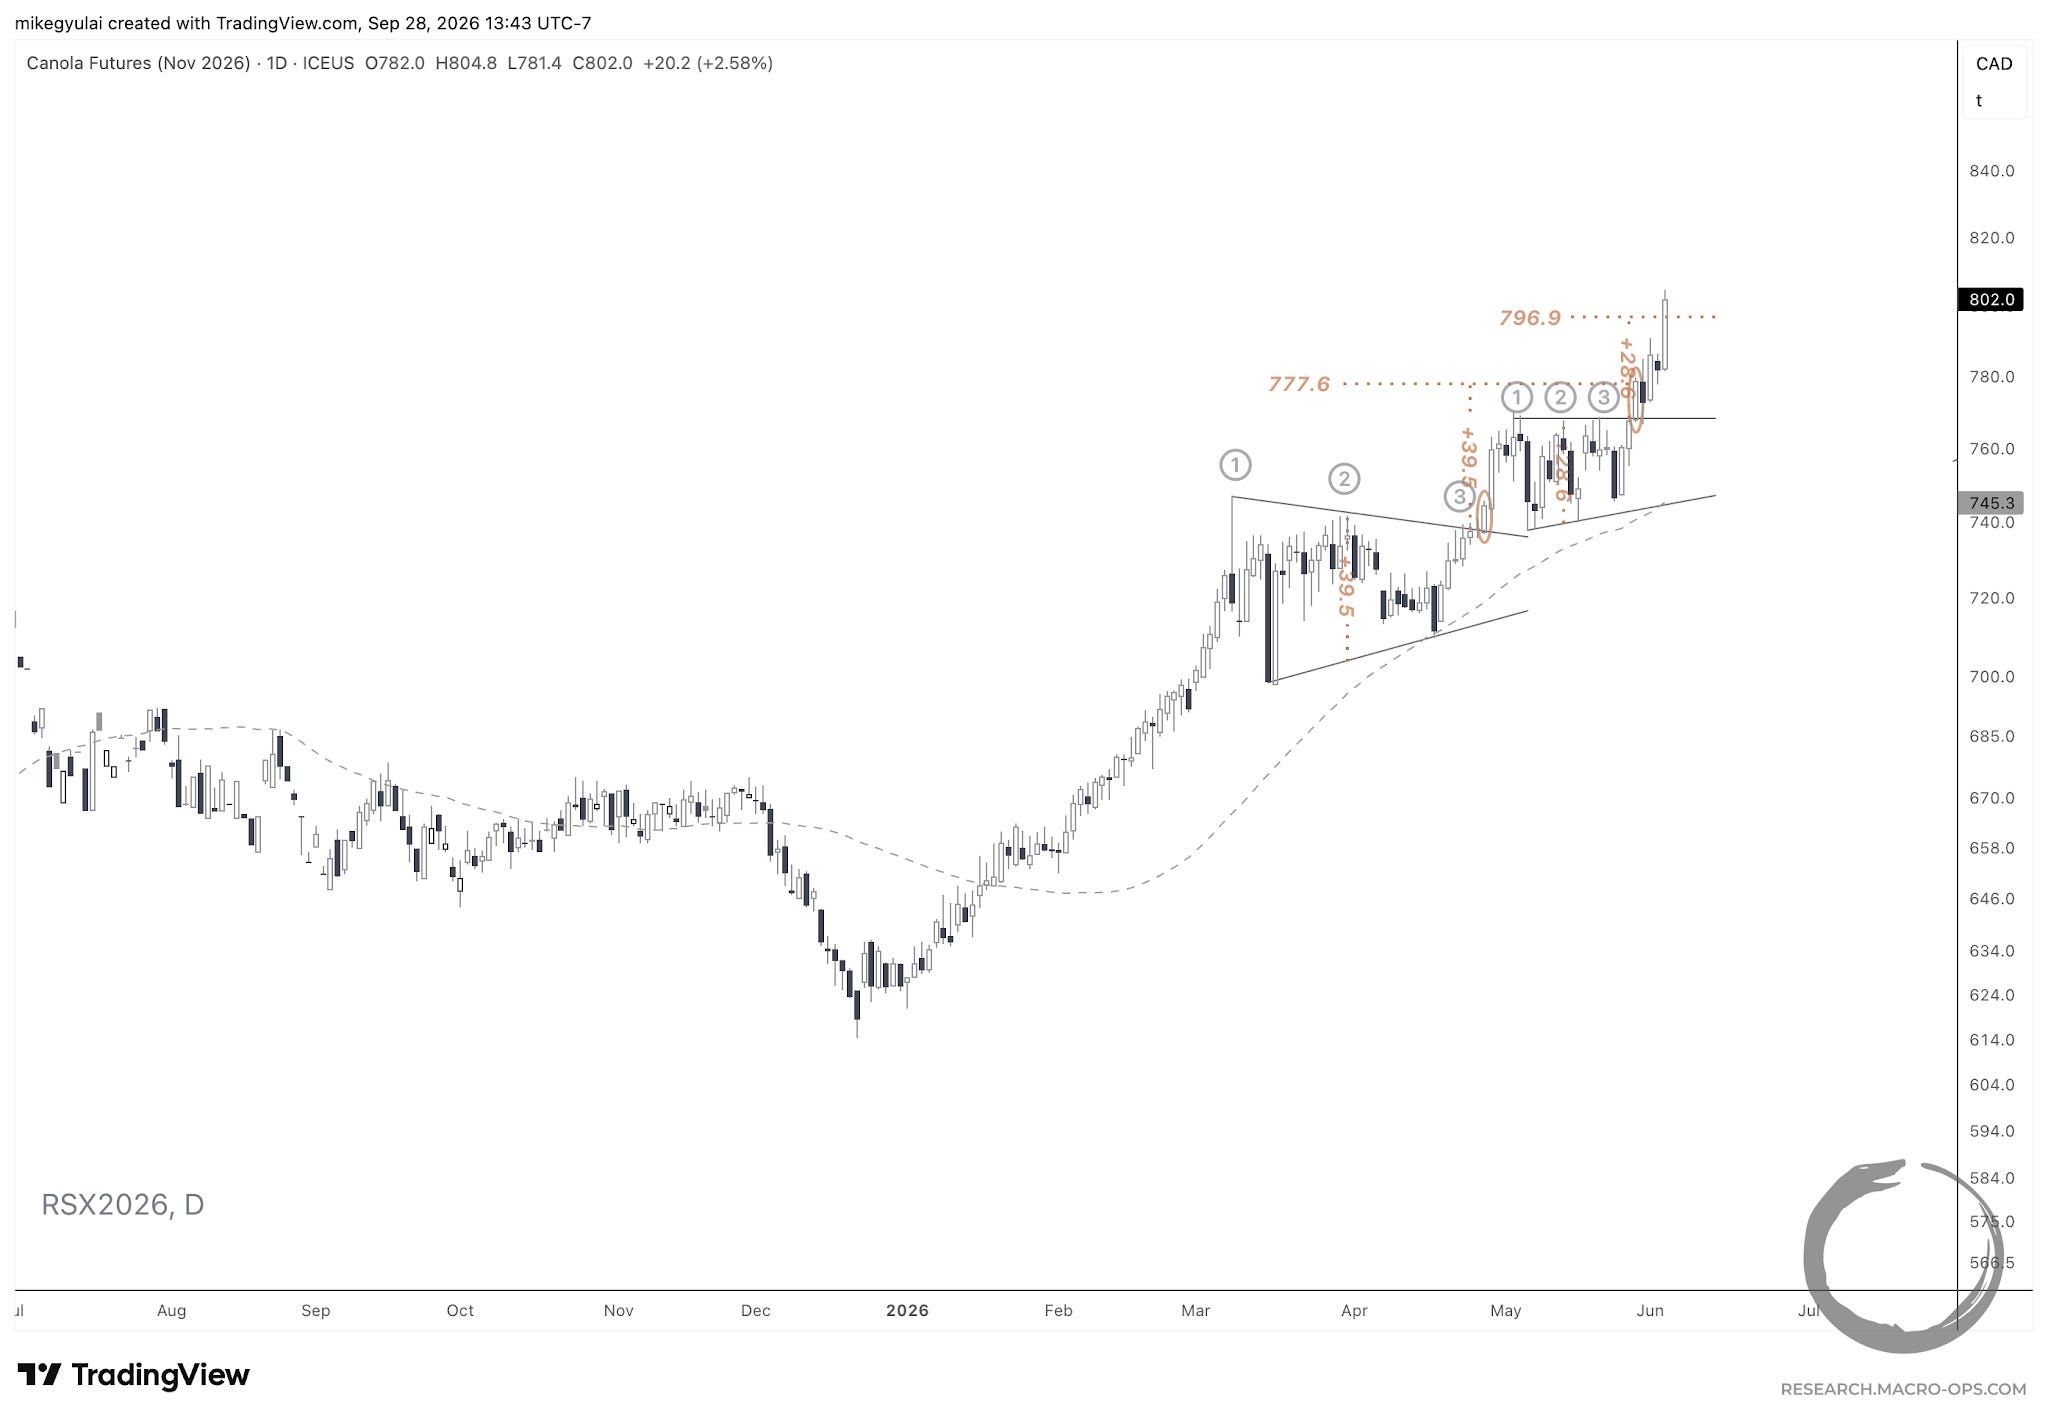
November canola broke out of a 1.5-month symmetrical triangle on April 28, 2026, reaching its 1x measured move target of 777.6 one month later on May 28, 2026. It then formed a 1-month ascending triangle, which broke out the same day the initial pattern’s 1x target was reached, and reached the second pattern’s 1x measured move target of 796.9 six days later on June 3, 2026.
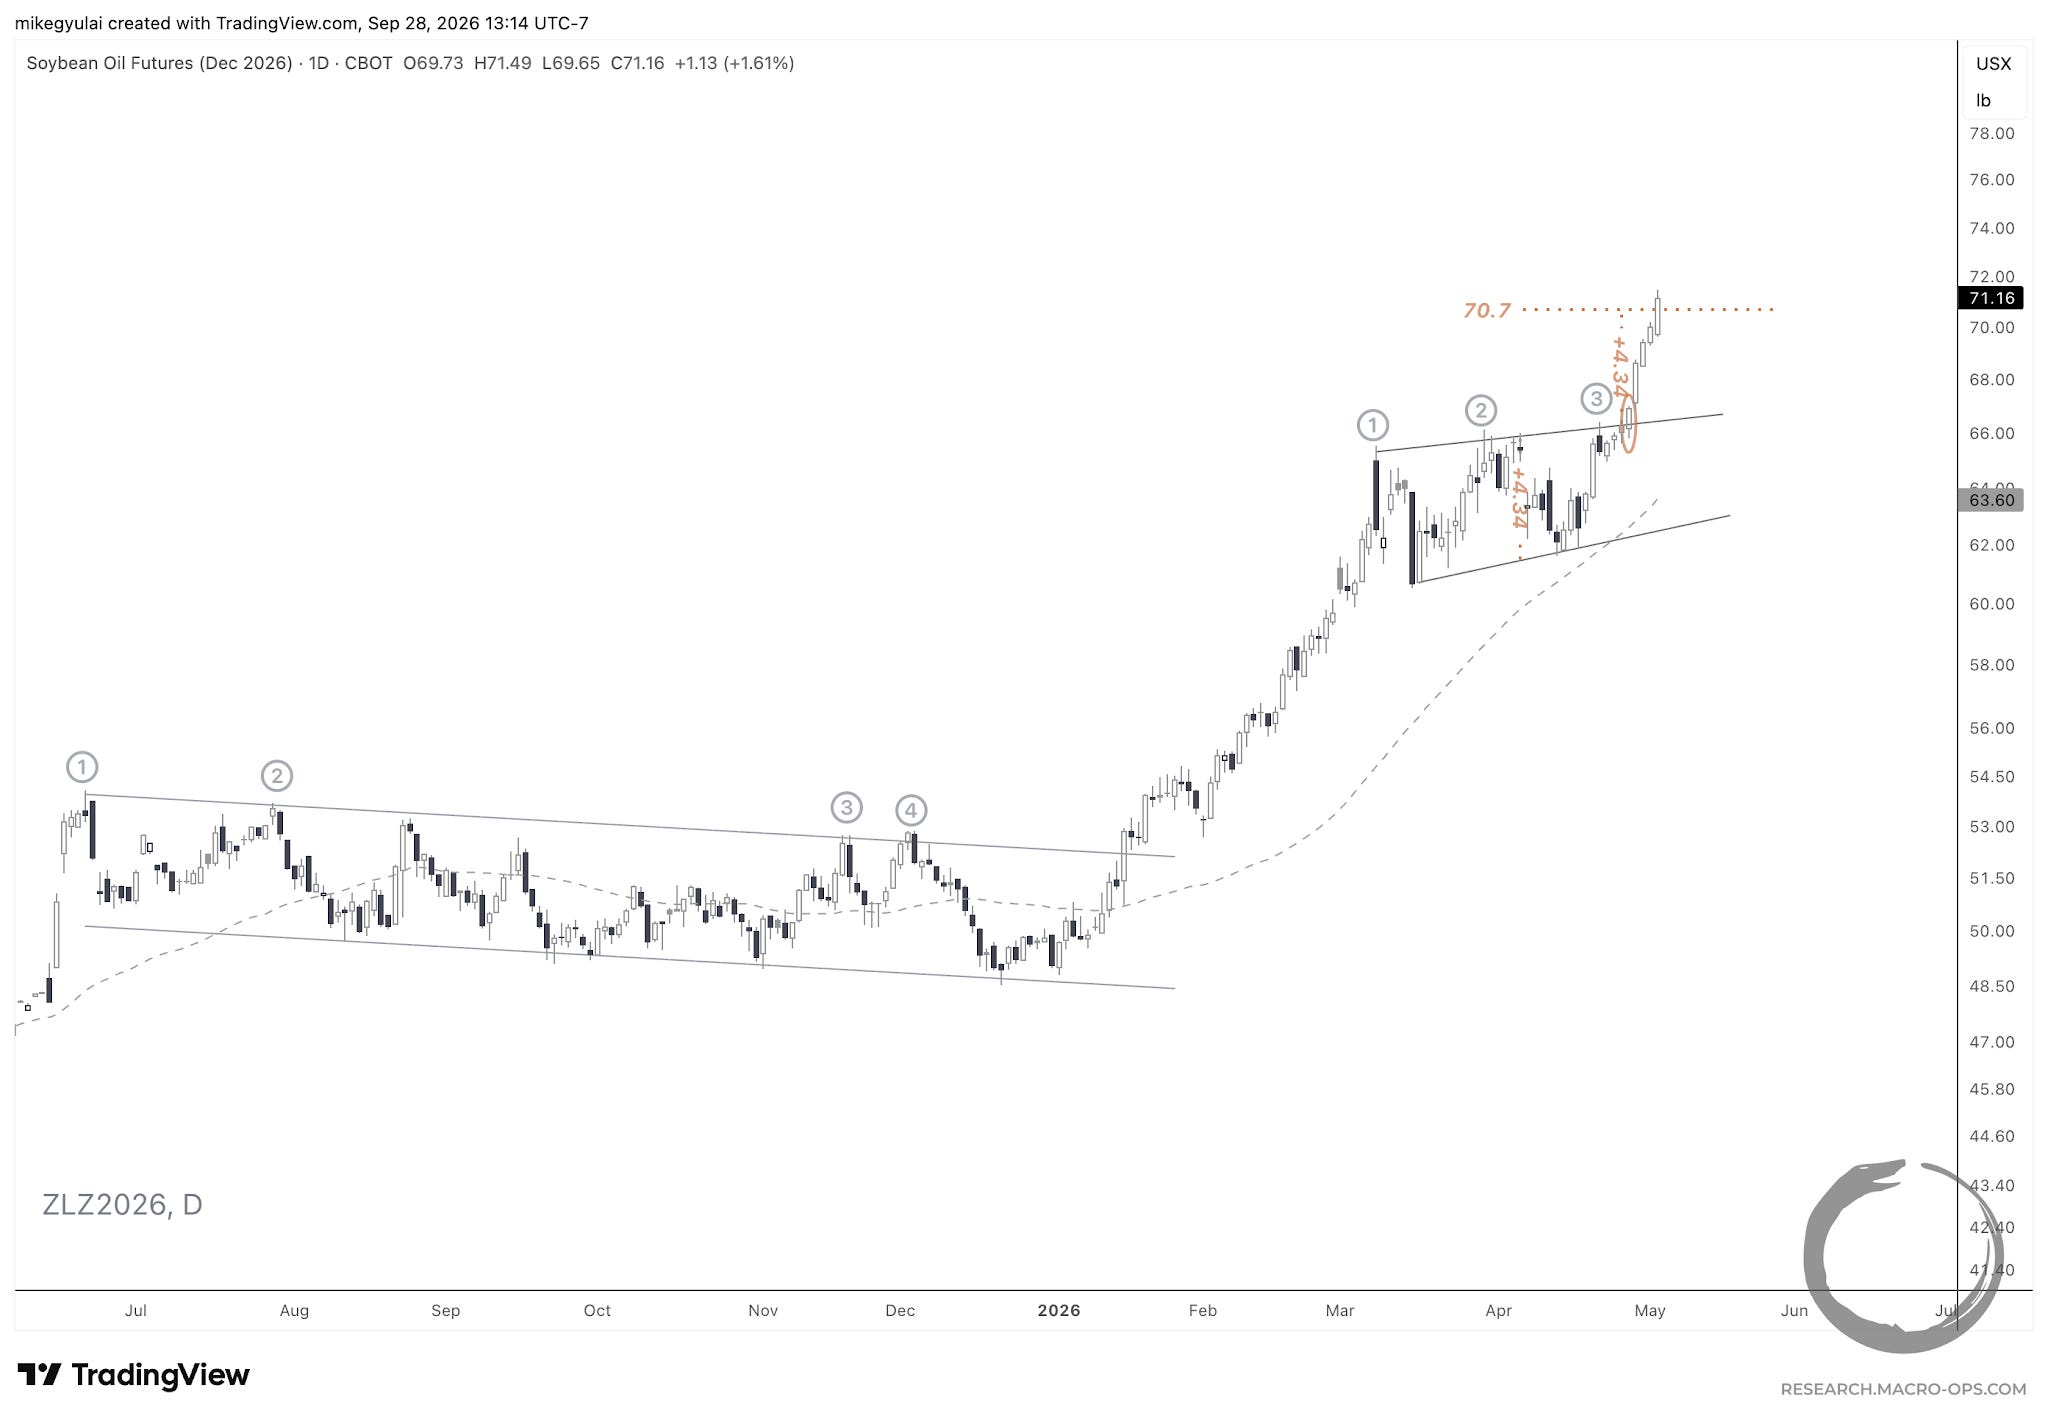
December soybean oil broke out of a 1.5-month ascending channel on April 28, 2026, reaching its 1x measured move target of 70.7 six days later on May 4, 2026.
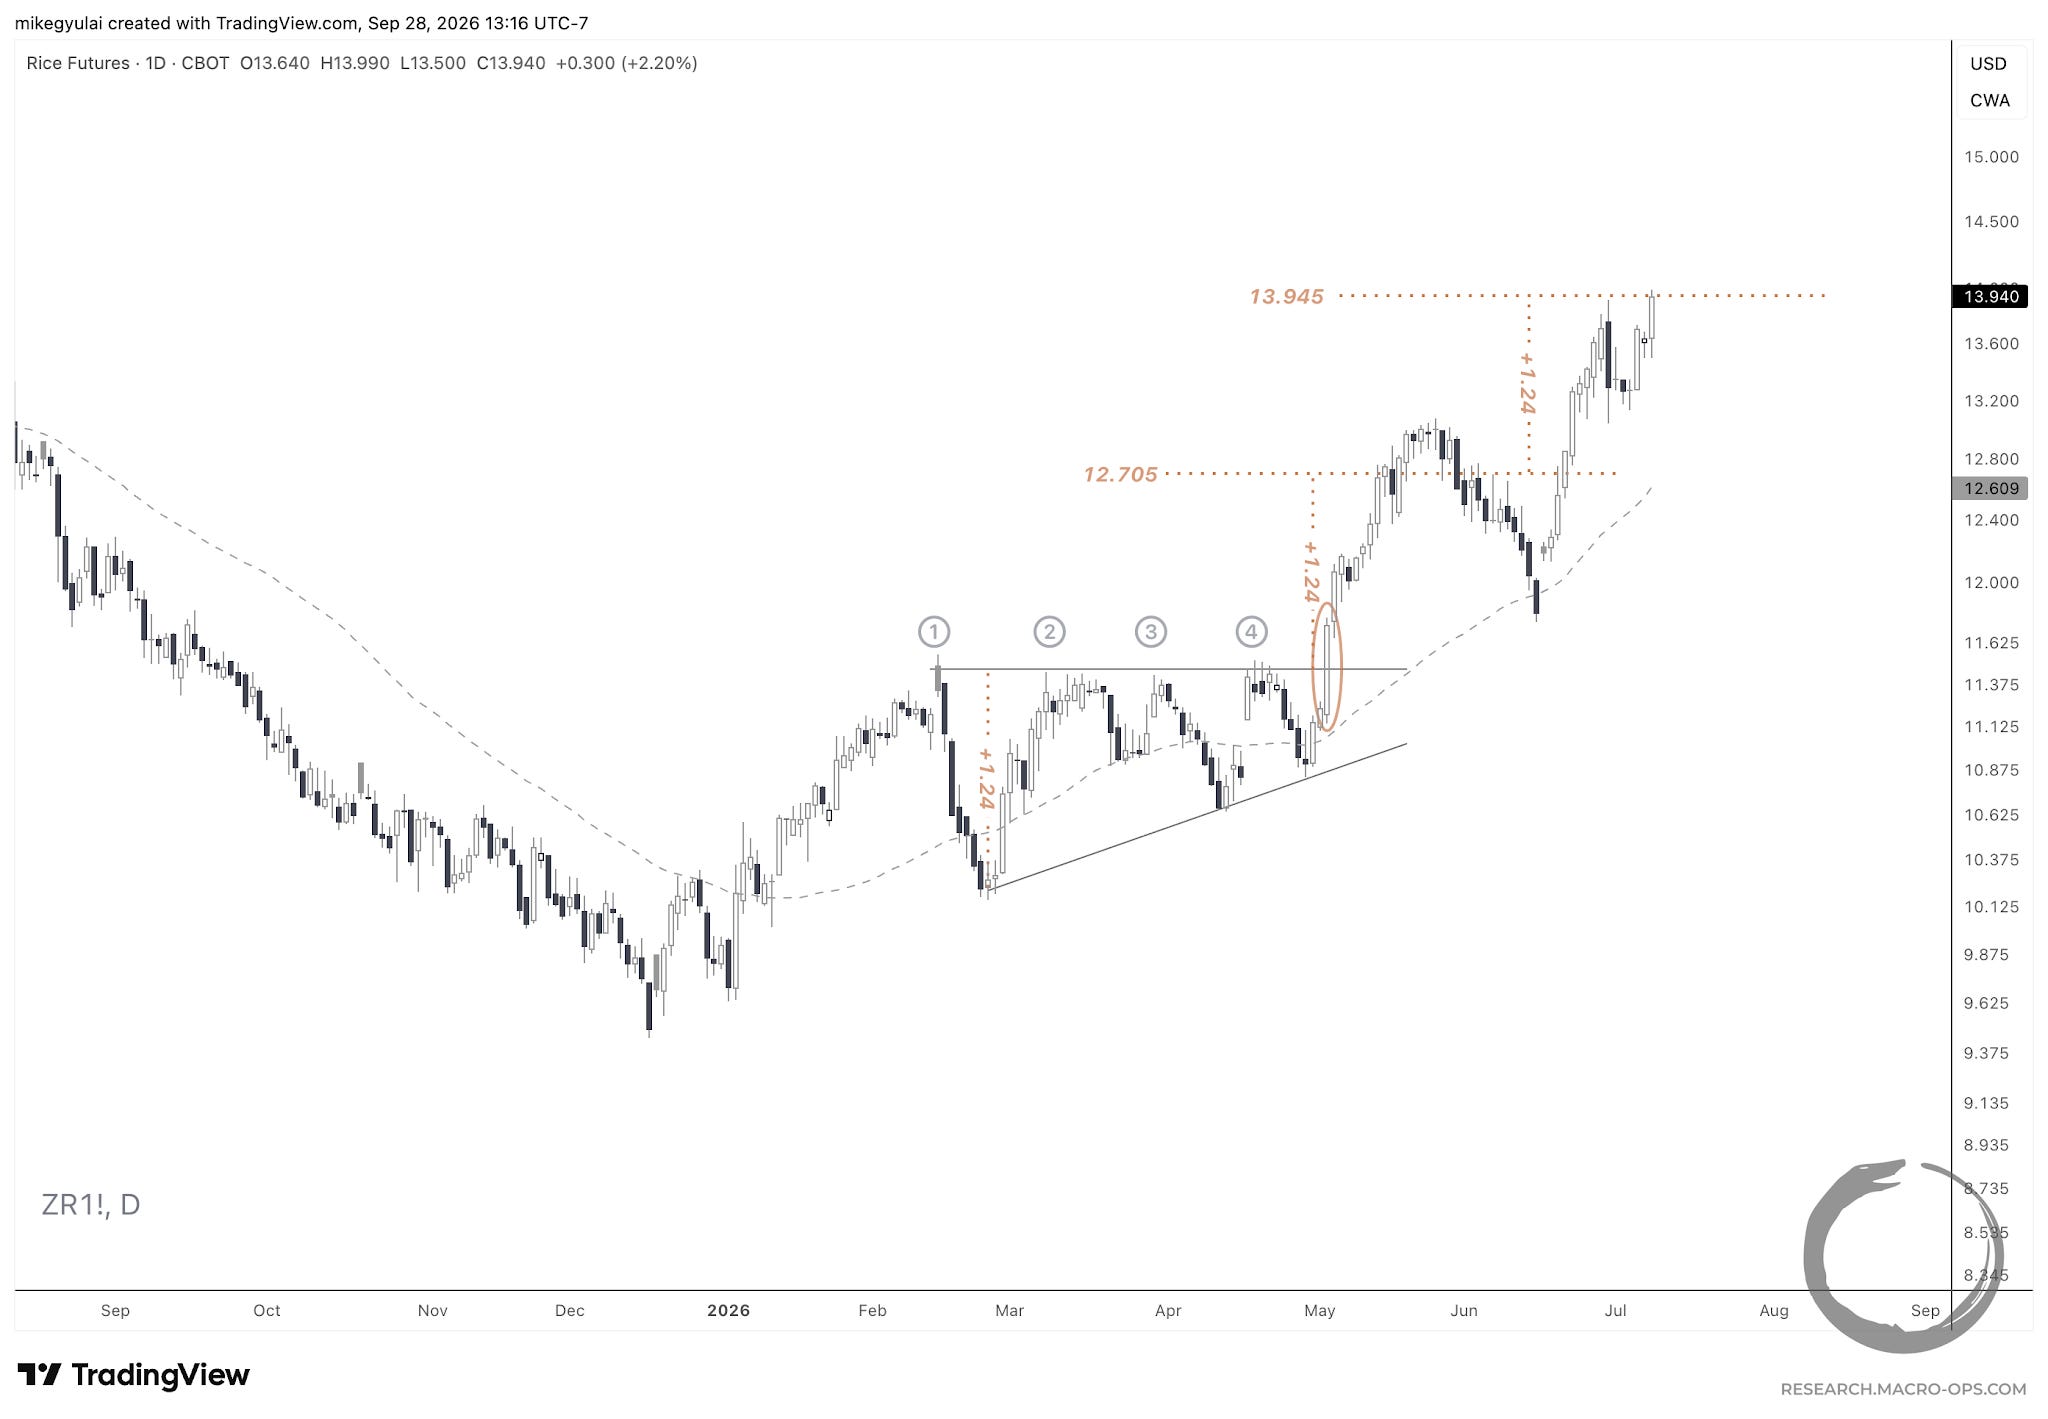
Rough rice broke out of a 2.5-month ascending triangle bottom on May 4, 2026, reaching its 1x measured move target of 12.705 nine days later on May 13, 2026, and its 2x target of 13.945 on July 9, 2026.
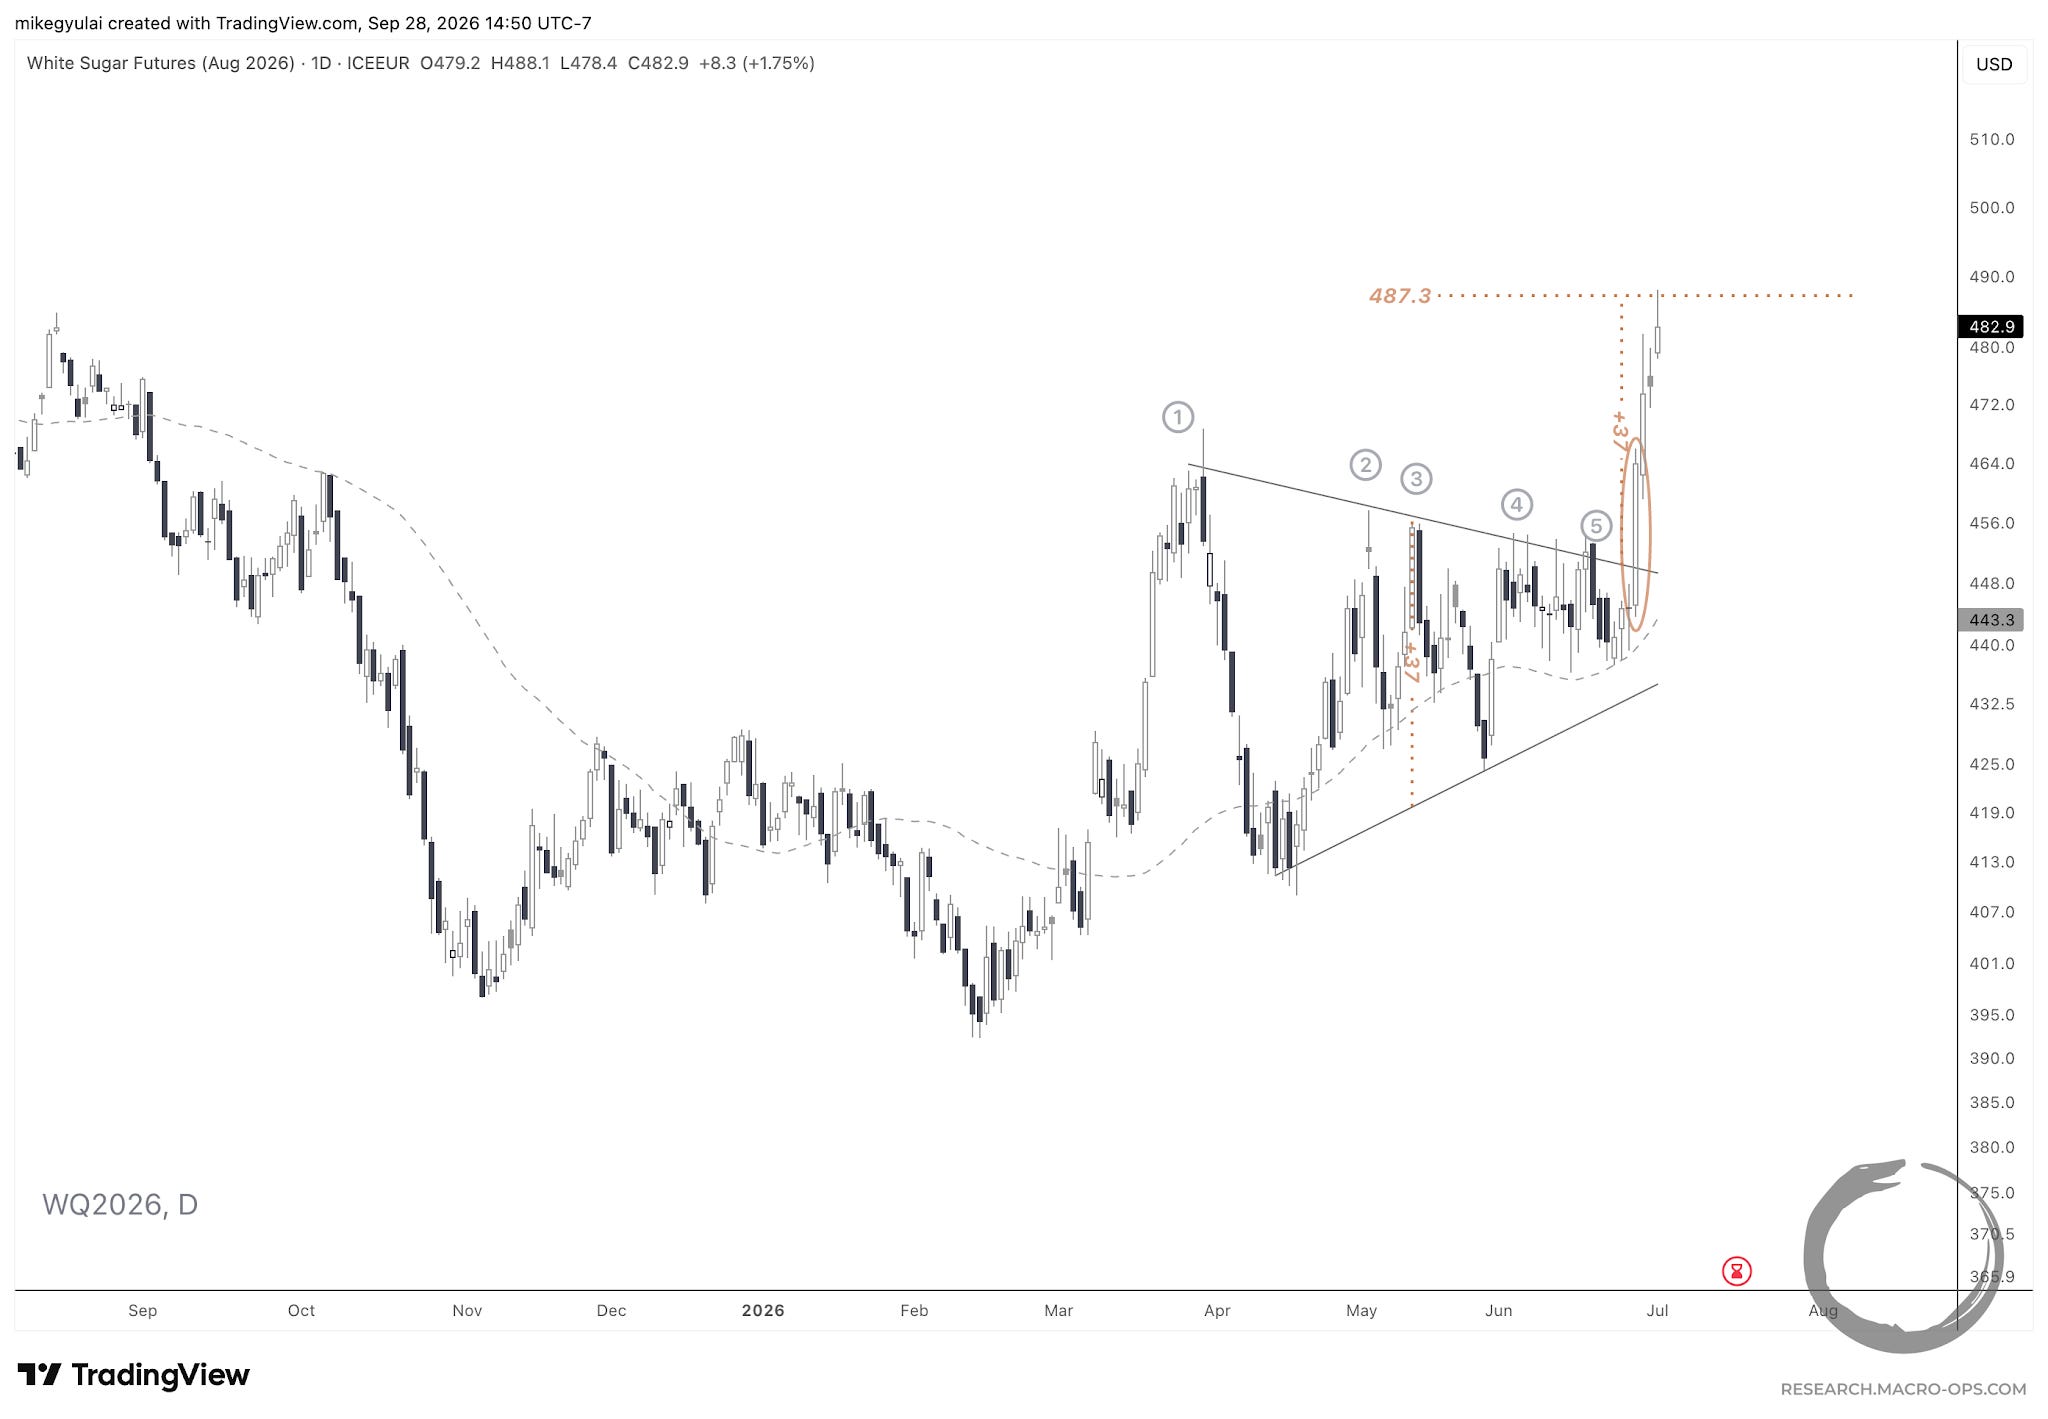
August white sugar broke out of a 3-month symmetrical triangle on June 26, 2026, reaching its 1x measured move target of 487.3 five days later on July 1, 2026.
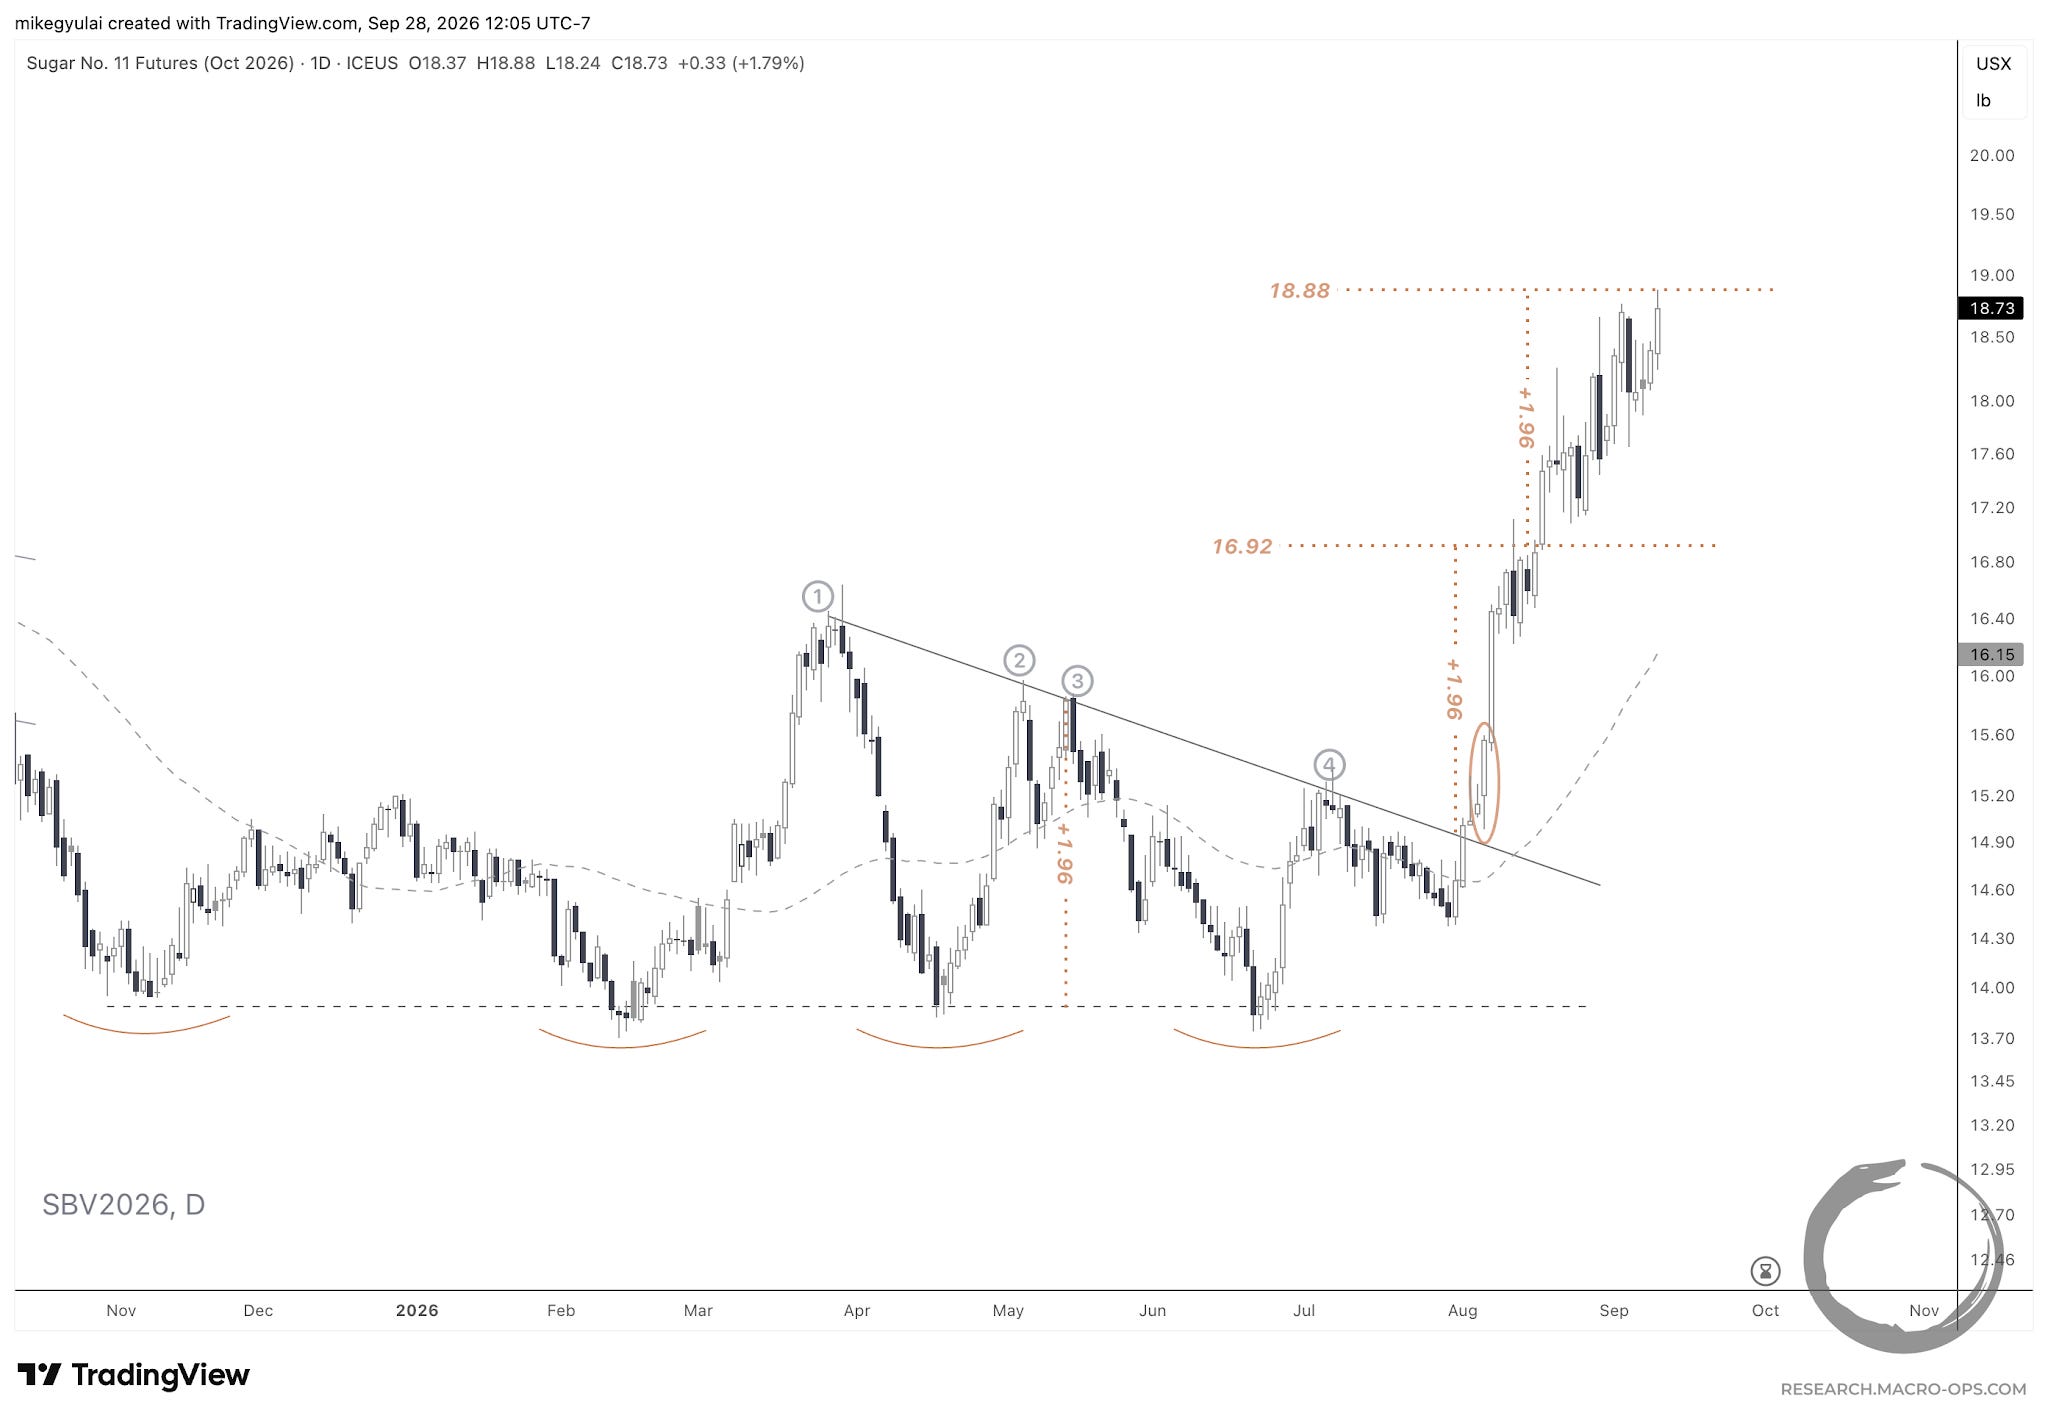
October raw sugar broke out of a 4-month multi-point trendline on August 6, 2026, reaching its 1x measured move target of 16.92 six days later on August 12, 2026, and its 2x target of 18.88 on September 10, 2026.
December corn broke out of a 3-month head-and-shoulders continuation on August 17, 2026, reaching its 1x measured move target of 548.75 two weeks later on September 2, 2026.
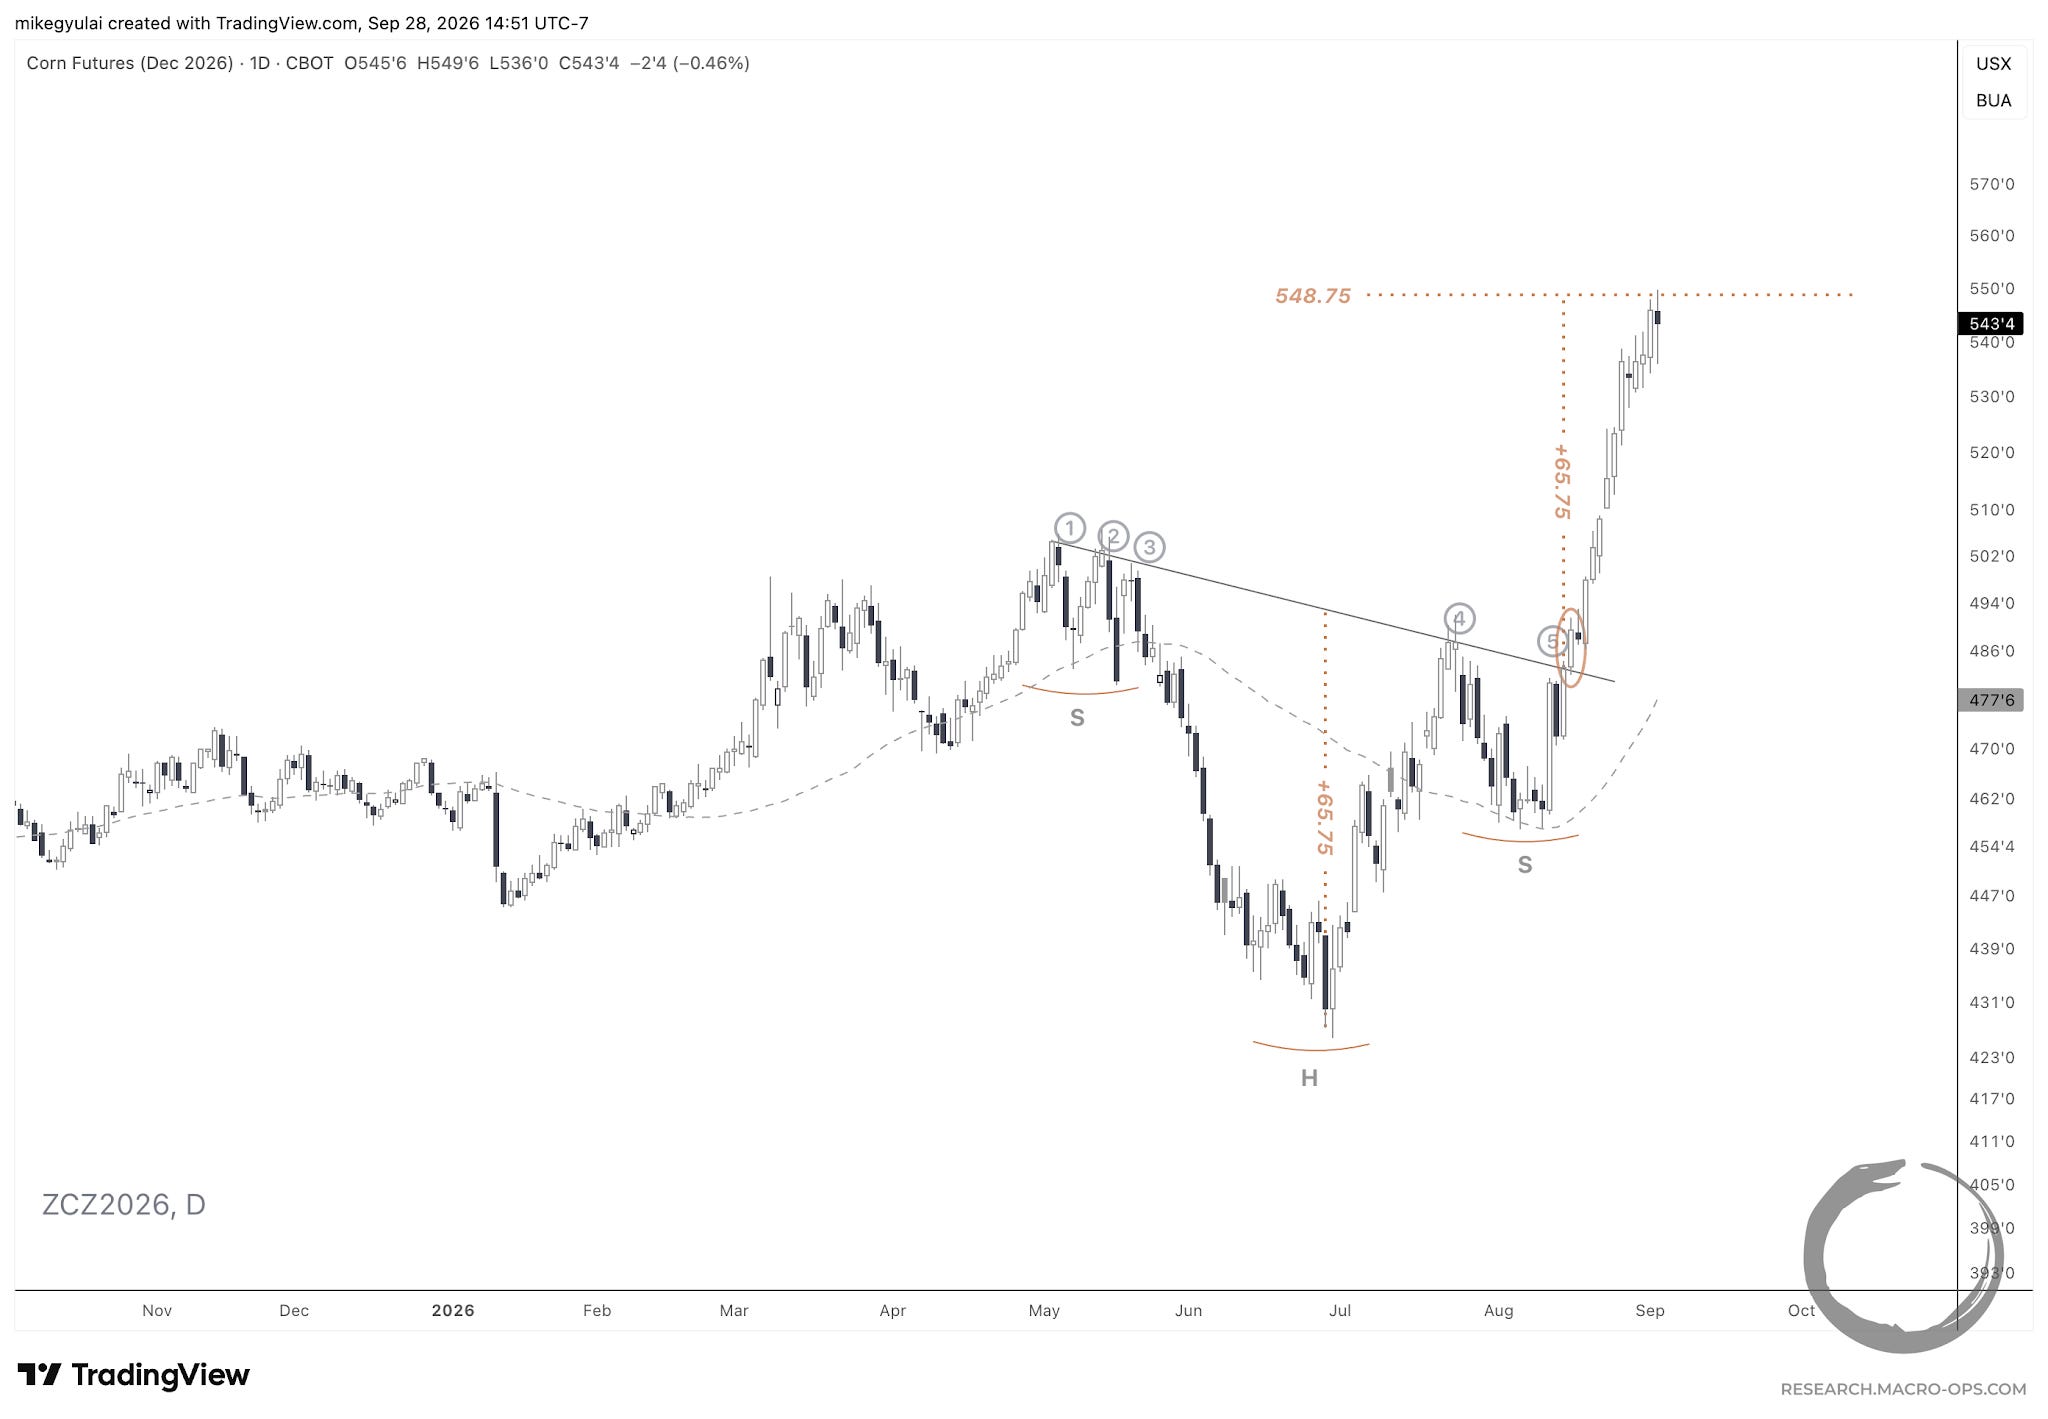
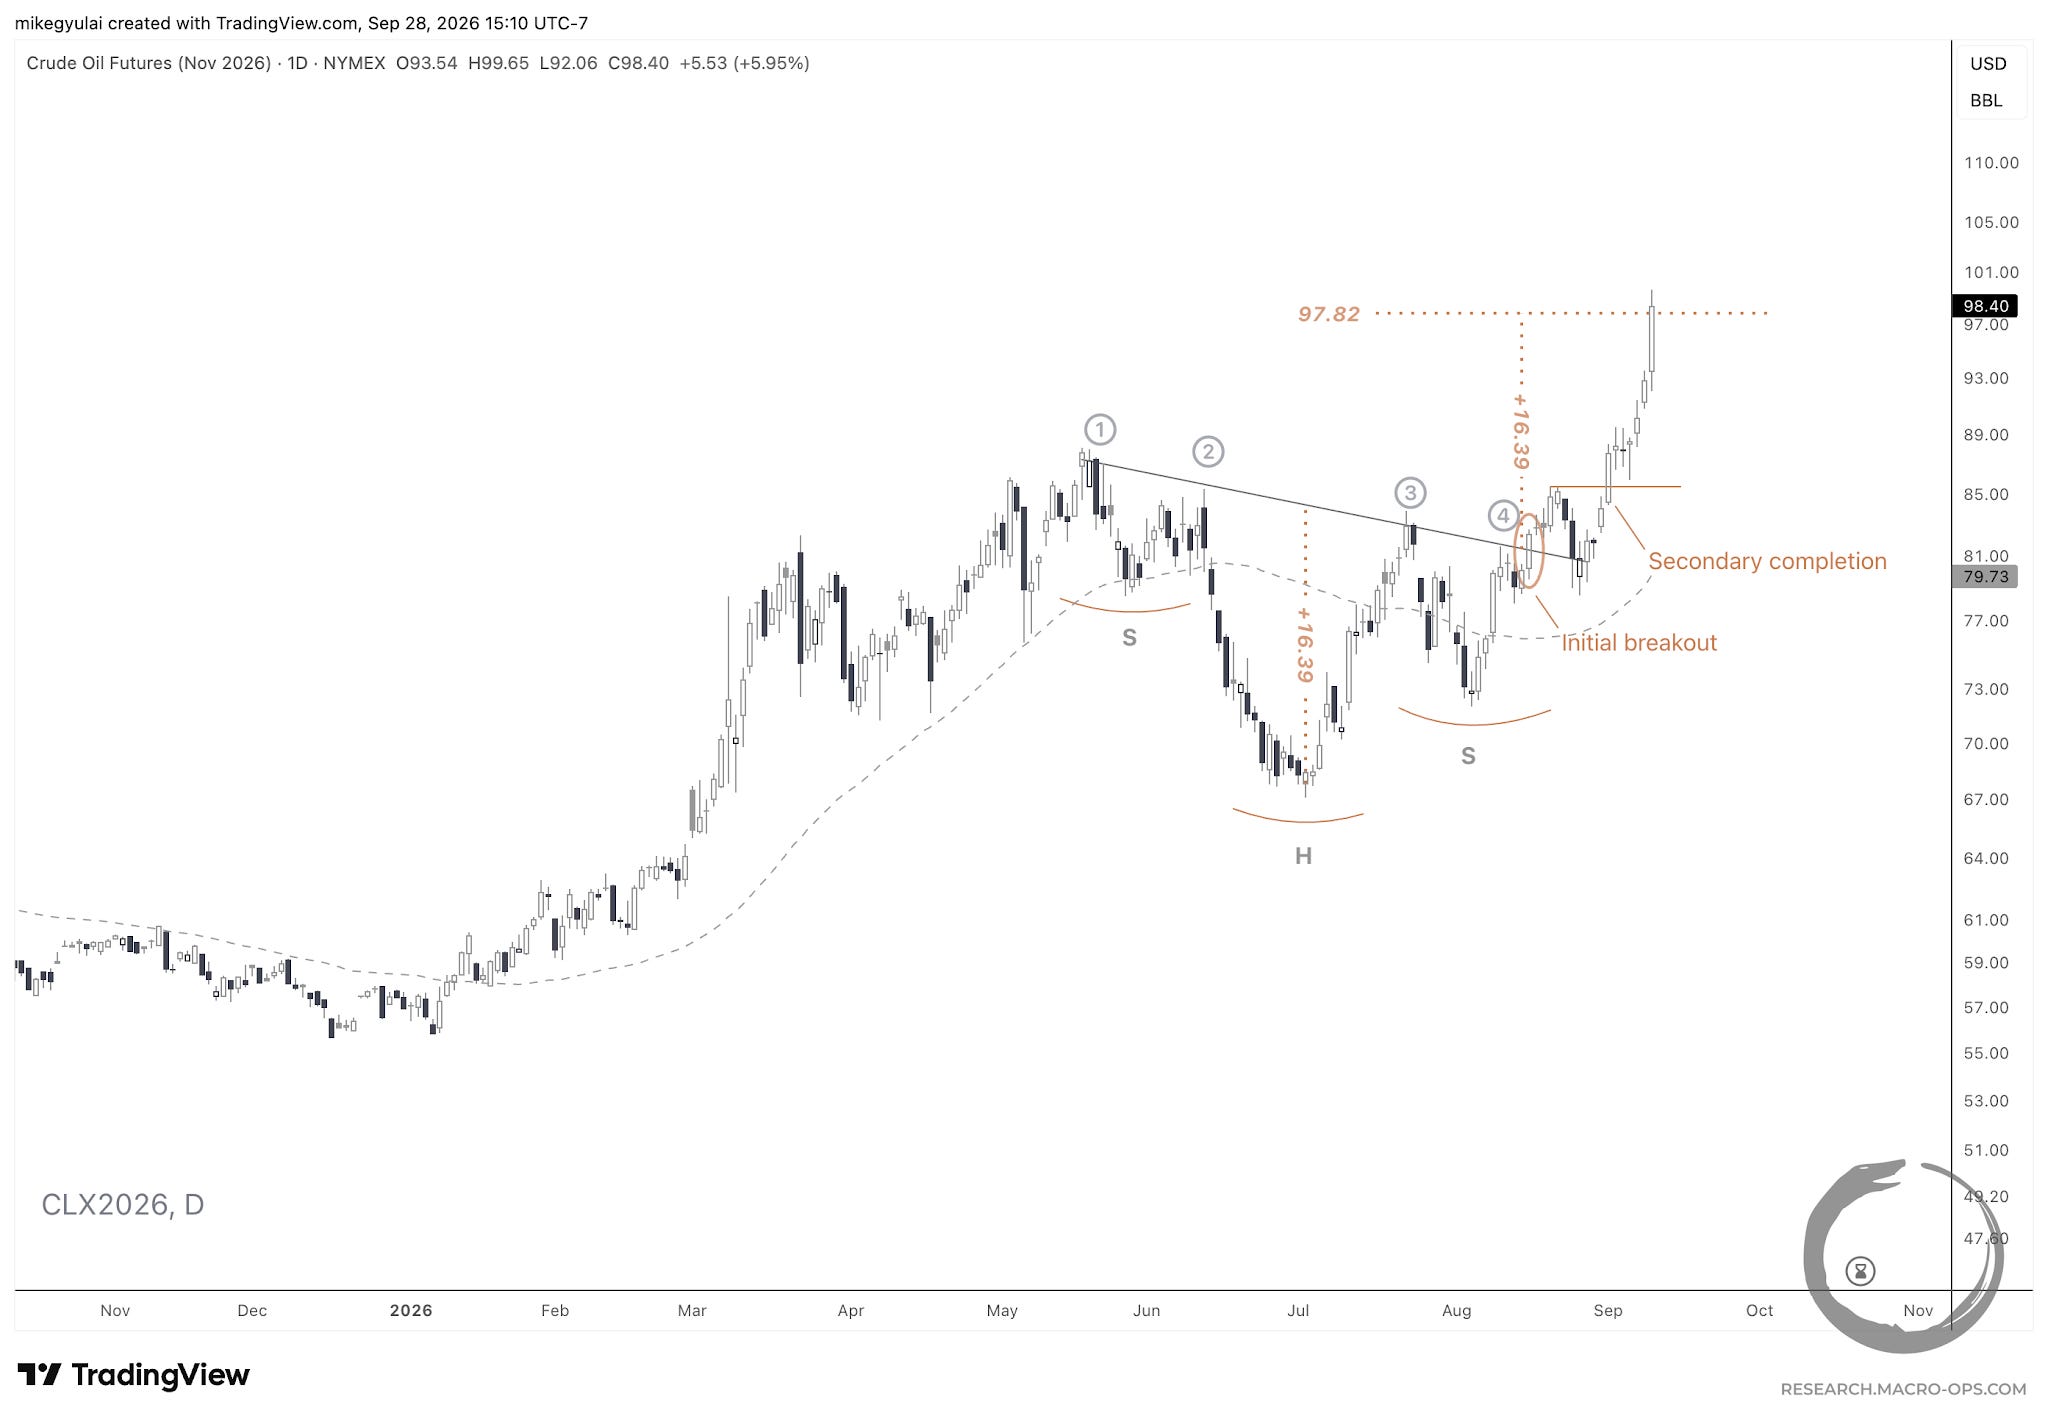
November crude oil broke out of a 3-month head-and-shoulders continuation on August 17, 2026, recompleting on September 1 after an initial pullback, and then reaching its 1x measured move target of 97.82 on September 10, 2026.
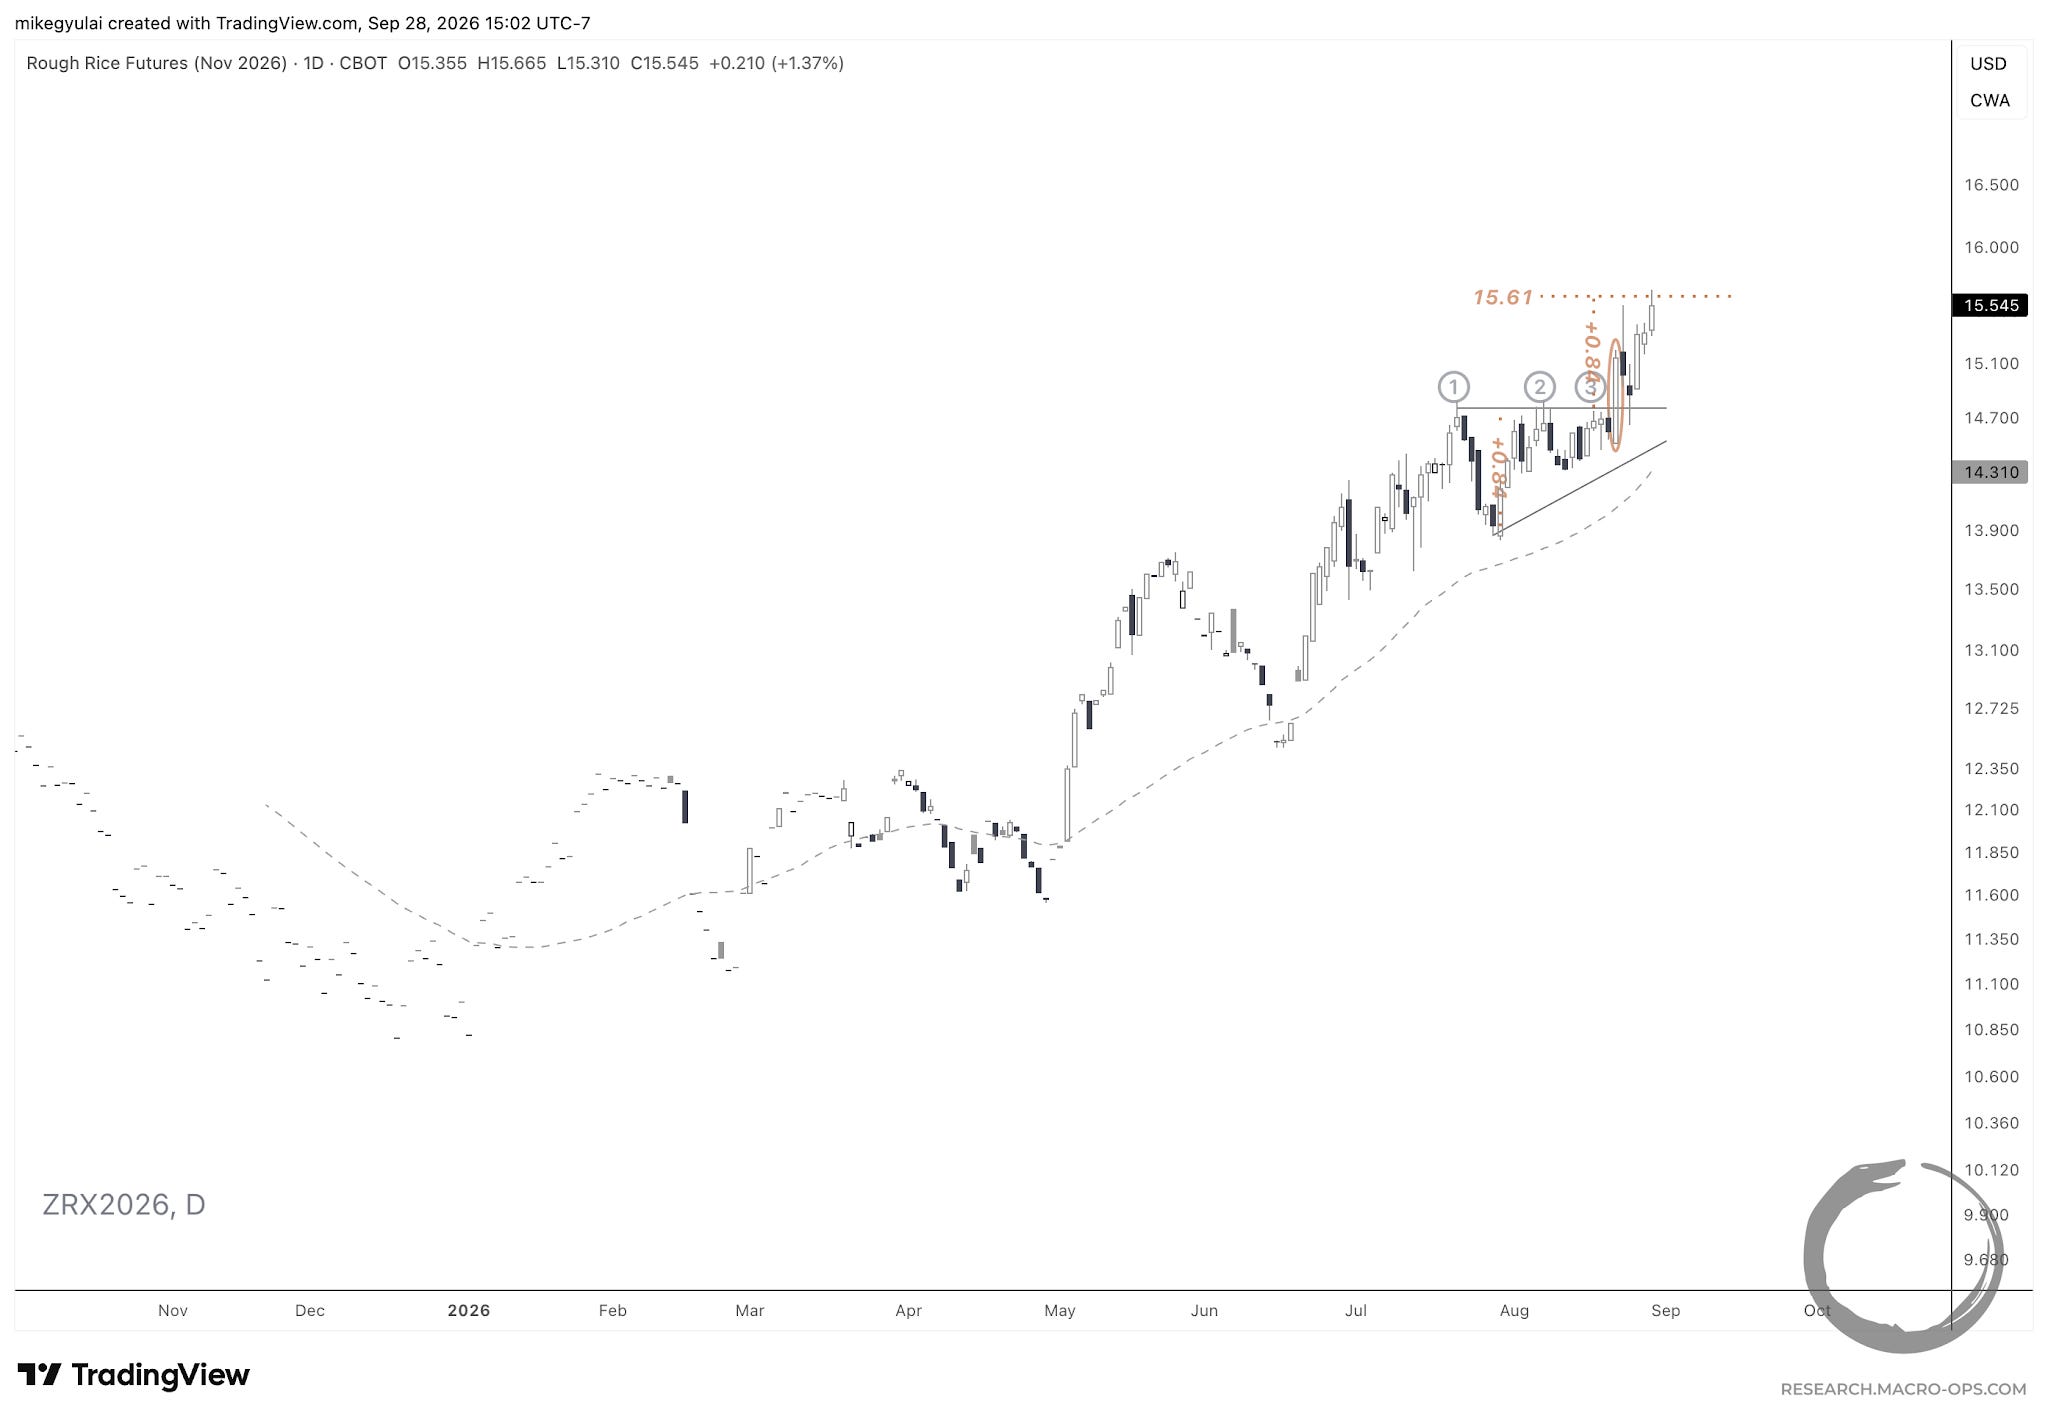
November rough rice broke out of a 1-month ascending triangle on August 21, 2026, reaching its 1x measured move target of 15.61 one week later on August 28, 2026.
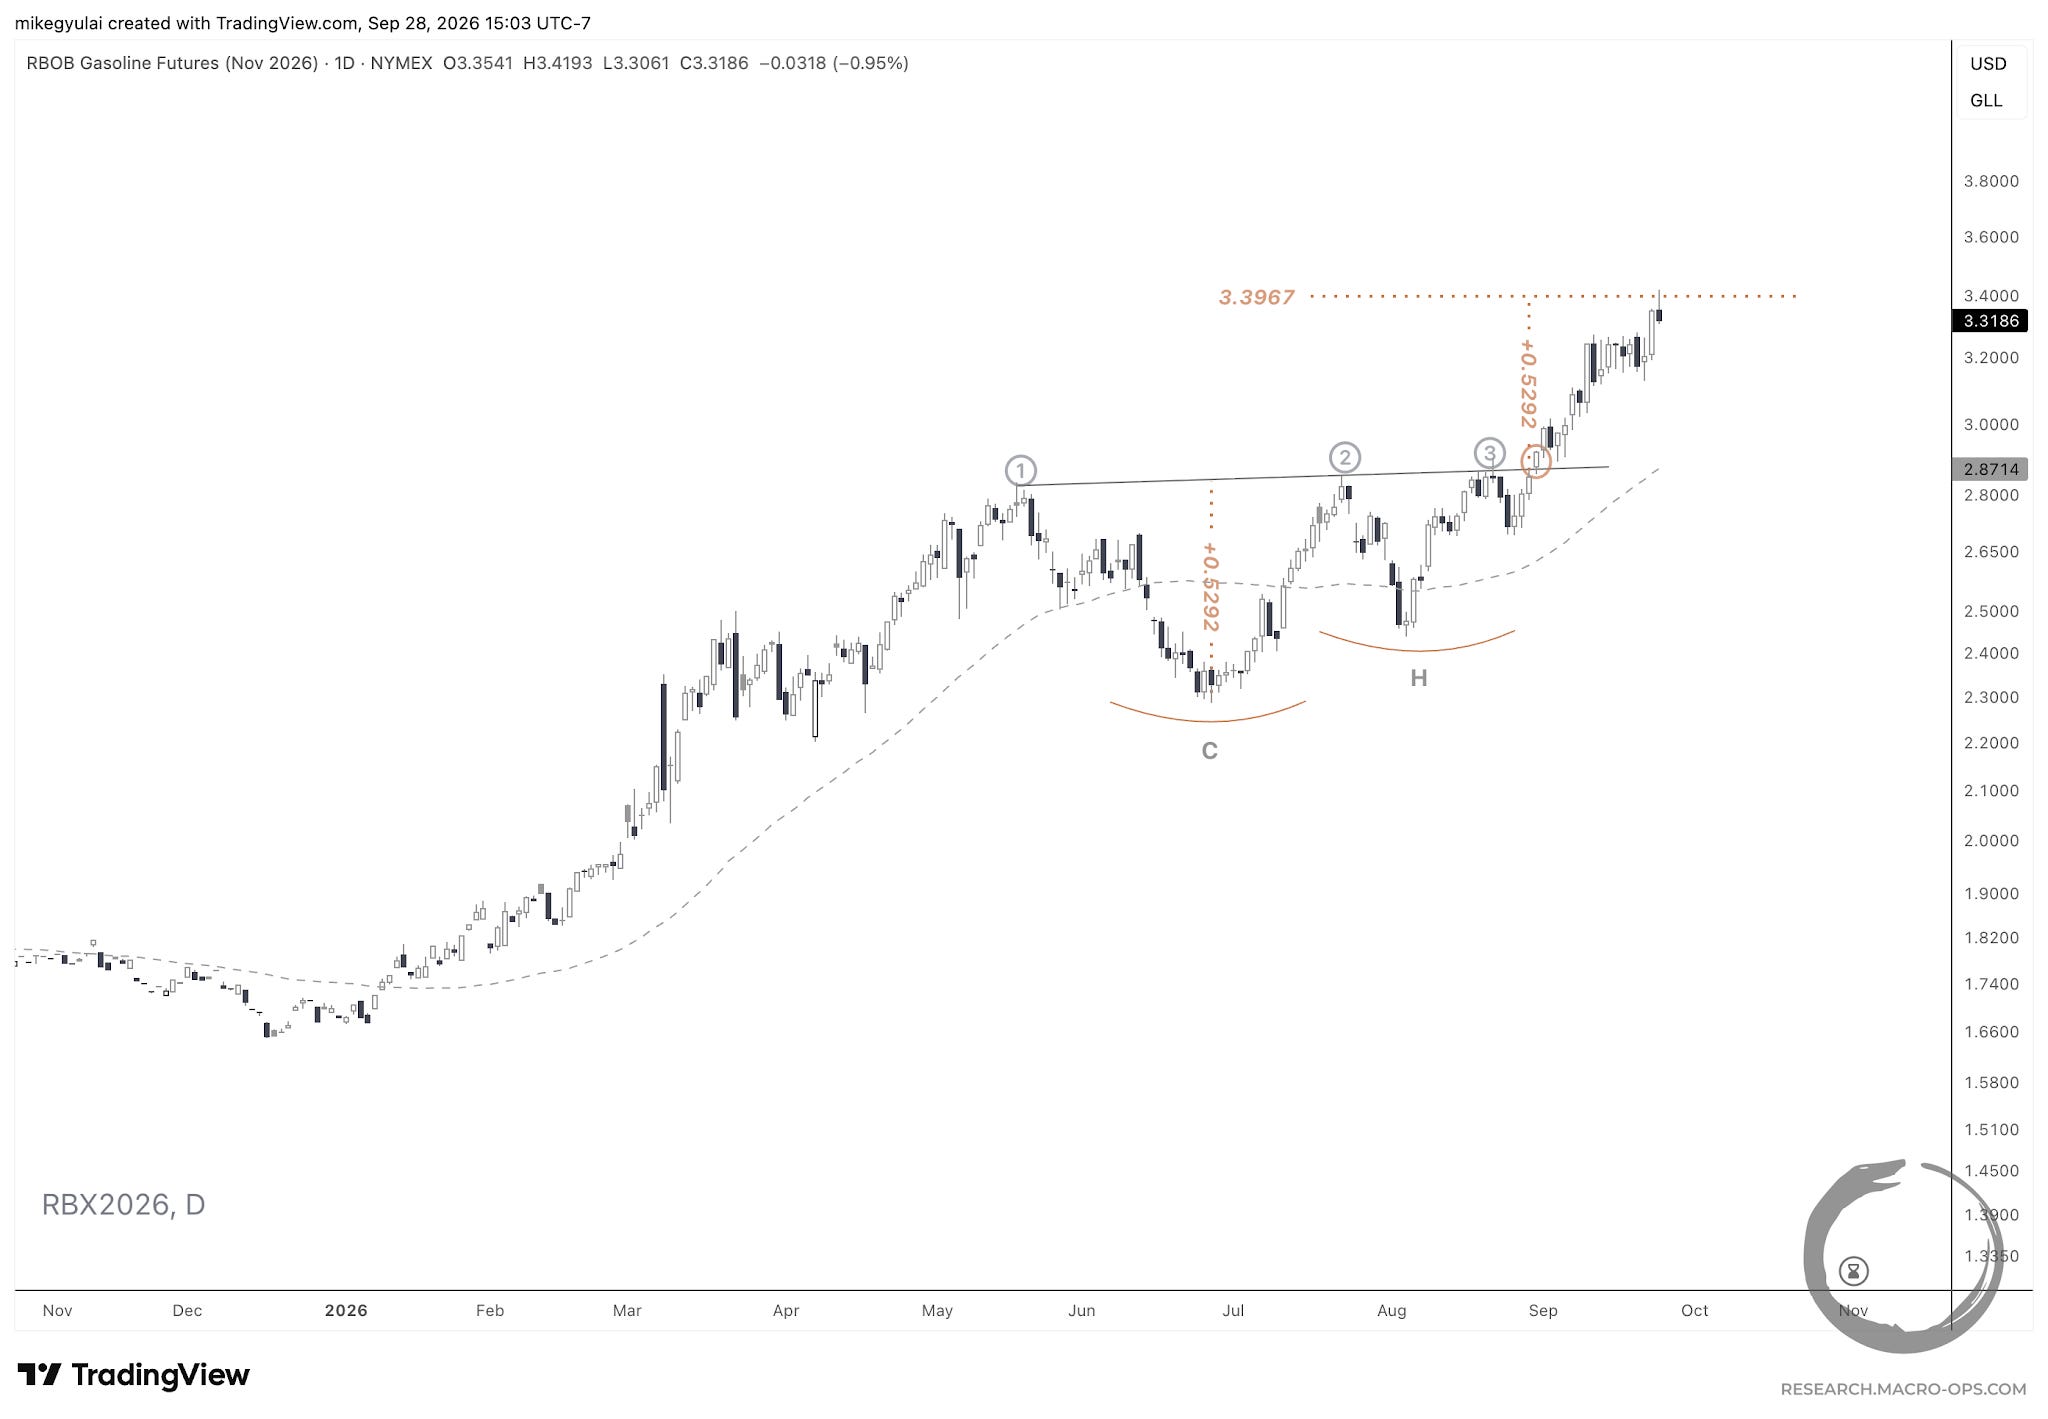
November RBOB gasoline broke out of a 3.5-month cup-and-handle on August 31, 2026, reaching its 1x measured move target of 3.3967 three and a half weeks later on September 24, 2026.
Every chart above was once a chart in progress. A triangle three-quarters built. A head-and-shoulders waiting on its right shoulder. That is the version you get every Saturday in my weekly report, This Infinite Game: the pattern before it resolves, the breakout level, the measured move targets.
The chart is the easy part. Tight stop or loose stop? Take the 1x or hold for the 2x? A 50% win rate at 2:1 or 35% at 4:1? Which of these setups earns a place in your system, and at what size?
Those answers don’t fit in a weekly report. They get worked out in dialogue, and that is what The Collective is: a room where you bring a pattern to me, to Alex, Brandon, Dean, and Tony, and to several hundred traders and investors, and work through how you’d trade it and how it fits a system you’d run with your own money. Alongside Alex’s macro positioning, Brandon’s deep value work, Dean’s quantitative models, Tony’s volatility read, and our futures alerts with entries, adds, and stops. The research is only half the edge. The room is the other.
One more thing. As some of you know, the MO team recently joined an established asset management firm to manage capital utilizing the Macro Ops investment process—if you are a qualified purchaser (please see attached description) and are interested in learning more, please let us know.
We’re also relaunching Macro Ops in November with a new brand, website, and an interactive quantitative dashboard built on our models and proprietary historical datasets. Existing members will be grandfathered in at their current rates.
With these improvements, Collective pricing roughly doubles at the relaunch to preserve the size and quality of the room. This week’s enrollment is likely the last chance to lock in current pricing. If you’ve been on the fence, this is the week to find out if it’s a fit.