


Summary: The lockout rally continues. Qs blew through the upper bound of their megaphone pattern and have now put in six consecutive weekly bull bars — firm evidence of a demand/supply imbalance that historically leads to further continuation. That said, breadth remains narrow and credit markets are still flashing yellow. If the divergence holds, the odds of a cyclical top rise materially. Retail flows and equity allocation are at multi-year extremes, signaling the narrative pendulum is swinging toward max bullishness. We close with a coffee short setting up for a major change of trend.
MO Portfolio & Trades
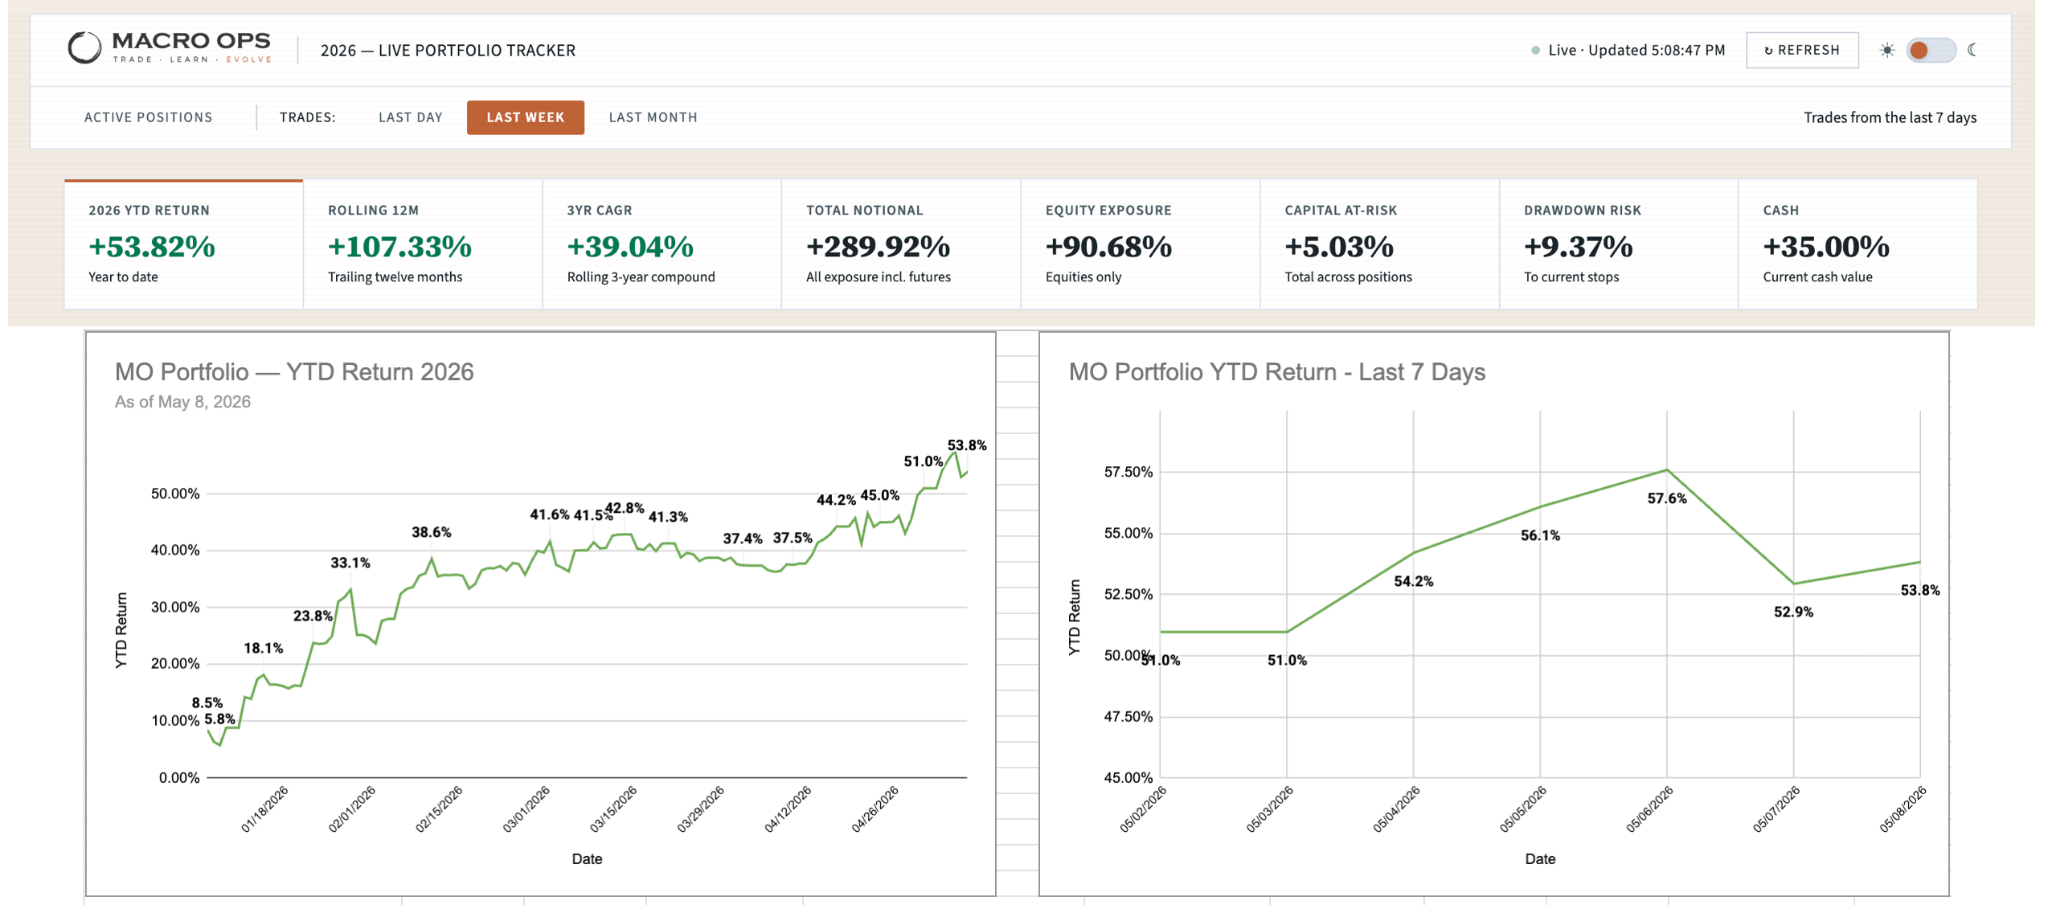
1. Portfolio rose +288bps last week, sitting at +53.8% YTD.
Core book: long AI and semi plays, long RTY, long BTC, short SOLUSD, short DAX, long silver, long BBG Commodities ETF, long KC HR Wheat, long Dec Brent, long RBOB Dec gas, long 2y USTs, long lithium and RE miners, plus a couple idiosyncratic equity names.
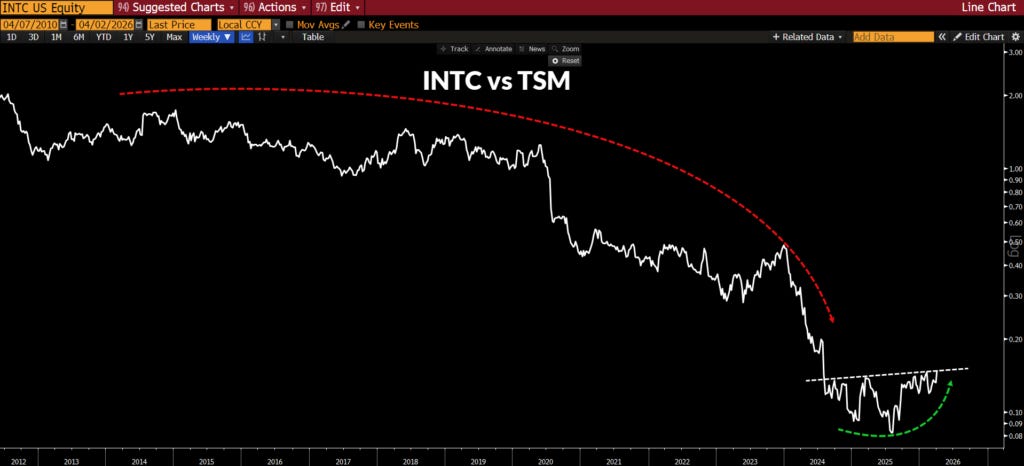
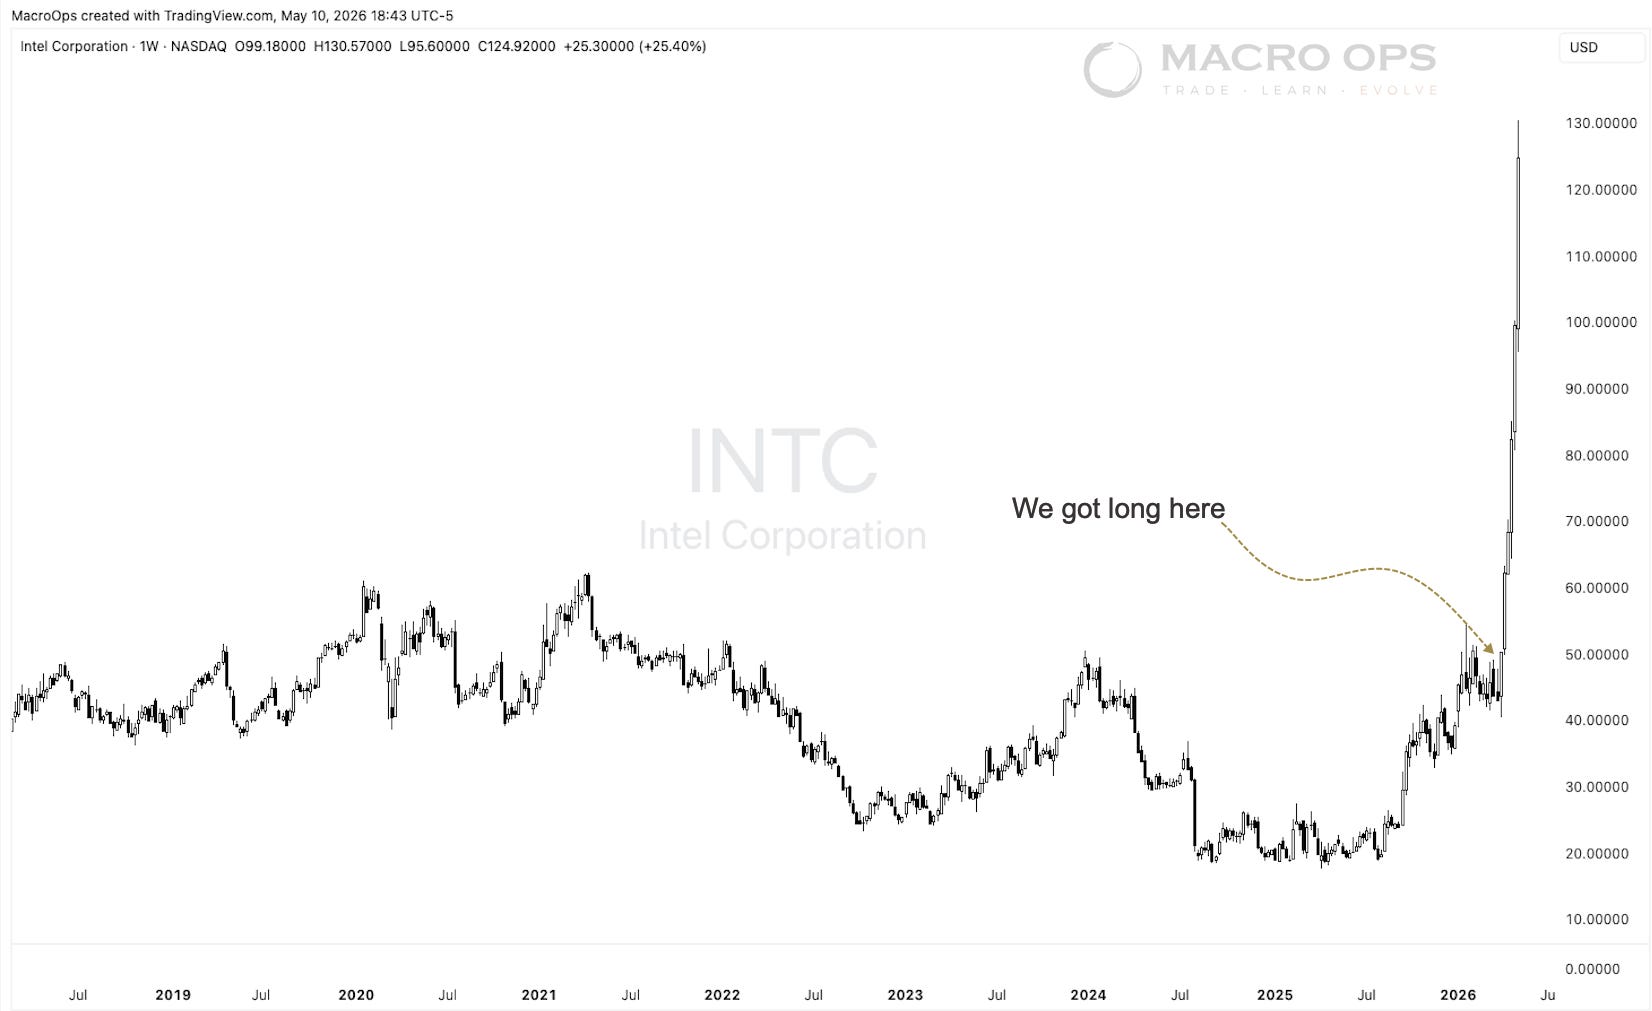
2. Back at the start of April (link here) we flagged the long setup in Intel Corp (INTC):
“Adding a small starter long in INTC here. INTC’s value as an indispensable strategic asset is going to become more self-evident as markets wake up to the fact that the global order is dead and Taiwan is not in our sphere of influence…”
3. INTC has shot up 165% since. We’ve taken partial profits on the way up and are trailing a tight stop on the remainder.
Trifecta Charts
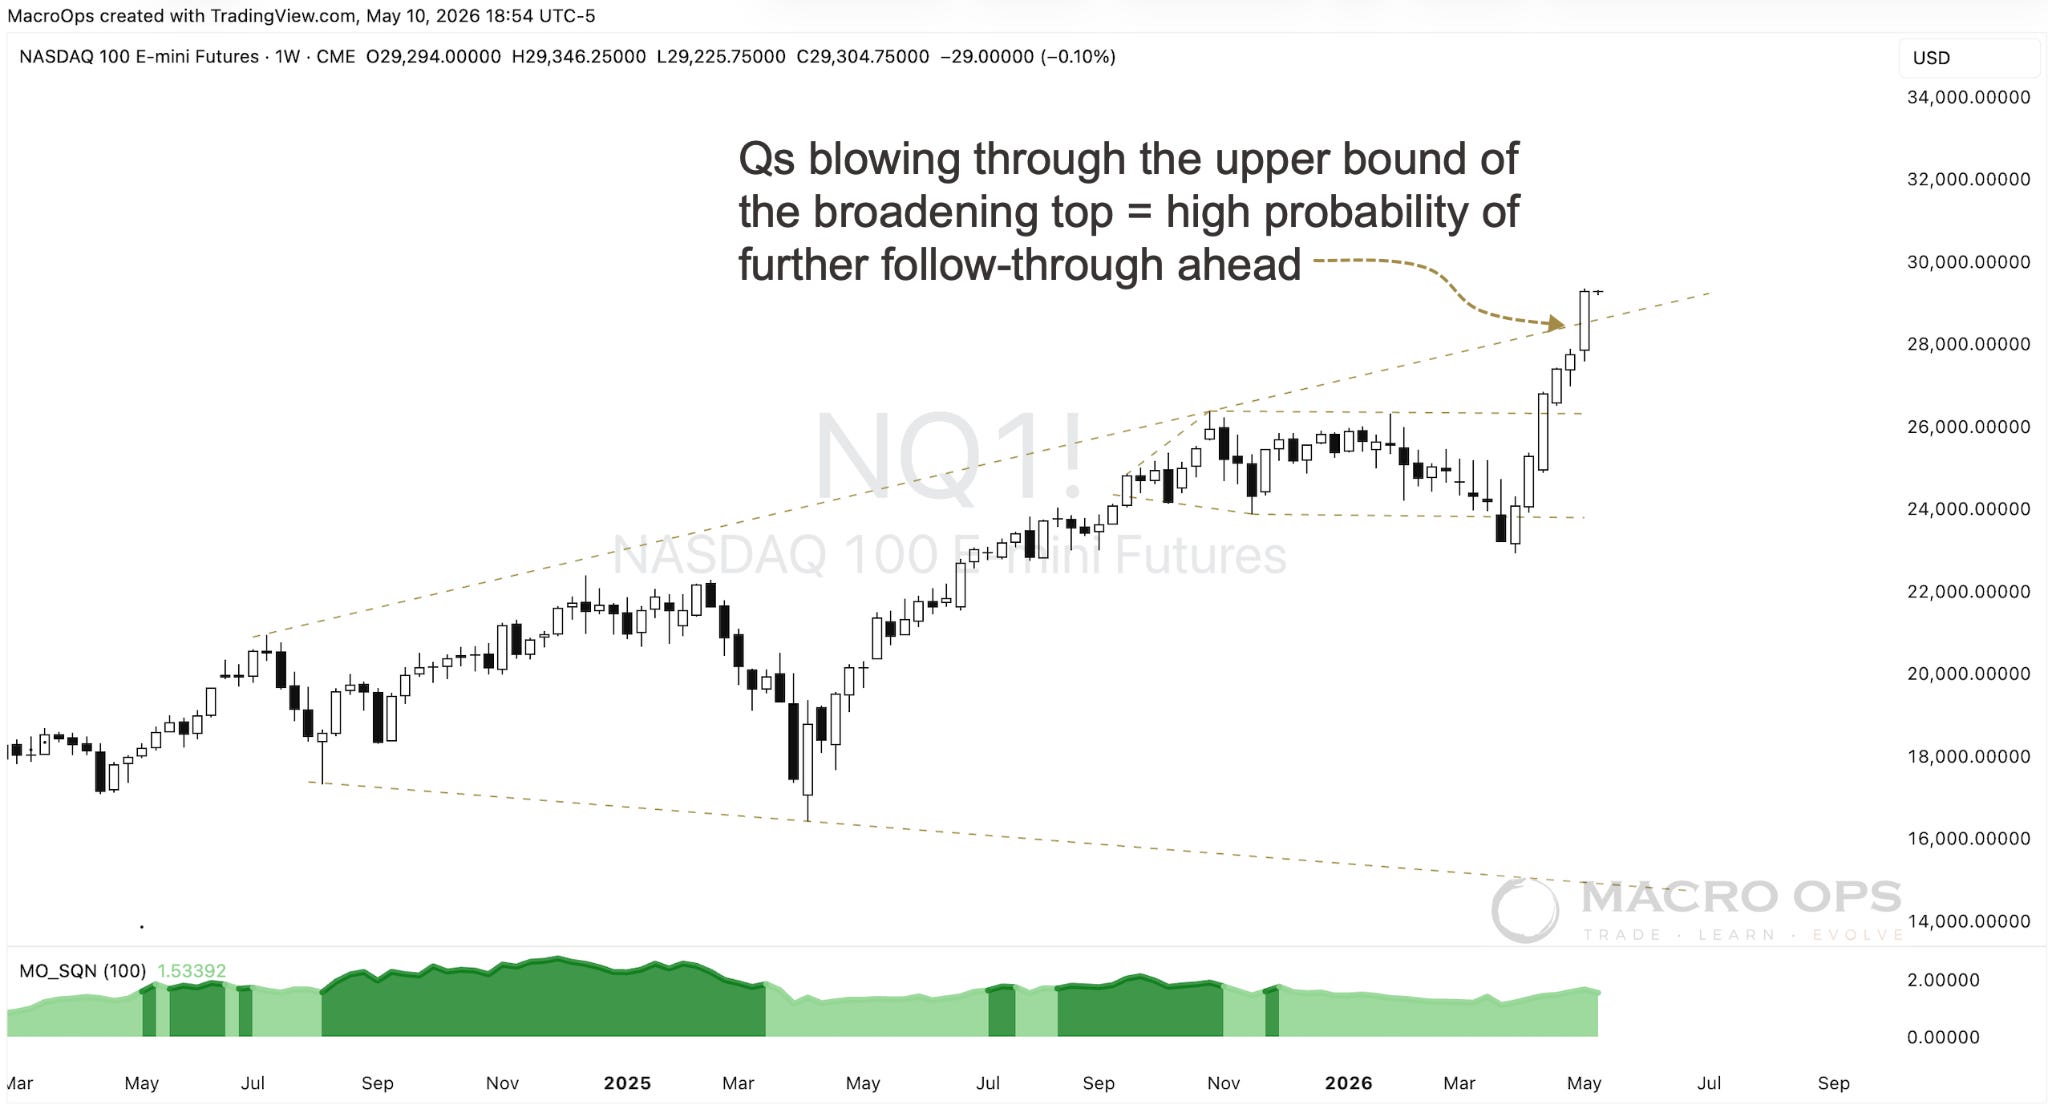
4. Our base case for the past month was that Qs would run quickly to the upper level of their broadening top in a lockout rally. Not only did that play out — they punched through the upper bound entirely last week. Six consecutive weekly bull bars. That kind of price action signals a large demand/supply imbalance and historically leads to further trend continuation.
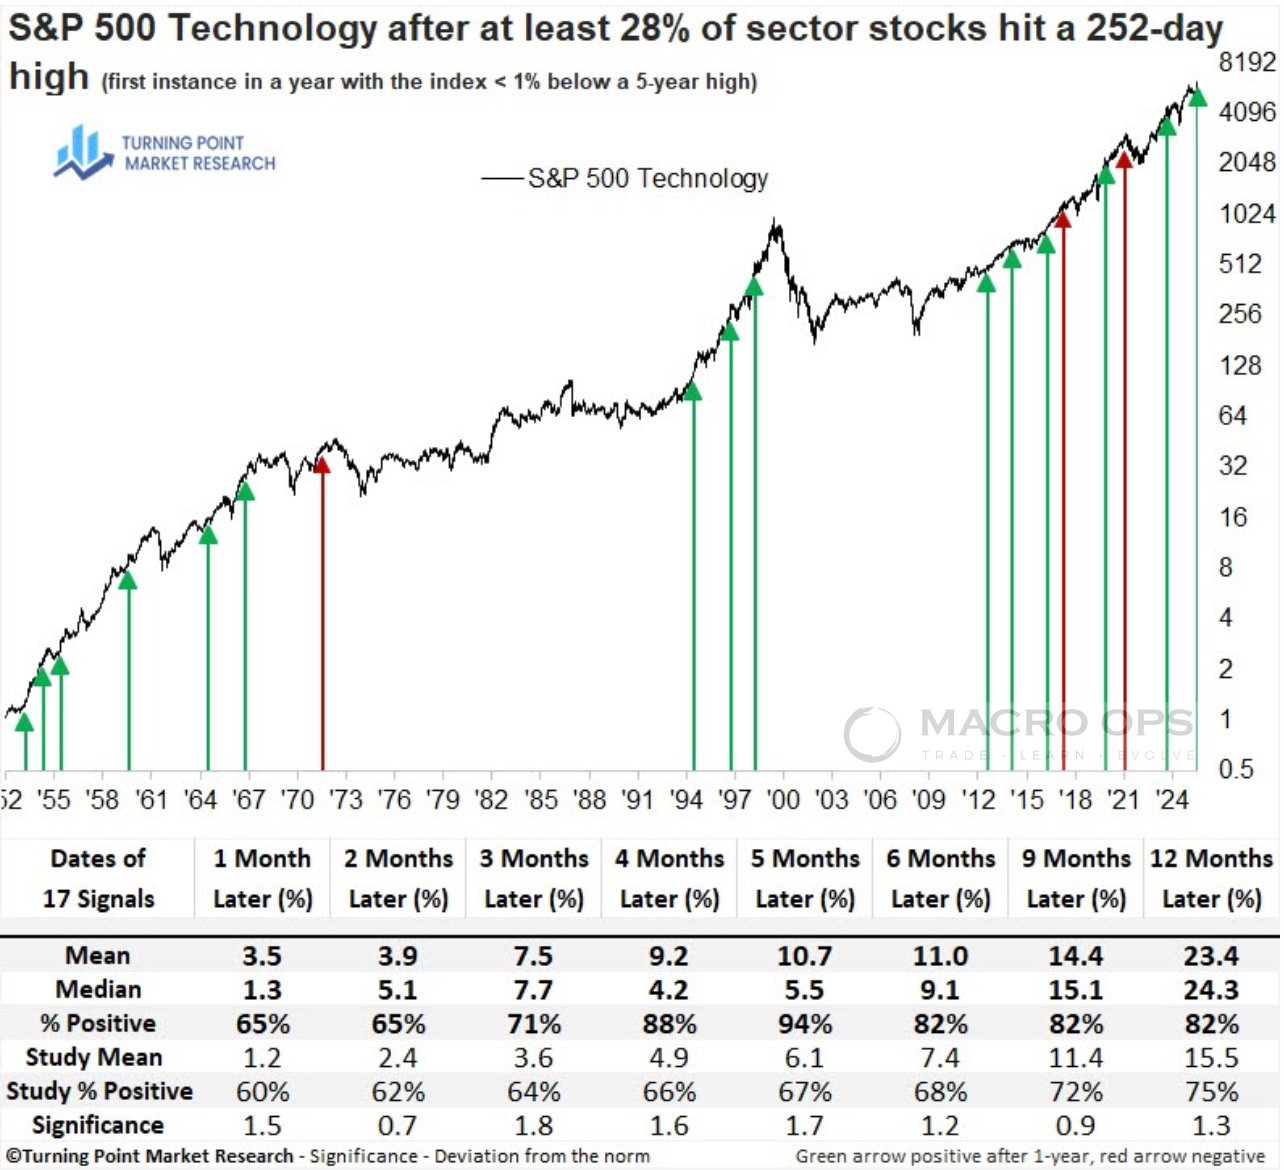
5. Our friend Dean at TPMR made a similar point recently: “On Thursday, we noted a sharp expansion in 252-day highs among technology sector stocks — the strongest reading since 2024. Historically, when similar signals have emerged near market highs like today, subsequent returns and win rates for the sector have been exceptionally strong.”
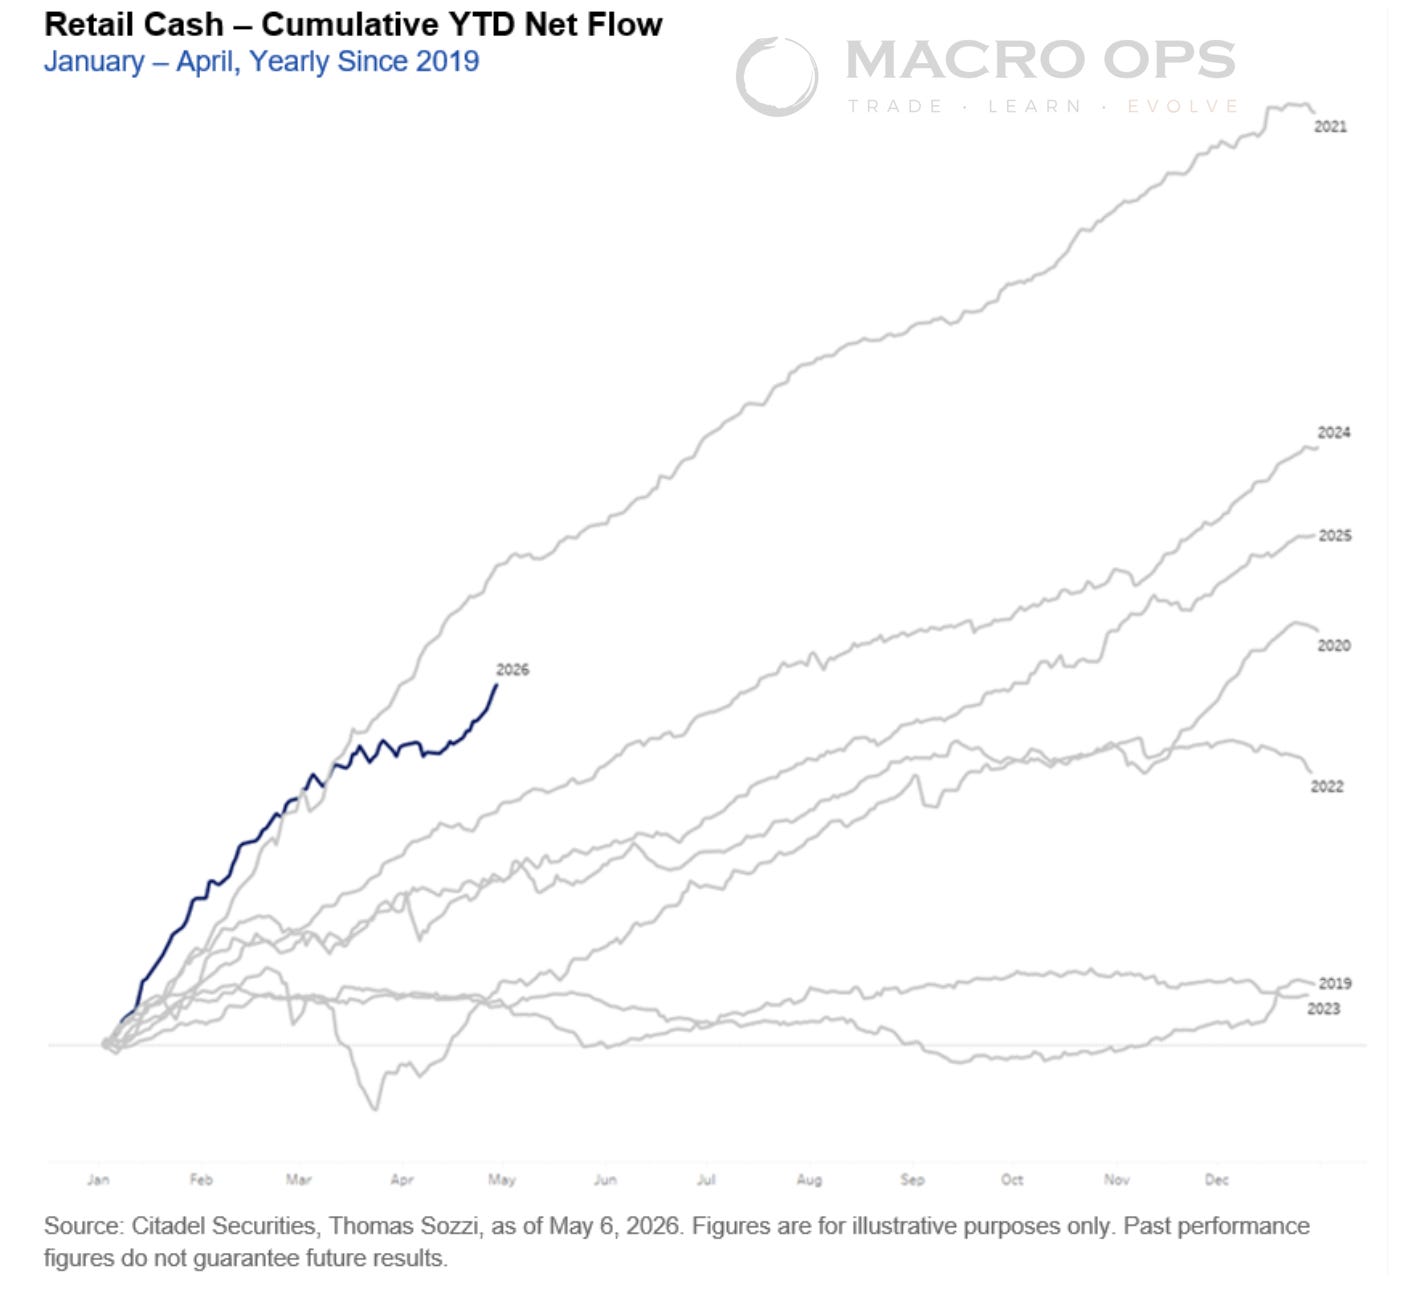
6. The rally is also bringing a marked acceleration in sentiment and retail flows. From Citadel: “Net buying on our platform last week alone was in the 98th percentile of weekly flows since 2019. Monthly net flows for April clocked in at the 87th percentile of monthly activity since 2019.”
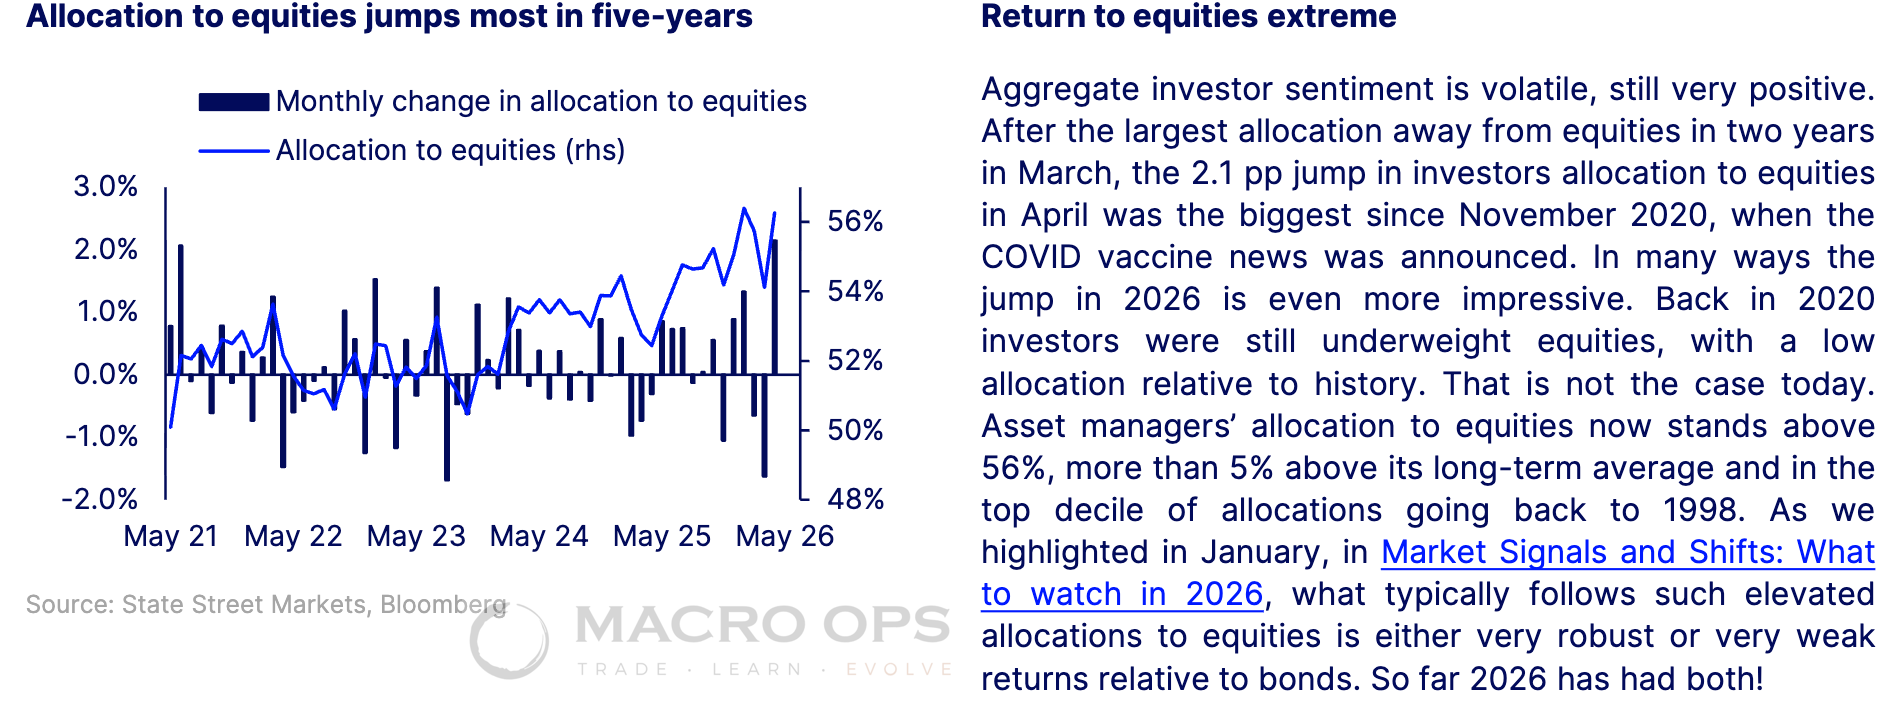
7. Equity allocation just hit its highest level in five years. April marked the biggest monthly shift since November 2020, per StateStreet.
Macro
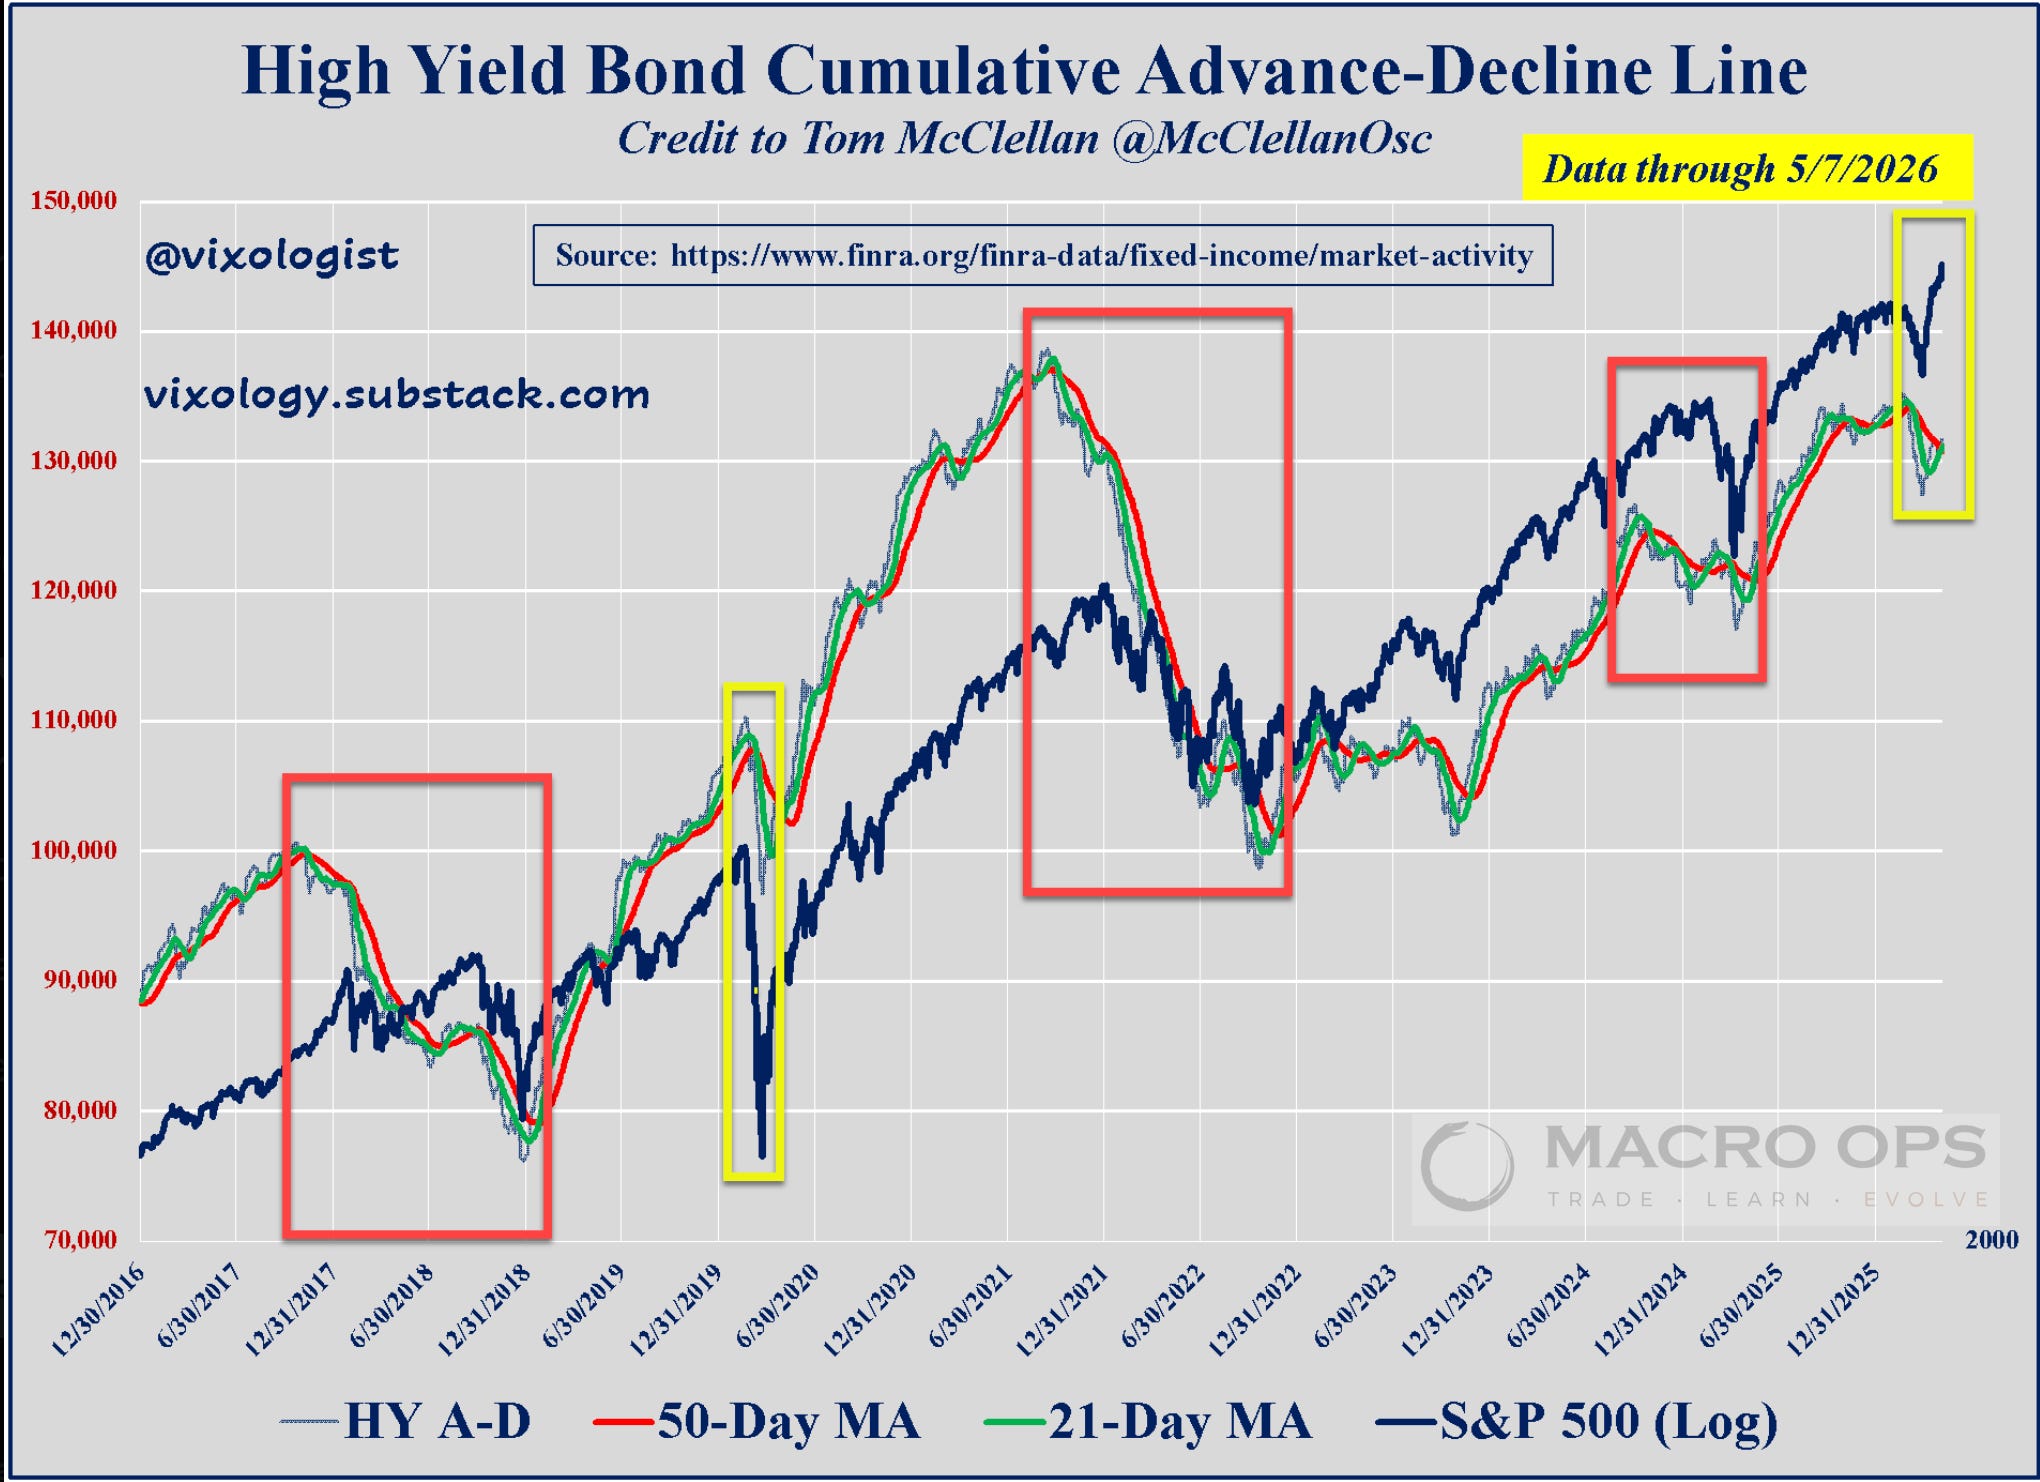
8. Last week we flagged the negative divergence in LQD/IEF — one of our preferred market internals. It’s still diverging. Lead times tend to be long and we haven’t hit danger levels yet. A complementary view comes from Jim Carroll’s High Yield Bond Cumulative A-D line (link here). If this divergence continues, the odds of a cyclical top rise dramatically.
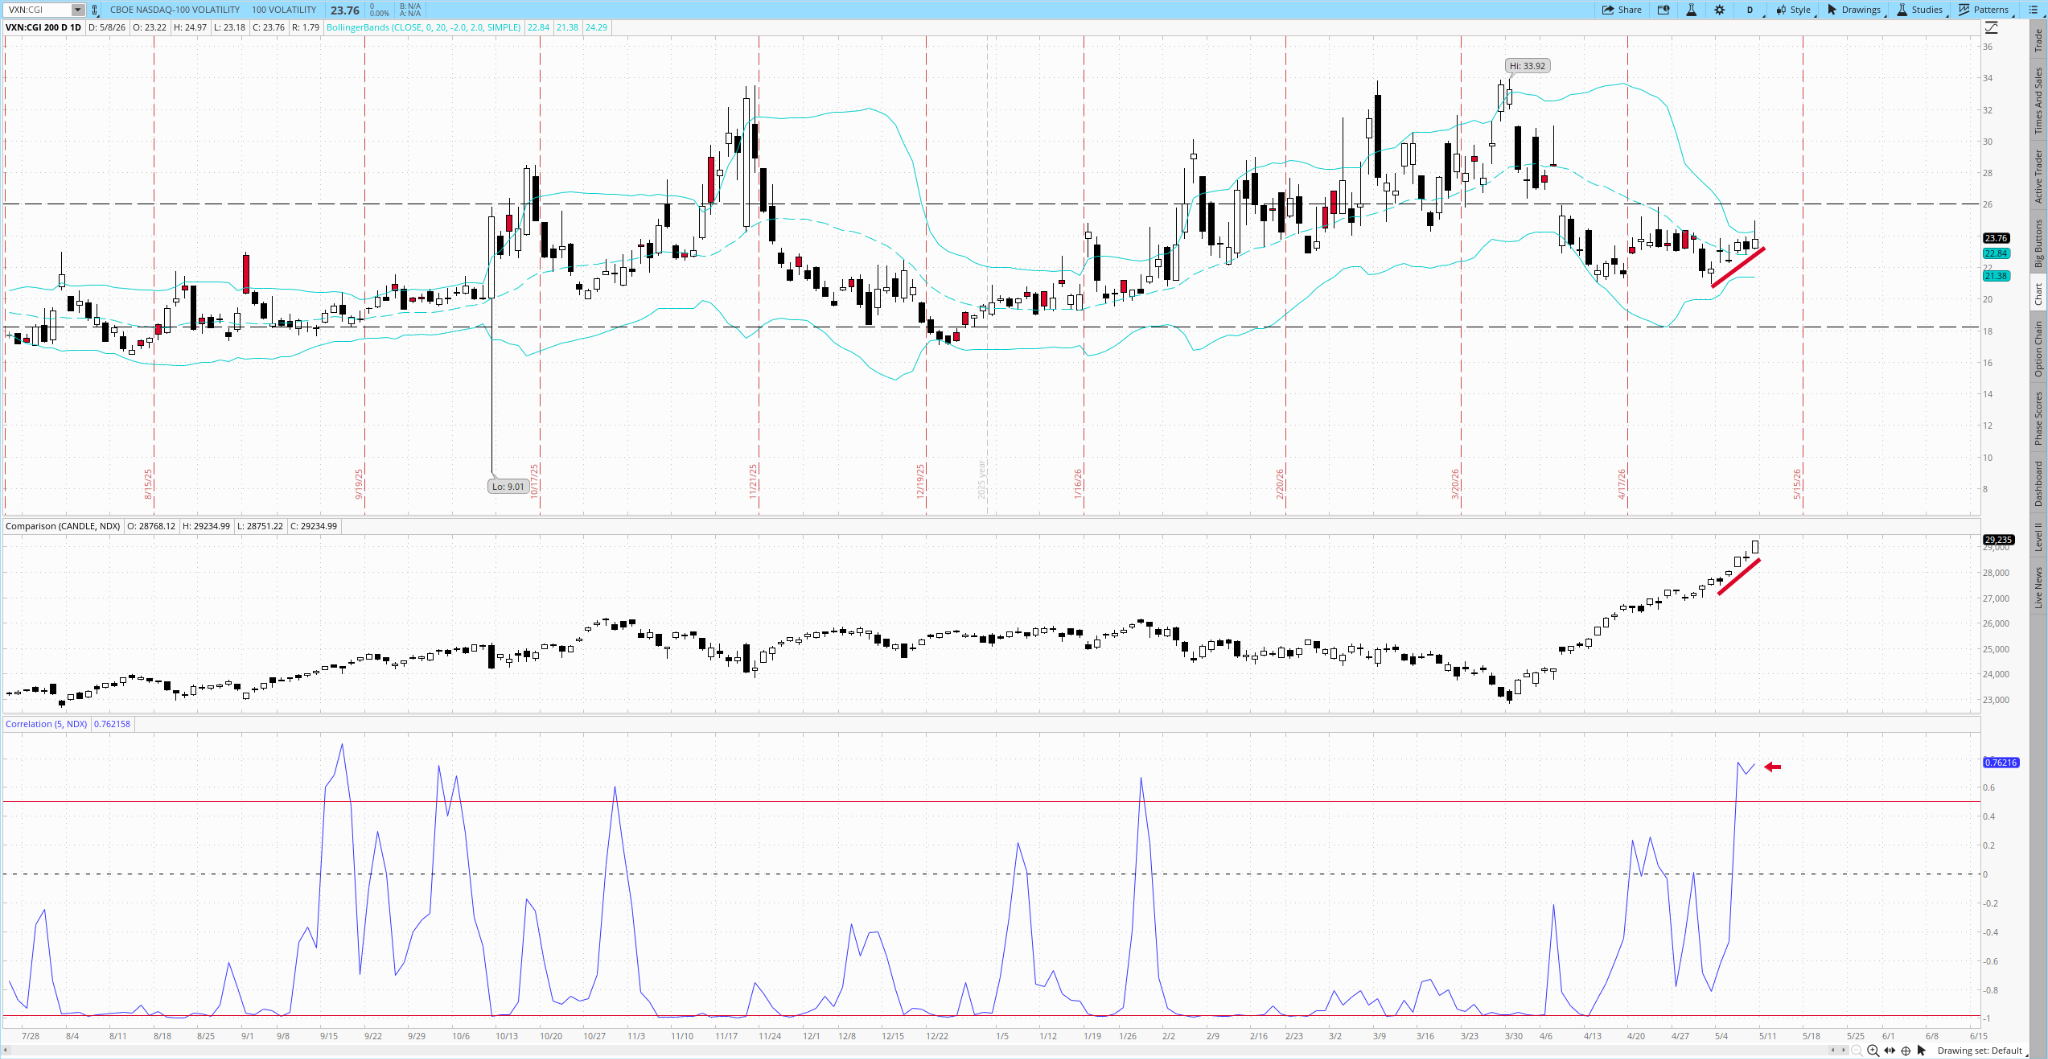
9. Tony, our resident vol expert, digs into the Nasdaq-VXN correlation hitting an extreme (market up, vol up) — and much more — in his latest Vol Street Journal.
Trade Setups / Topical Charts
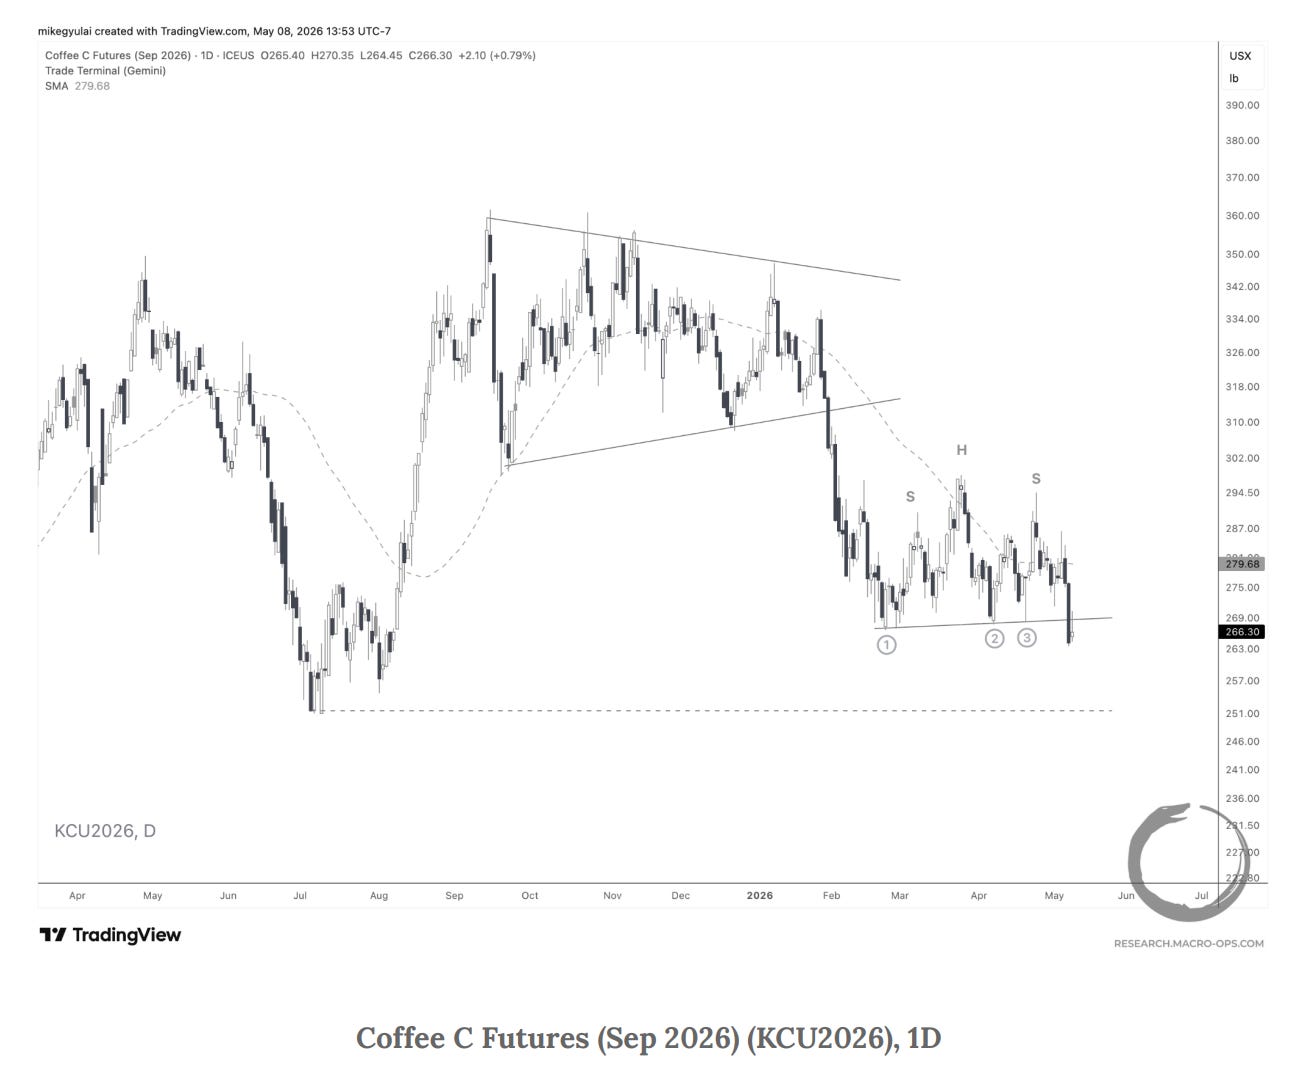
10. Our lead Technical Analyst Mike G highlighted Coffee’s recent completion of a H&S continuation pattern in his must read weekly (link here).
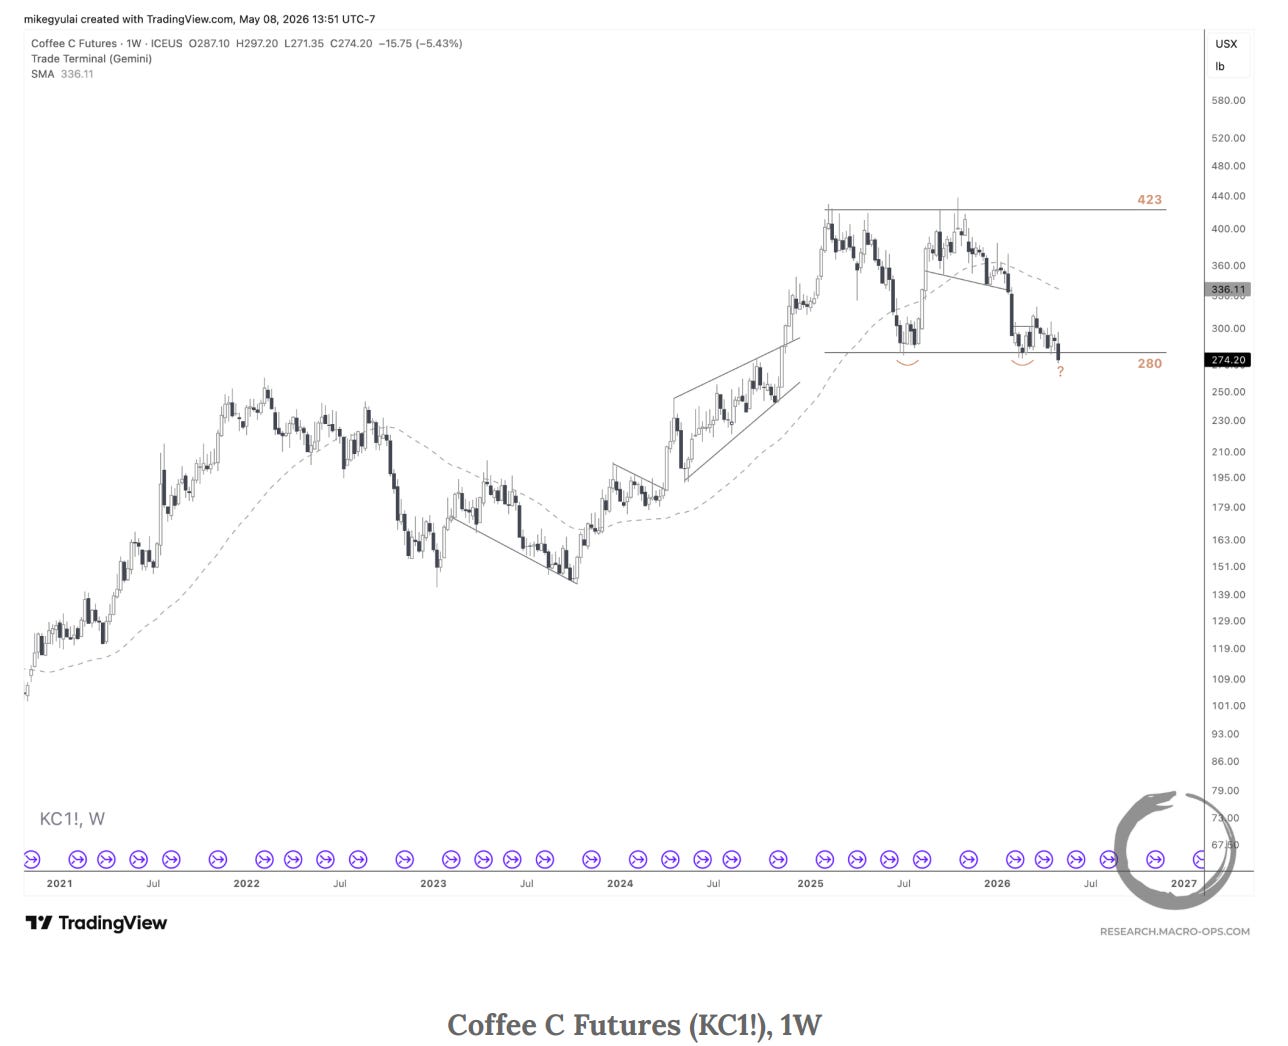
11. Zooming out to the weekly, you can see the larger breakdown at work. If this holds, it marks a significant change of trend — and a clean entry to get short.
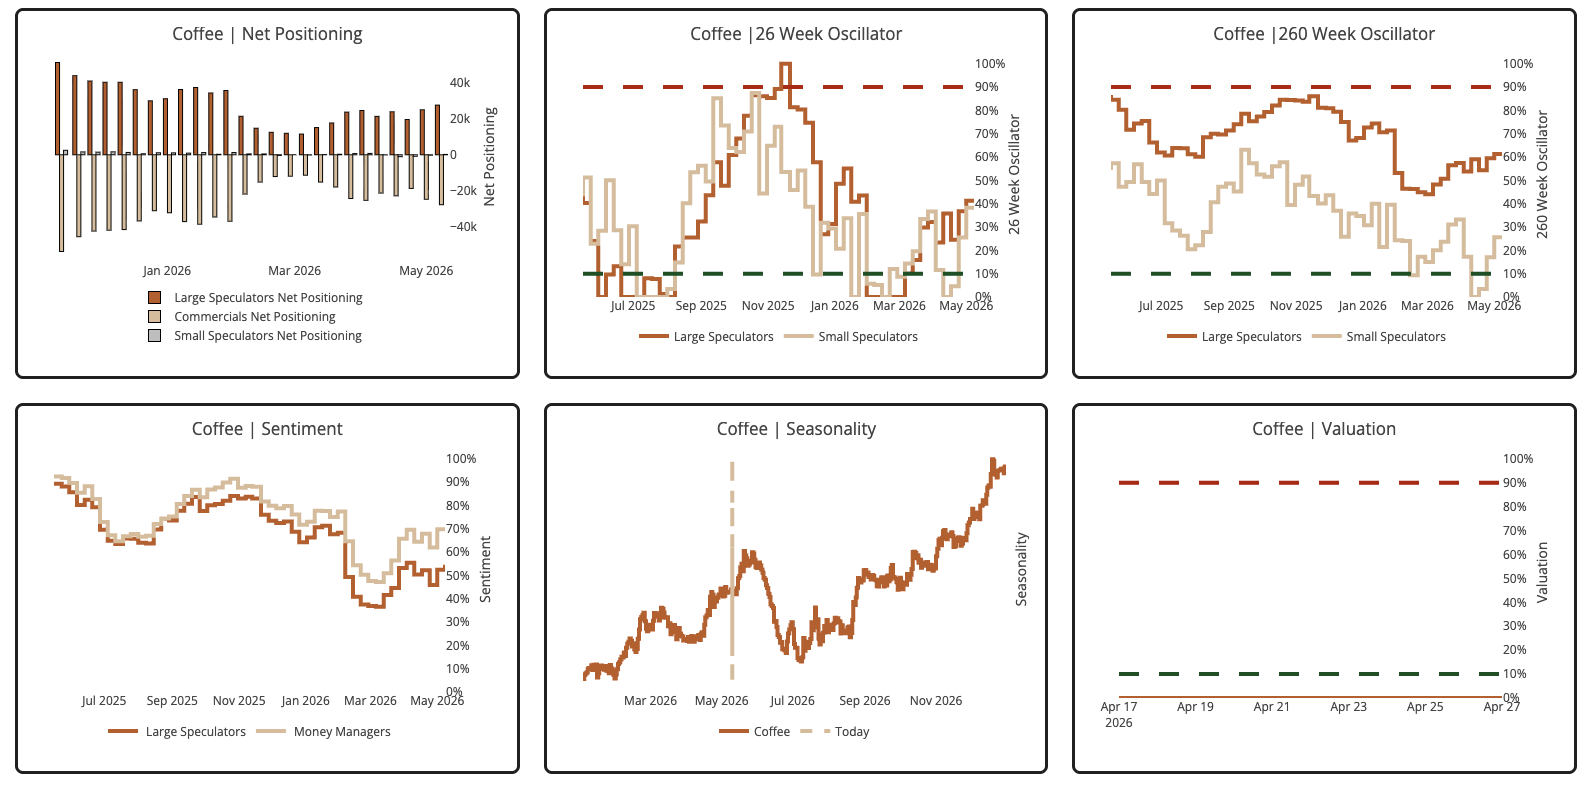
12. Positioning and sentiment are neutral. Coffee enters its most bearish seasonal window in two weeks.
Thanks for reading.
Your Macro Operator,
Alex