

RISING STAGFLATION ODDS…
The market gave us a bottom. Now it needs to prove it wasn't a trap.

Summary: We nailed the market bottom in risk assets two weeks ago. We’ve upped our risk slightly — but the base case hasn’t changed. We’re in a sideways chop-and-vol environment for the next six months or so. Falling TL Score, absent breadth thrusts, poor liquidity, rising inflation, and falling growth — layered on top of elevated valuations and a volatile geopol backdrop — all point to poor forward returns for equities. This is a tactical trading environment. Do little, or play uncorrelated markets. We also cover the bearish USD case, a bullish cocoa setup, the AI juggernaut trade, and more.
MO Portfolio & Trades
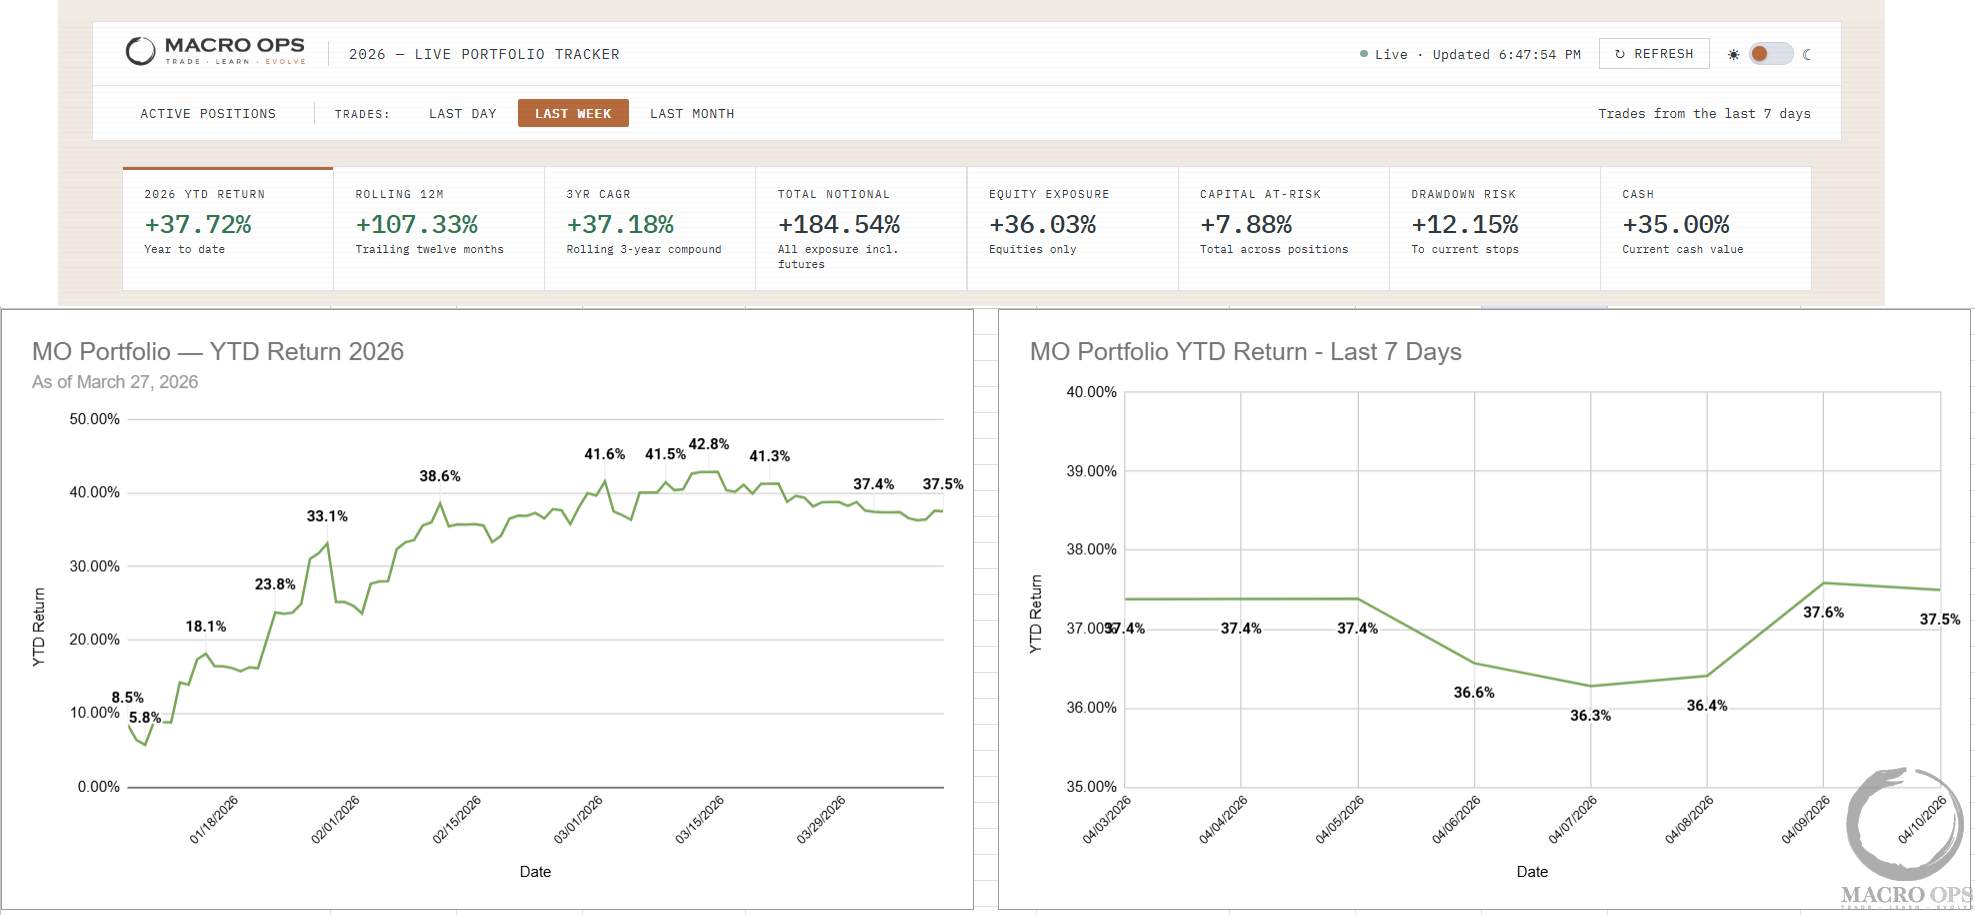
1. Portfolio rose 10bps on the week, sitting at +37.5% YTD. This is a wait-and-see market — and we need to do more of nothing.
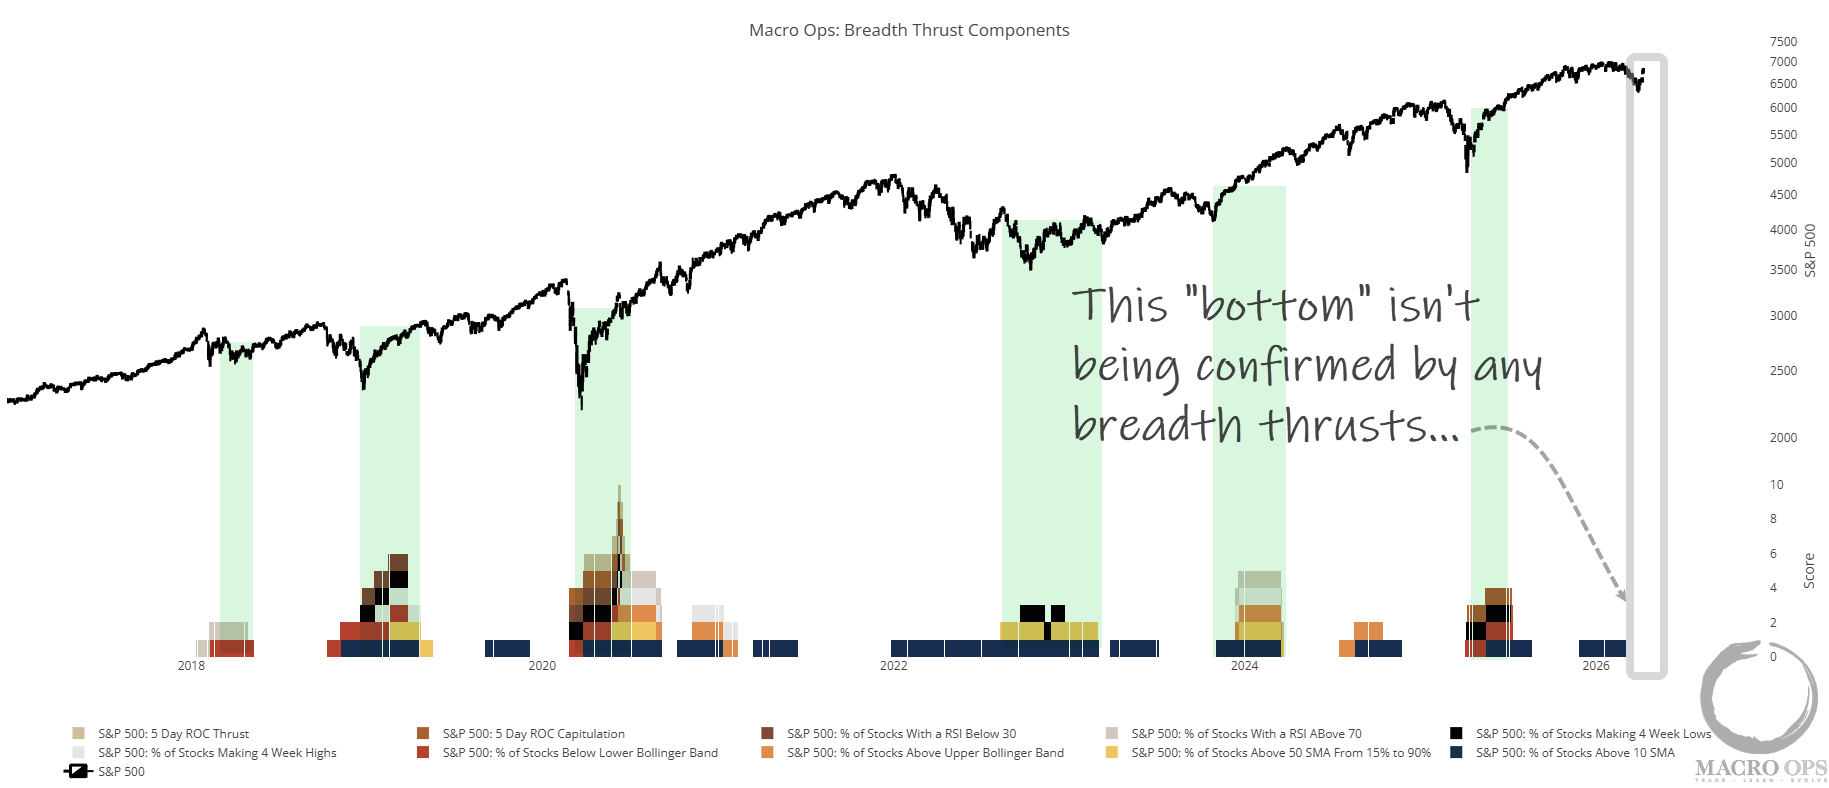
Still running high cash. Core book: long RTY, long silver, long gold miners, long BBG Commodities ETF, long Dec Brent, long 2y USTs, plus a couple idiosyncratic equity names.
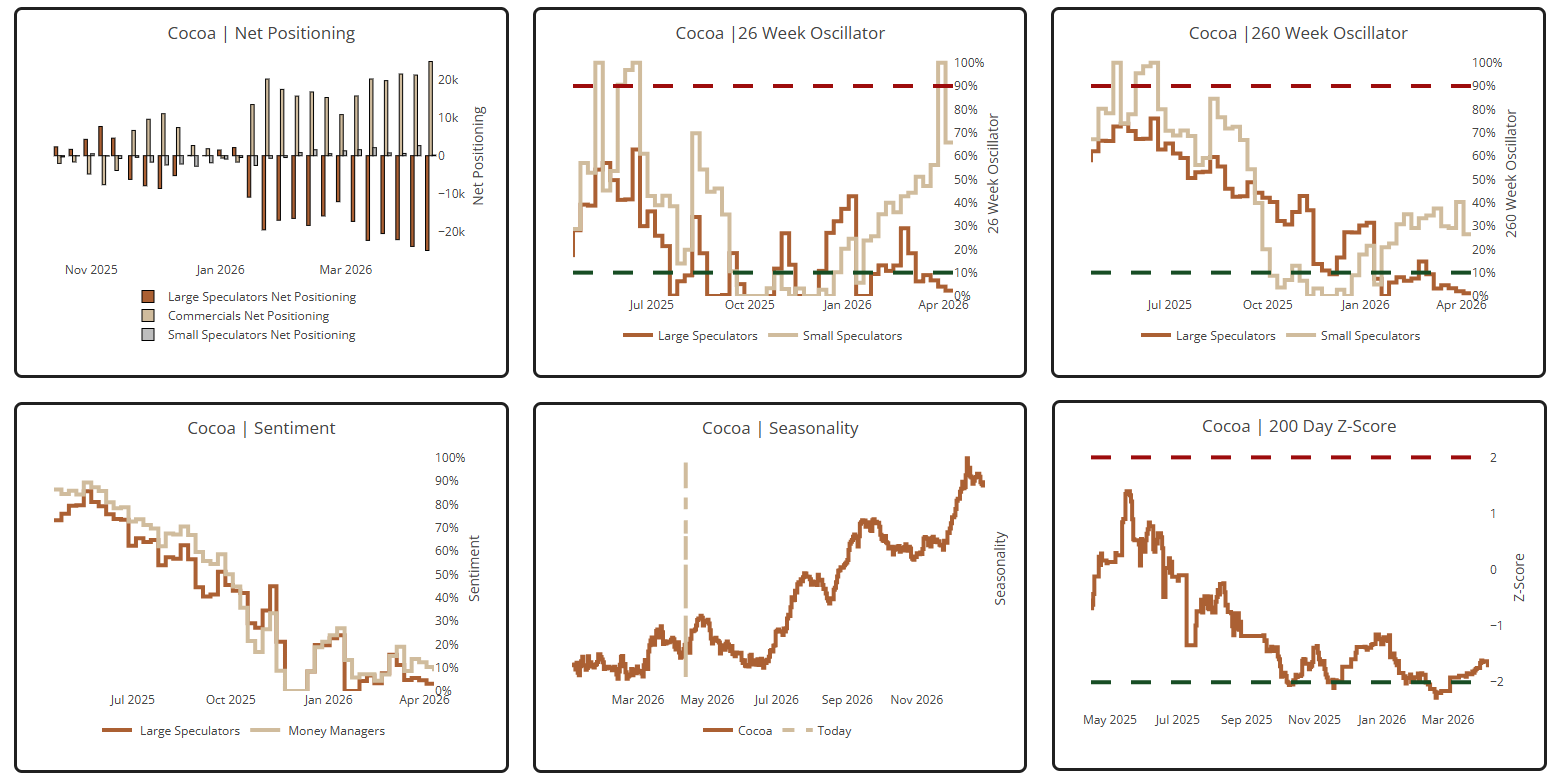
2. We have a starter long in cocoa. It’s setting up in a tight compression following a deep Bear Volatility regime SQN reading — which tends to mark bottoms.
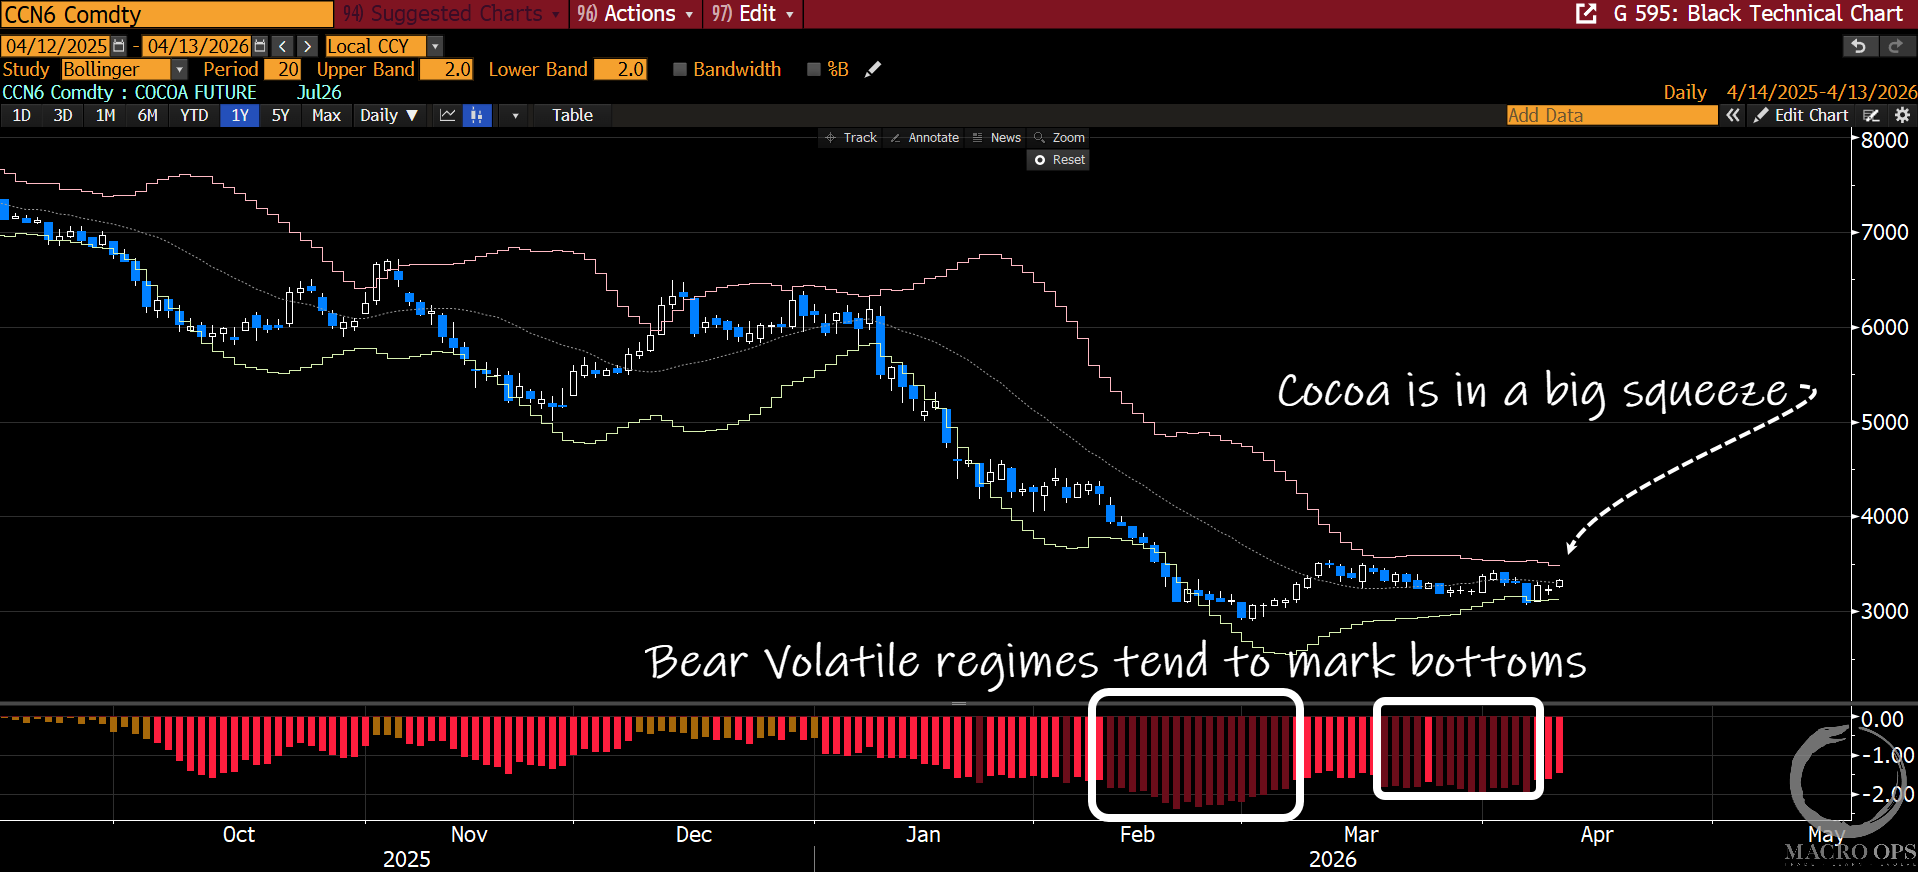
3. Positioning and sentiment are crowded short, while the tape is deeply oversold. We’ll be adding to this long on a confirmed volatility breakout (VBO).
Trifecta Charts
4. Our Trifecta Lens fell back to -2 last week. Combined with severely depressed liquidity readings, the message is clear: best case, we chop sideways from here. A move to -3 or lower signals a likely cyclical top is in.
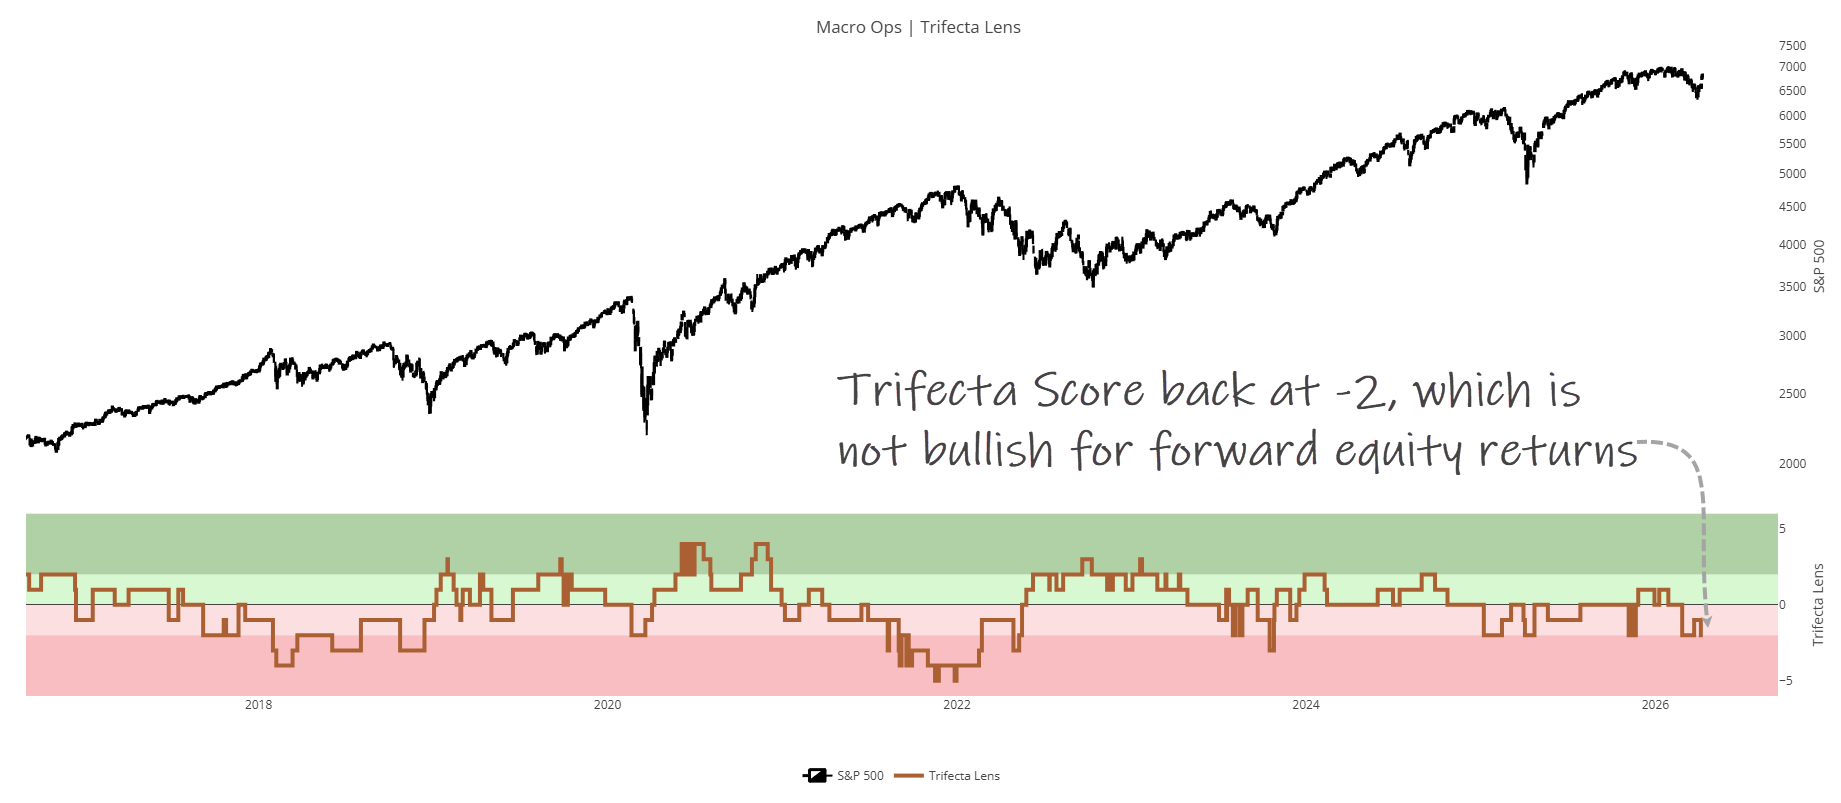
5. Durable bottoms need breadth thrust confirmation — a big, fast reversal in investor behavior. That may still come. But we haven’t seen any thrusts yet.
Tony — our resident vol expert — breaks down why this rally was hedge-unwind driven: a collapse in implied correlation, not individual stock vol. That trade is largely done. Implied correlation is back to normal, the next leg lower needs individual stock vol to drop, and with earnings ahead and the war still live, that’s unlikely. VIX stalls in the high-teens, VX curve stays flat, equities lose a key fuel source. Full weekly vol rundown here.
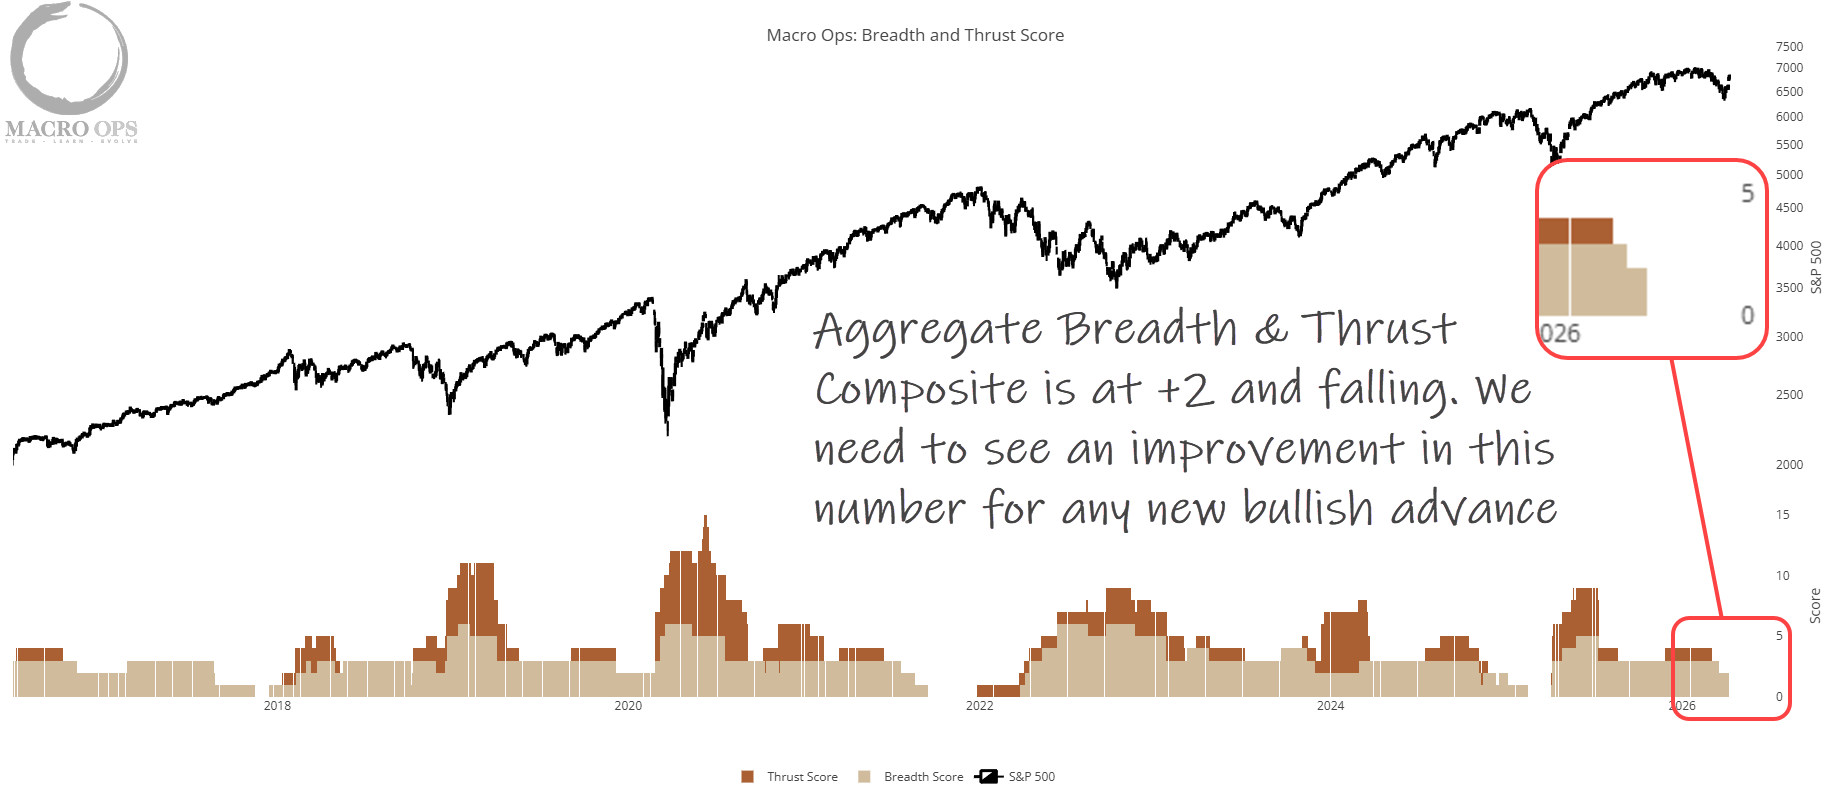
6. Our combined Aggregate Breadth + Thrust indicator is now at +2 and falling. Lowest reading since last April’s Liberation Day selloff. If this number doesn’t materially improve, odds are rising that we’re putting in a cyclical top.
Macro
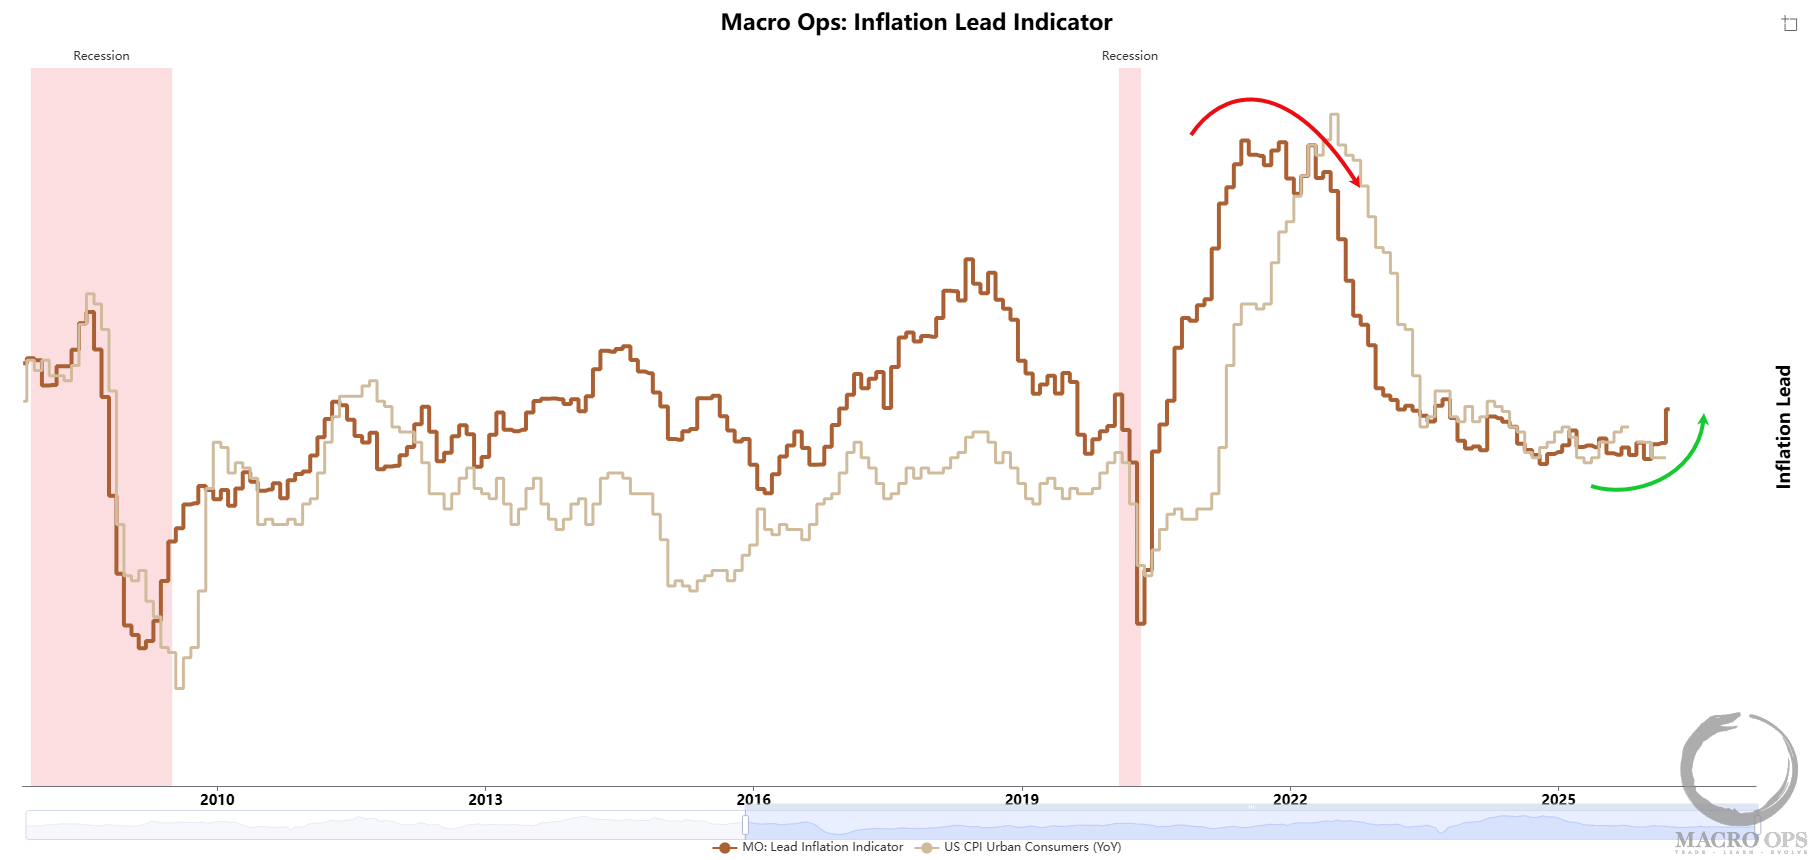
7. Our Leading Inflation Indicator (amber line) is starting to hockey stick higher — now at its highest level since 2023.
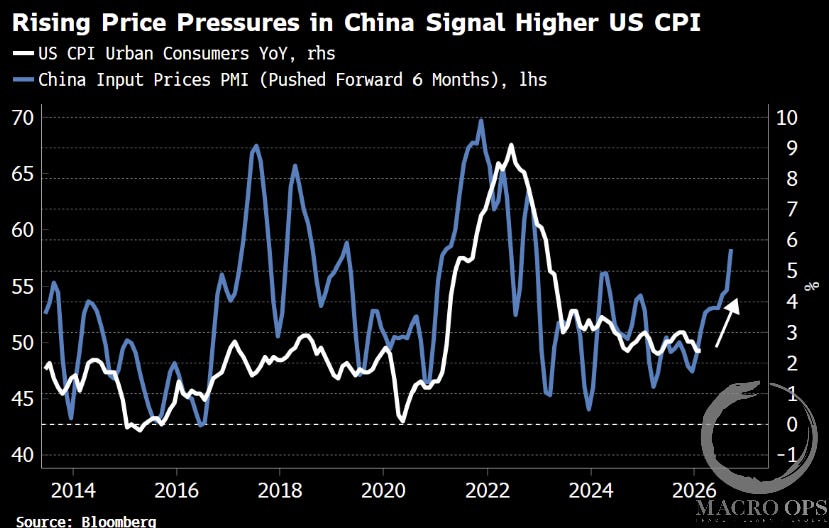
8. BBG’s Simon White shows China’s input prices PMI, advanced 6 months, has also risen to multi-year highs and is still climbing.
9. Despite this, longer-term inflation expectations remain anchored.
A few reasons for that: (1) labor markets remain weak, wage growth keeps falling; (2) the market is looking through the supply shock and pricing the coming demand shock of higher energy/food prices hitting an already anemic consumer; and (3) the market may still be too optimistic on a near-term resolution to this war.
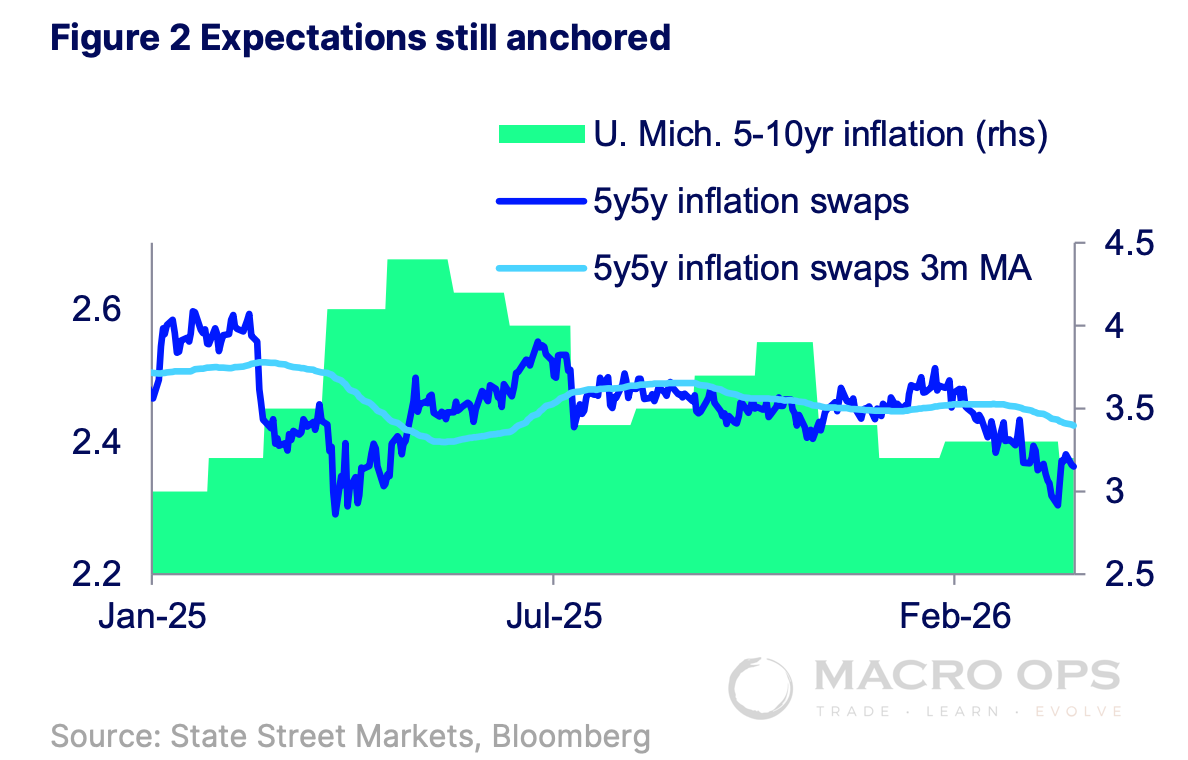
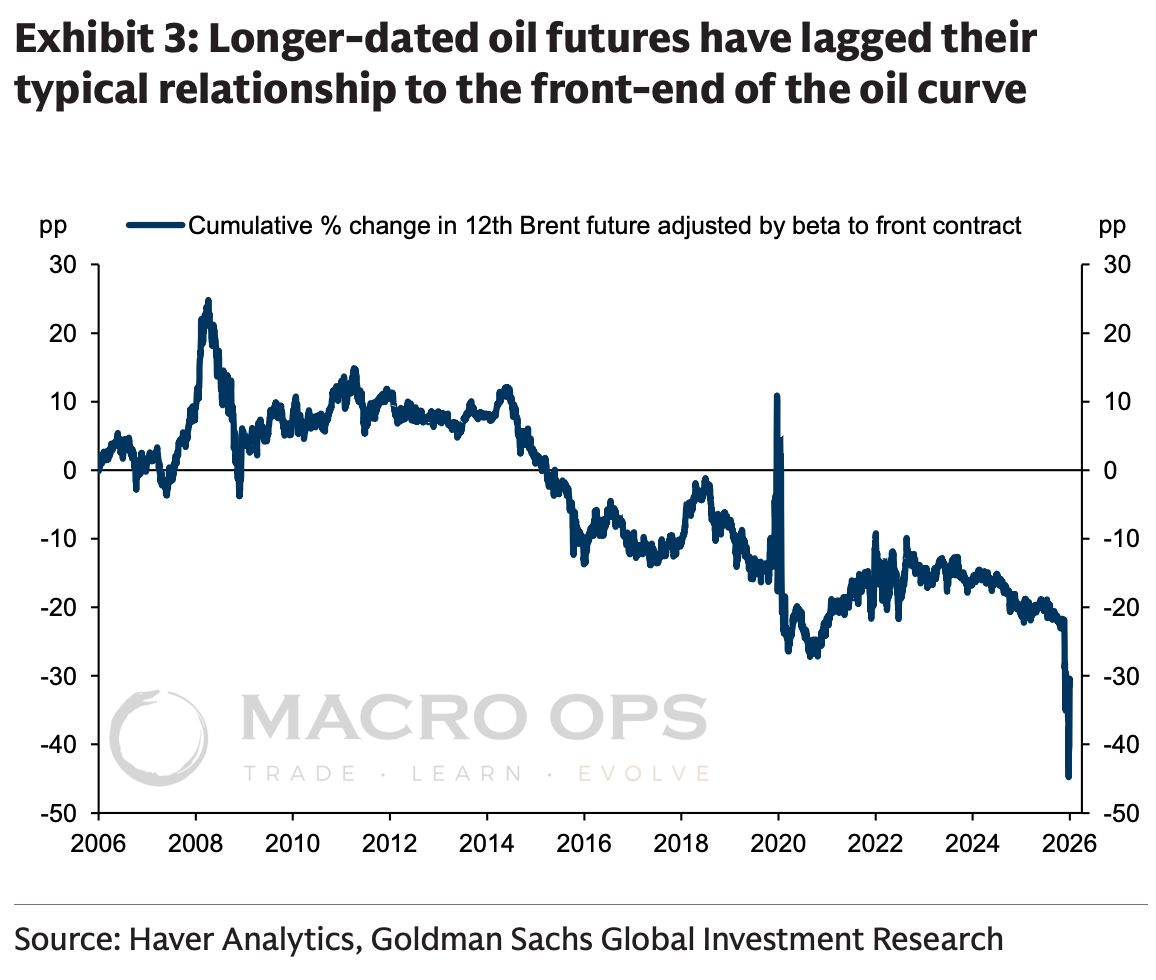
10. From GS: “Since the start of the conflict, 5y5y traded inflation has declined slightly despite the large repricing in the near-term inflation path. While it’s reasonable that markets would price a supply shock as a one-off boost to inflation, we think that has been reinforced by the comparative stability in longer-dated oil futures, which have meaningfully lagged their typical beta to the front-end of the oil curve.”
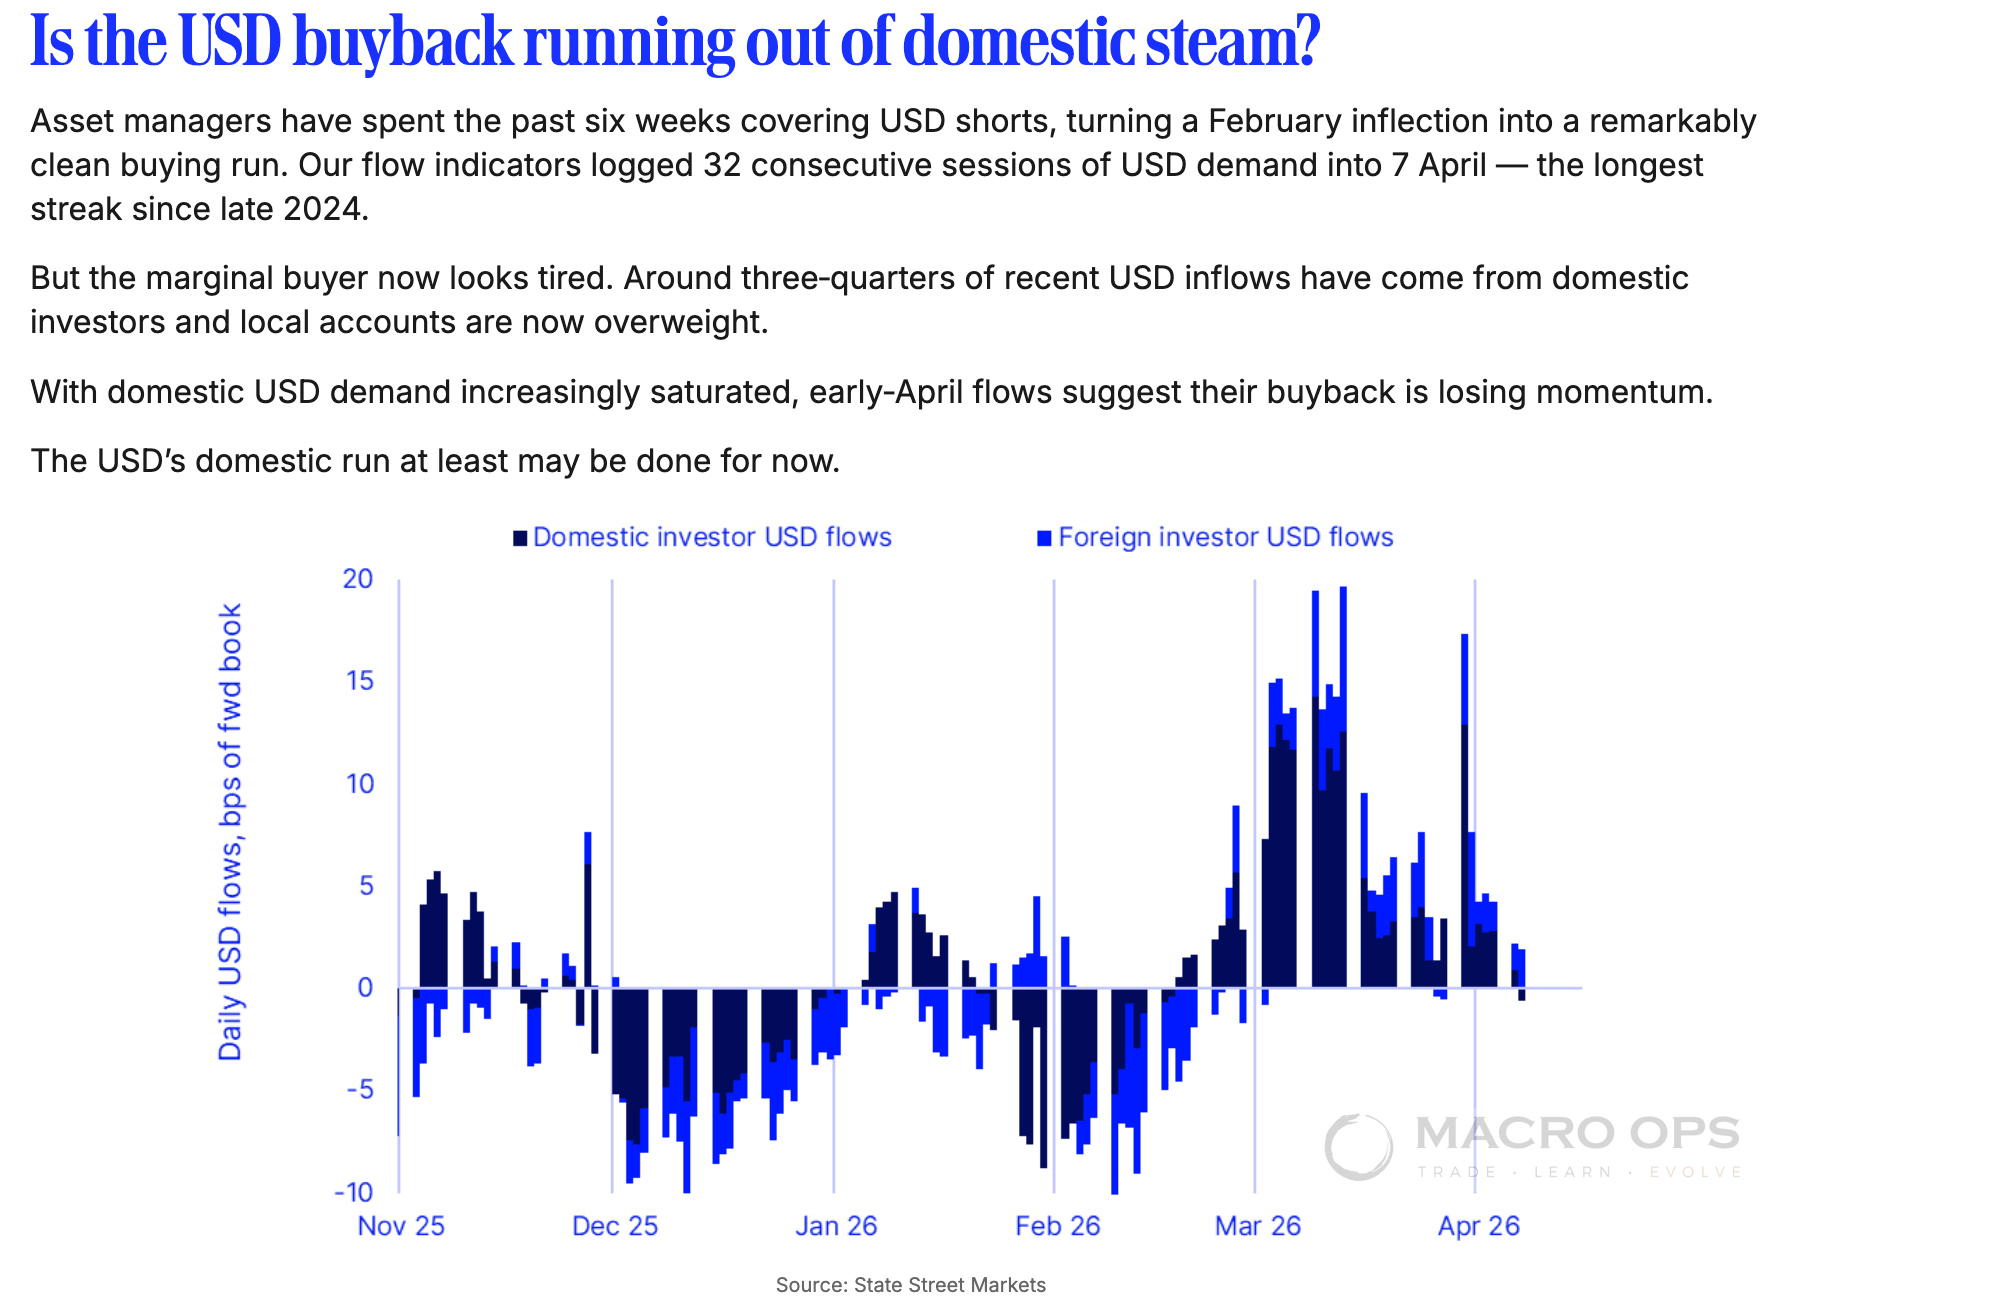
11. Last week we talked about the DXY and its 12-month sideways range. Still watching for a setup — breakout above or below. My bias is lower. I’m willing to take small swings short at the top of this range. State Street shows the USD’s domestic bid losing steam.
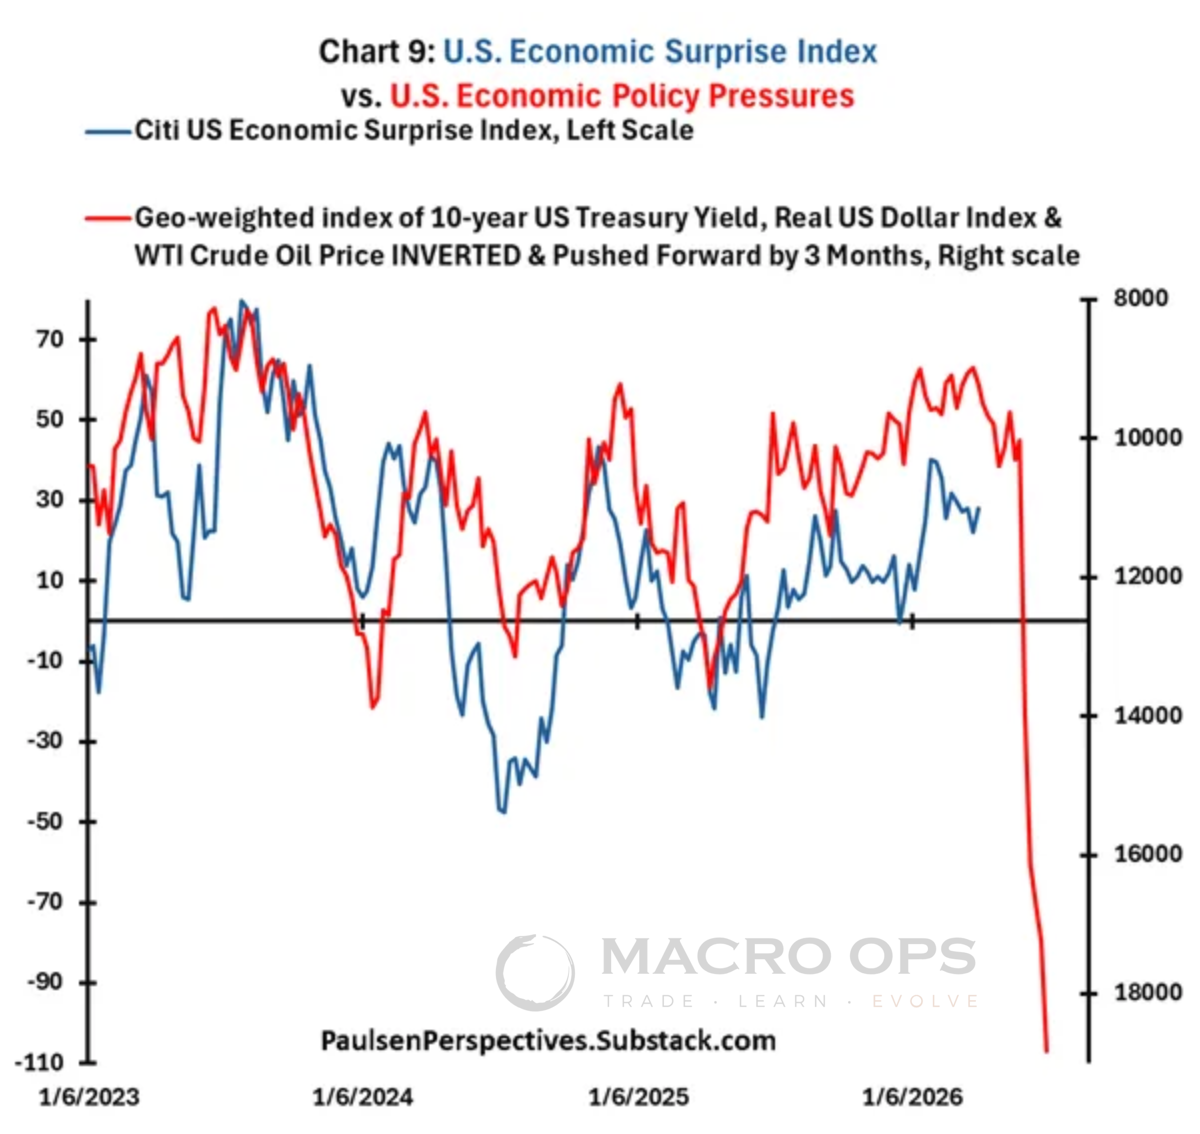
12. Paulsen put out a great post last week (link here) making the case for slowing US growth. His geo-weighted index of 10yr USTs and real USD, inverted and advanced 3 months, is pointing to negative economic surprises ahead.
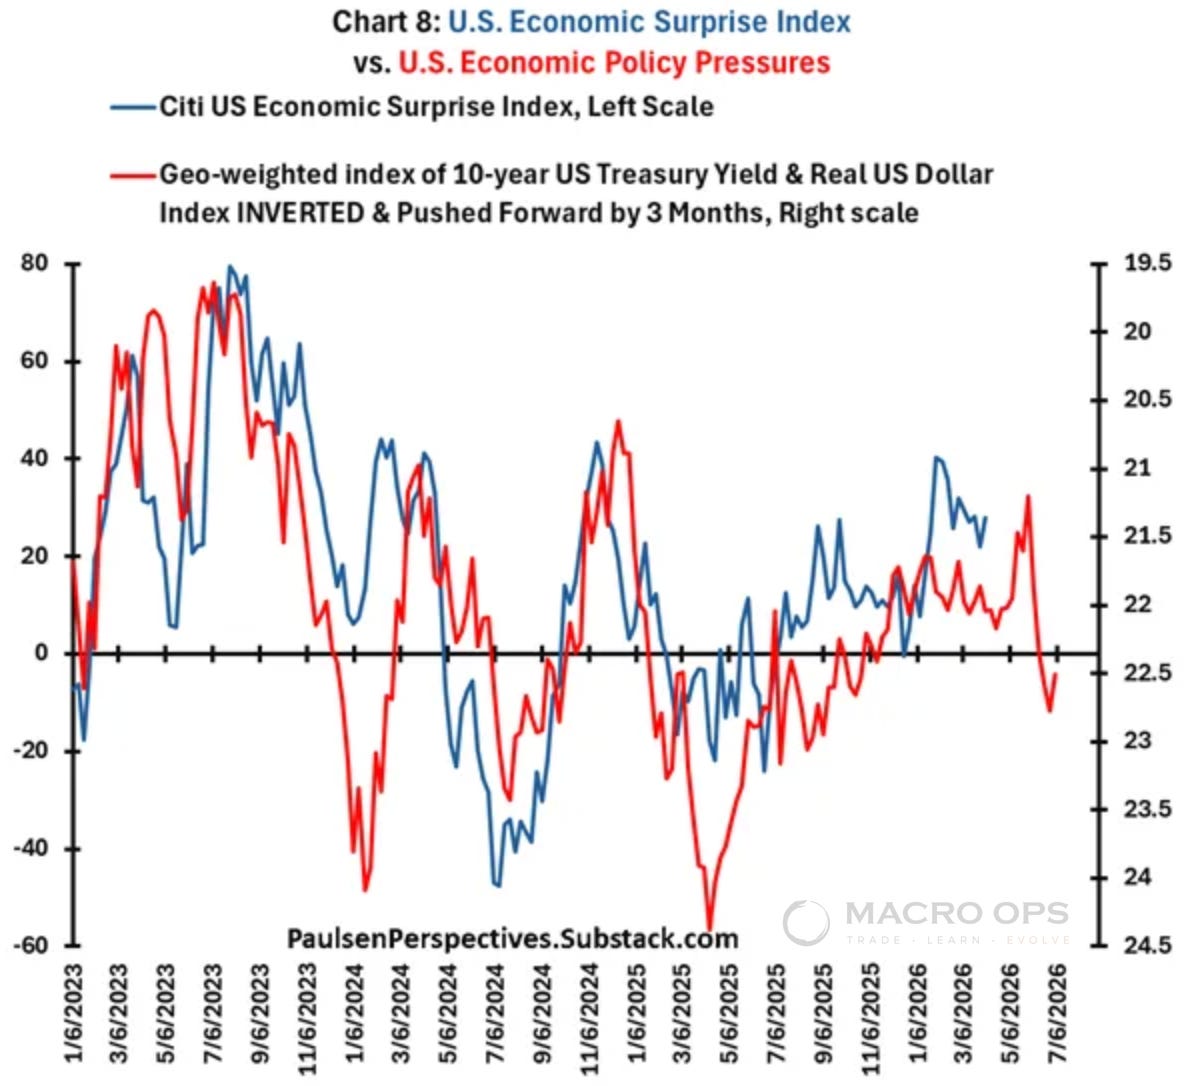
13. Same picture when you add oil. Paulsen’s not calling for growth falling through the floor — just that already-slow growth continues coming in lower.
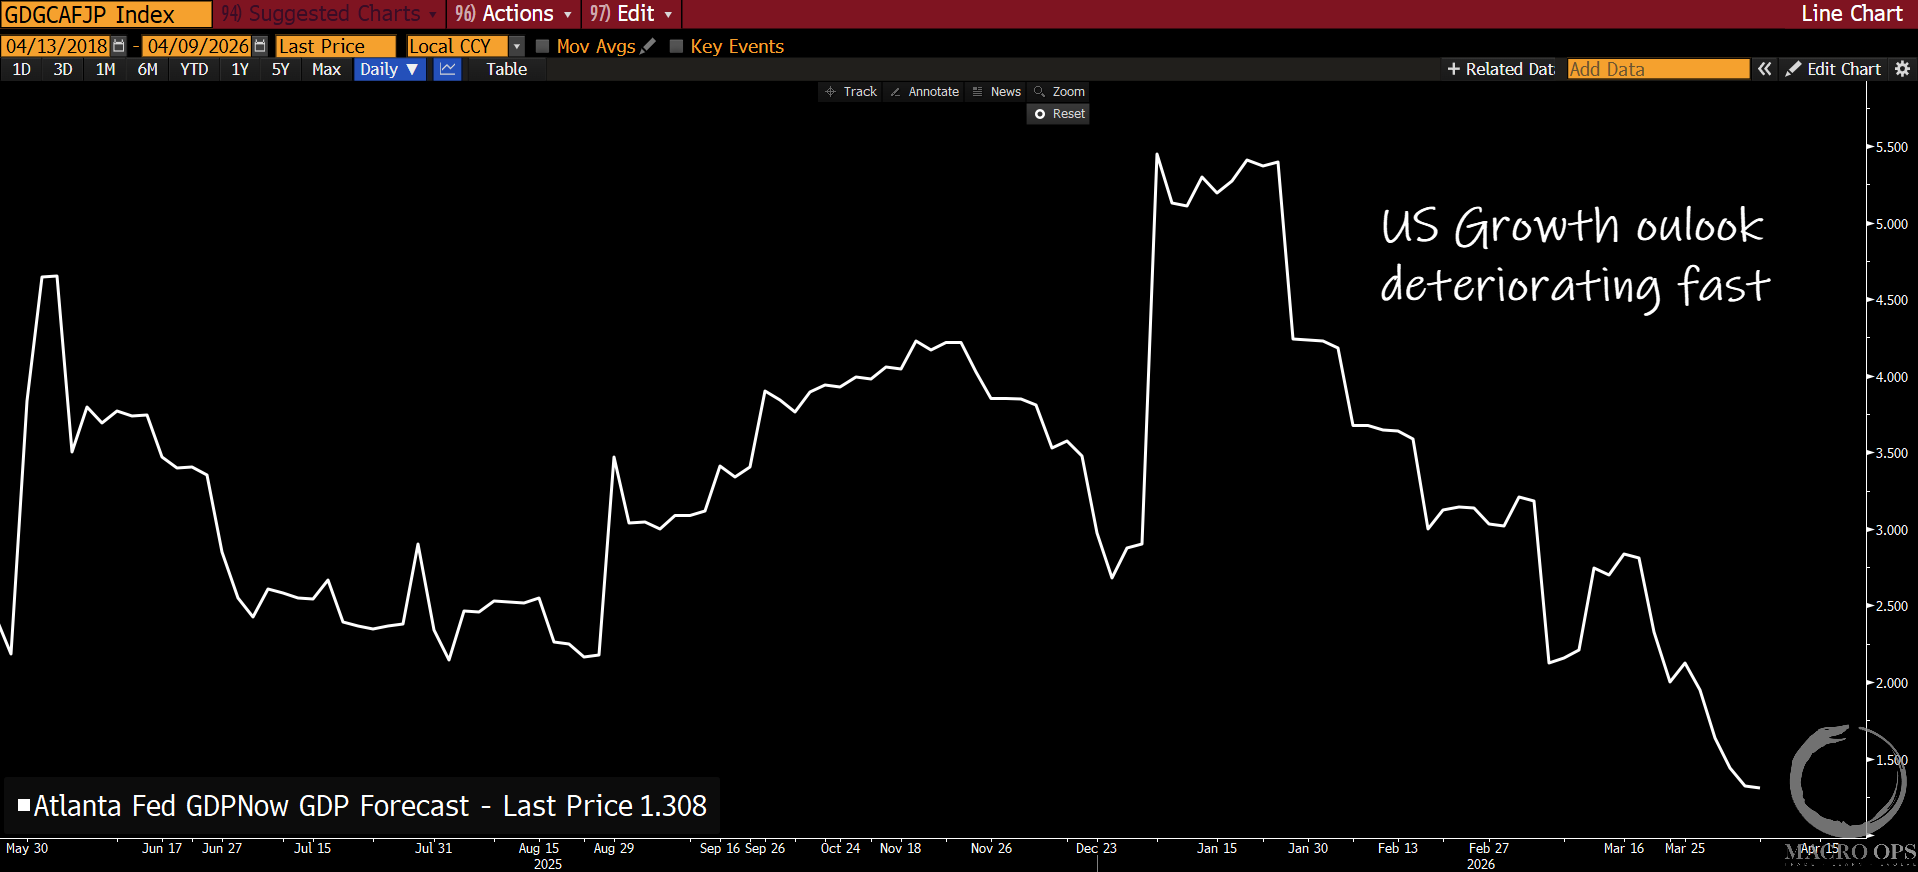
14. Atlanta Fed’s GDPNow is at its lowest level since the Liberation Day selloff, and falling fast.
Trade Setups / Topical Charts
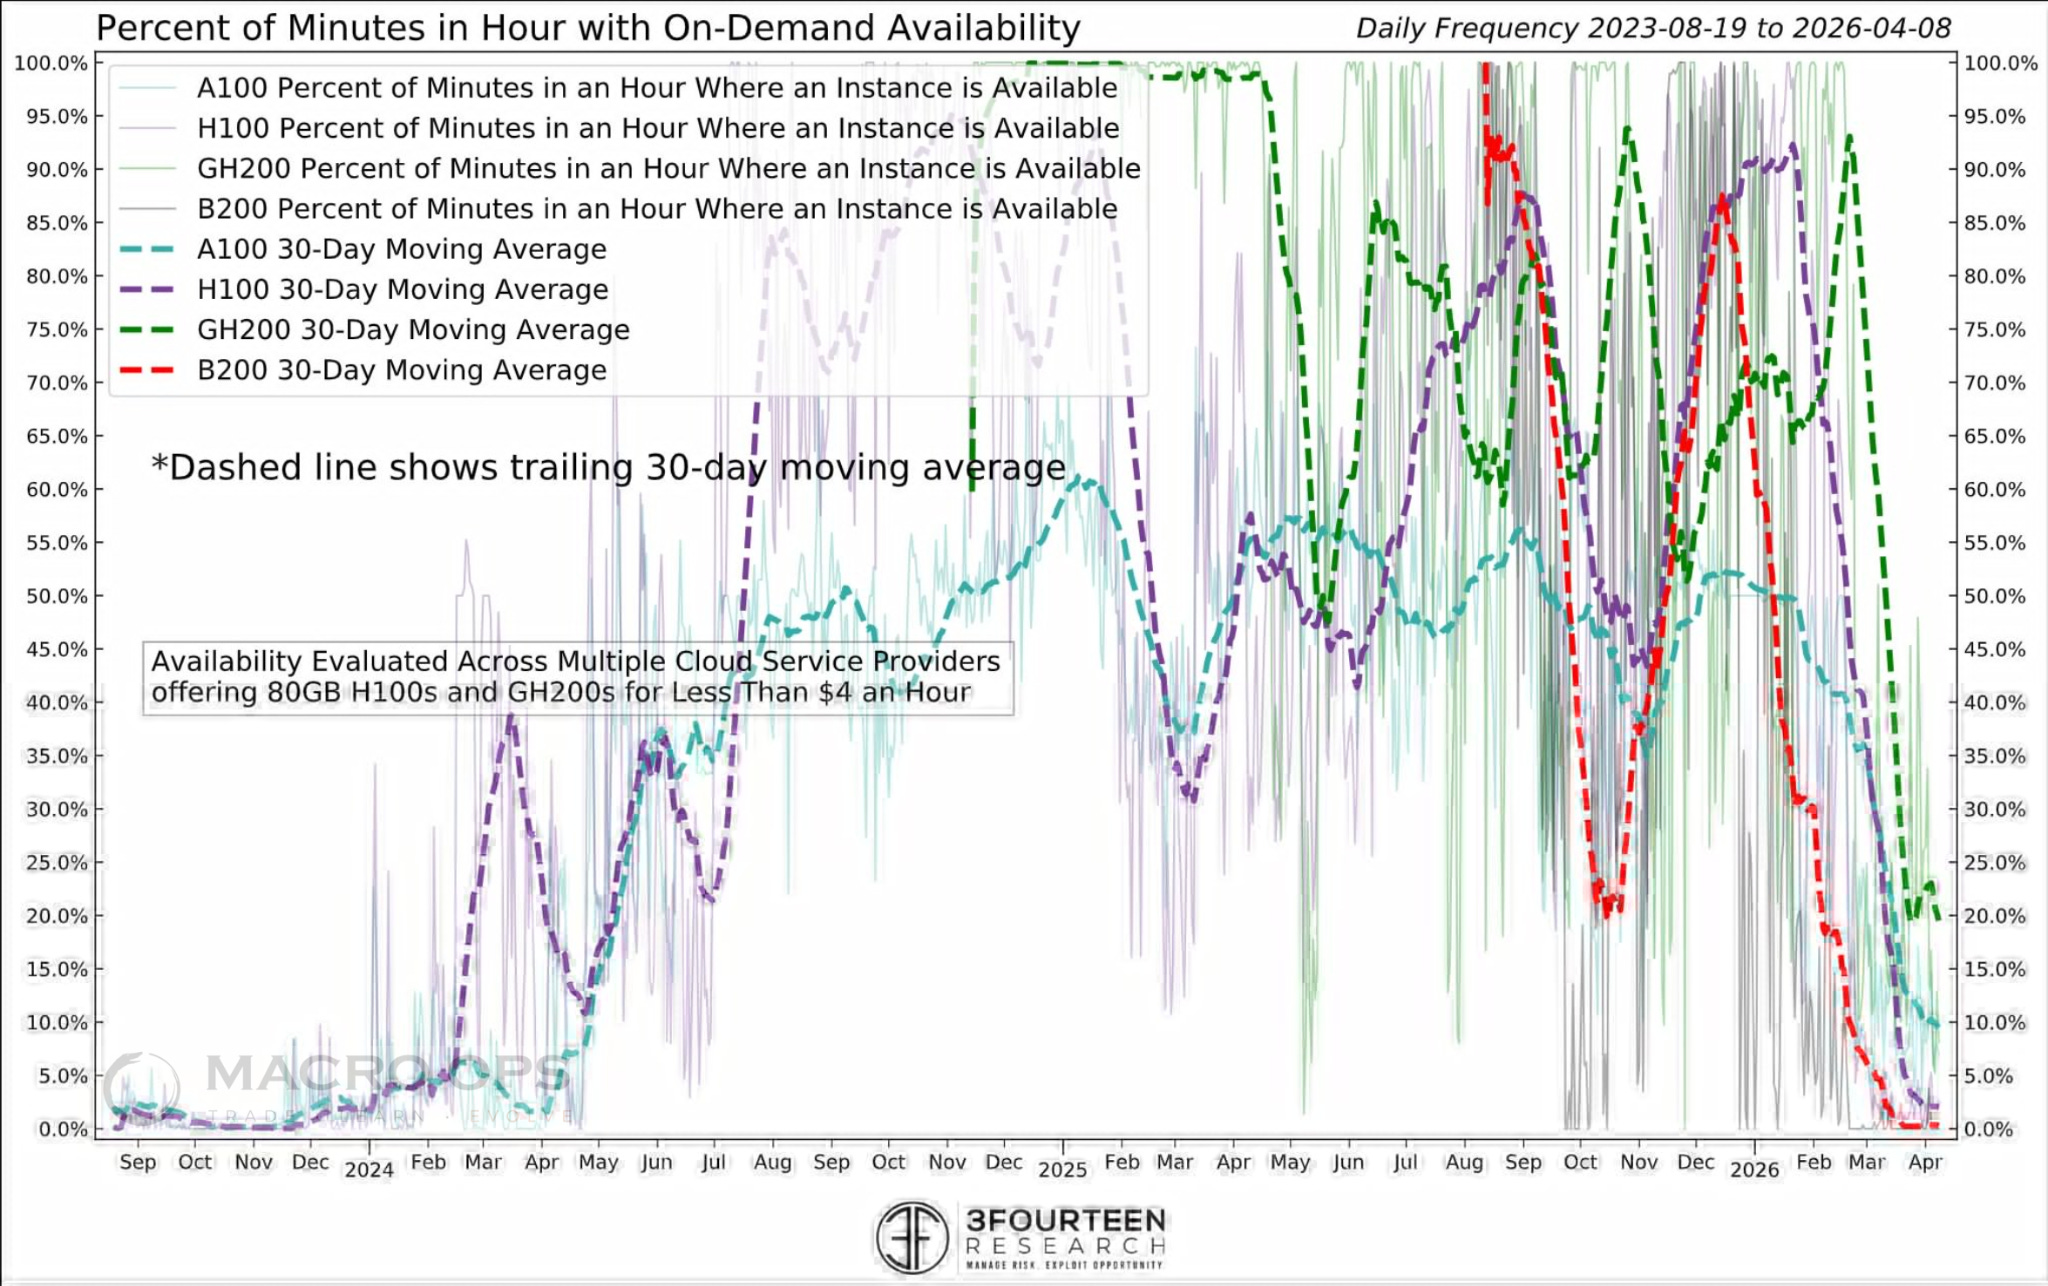
15. The AI trade is nowhere near over. @WarrenPies:
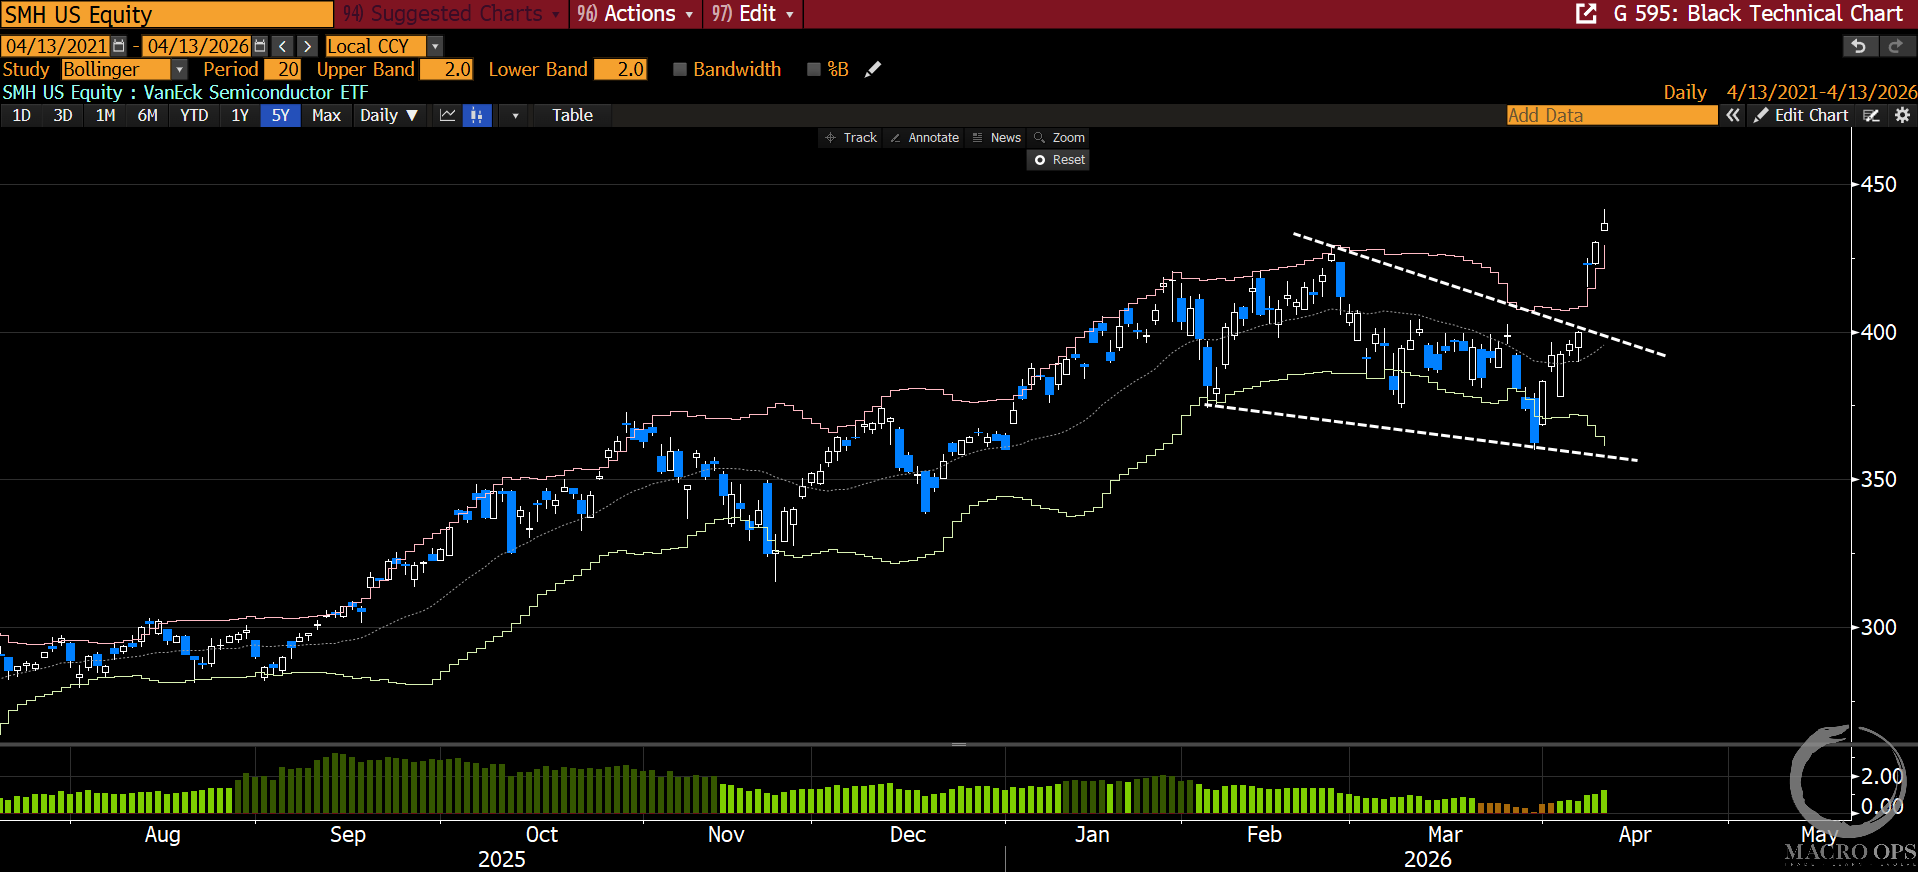
“As the Iran War has ebbed and flowed, GPU availability for B200s has collapsed to zero...H100s close behind. Whatever happens with the war, the AI complex is likely to lead any true sustainable bull market. Unsurprising to see SMH less than 1% from a new ATH.”
16. Semis (SMH) continue to lead the charge.
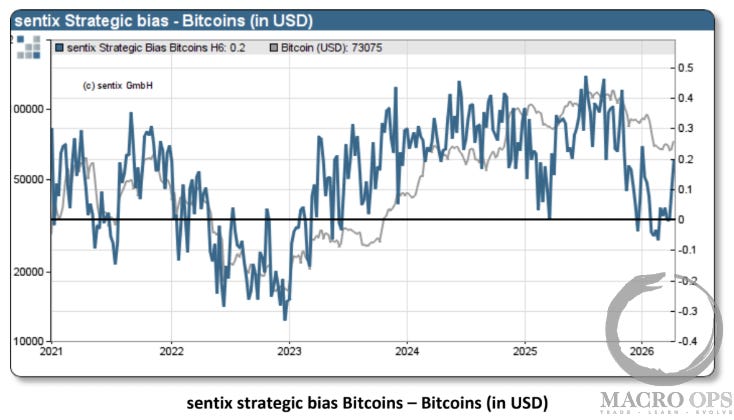
17. I’m turning more bearish on crypto — but I think we likely see a counter-trend rally first. Sentix noted this past week that Strategic Bias is signaling a likely intermediate bottom in BTC:
“Against a backdrop of bearish sentiment, Bitcoin managed to defend its price level just below US$70,000. So far, so good. However, this negative sentiment has now subsided. At the same time, nothing has been achieved in technical terms. The oscillating movement that has persisted for weeks is, so far, consistent with a consolidation within a downtrend, and neutral sentiment often marks the end of such a consolidation phase. However, something noteworthy is happening on another level. Medium-term underlying confidence is rising significantly, and more sharply than the recovery in sentiment. This therefore reflects a new willingness to build positions that goes beyond simply covering short positions. The $76,000 mark could therefore be tested. But only once prices move above this resistance level would the chart picture be viewed more constructively.”
Thanks for reading.
Your Macro Operator,
Alex