


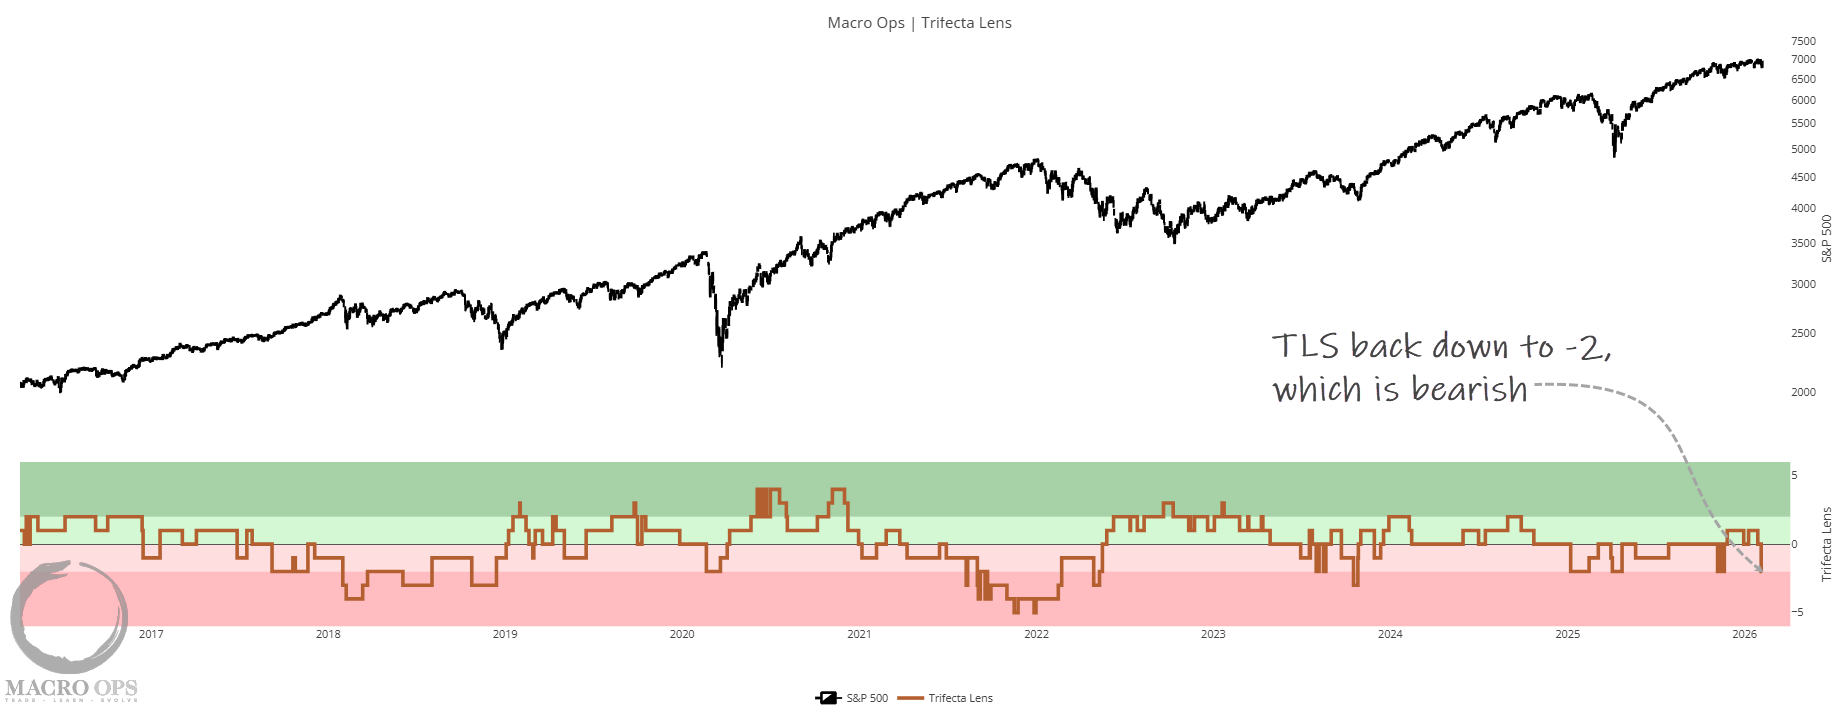
Summary: Our Trifecta Lens Score fell to -2 last week, which is bearish. It was driven lower by a big drop in liquidity, which has flipped negative for the first time since Nov of last year. This, coupled with elevated Trend Fragility (currently 87%) and sizable CTA headwinds, all bode poorly for forward three-month returns. However, our Breadth Composite remains supportive for the time being, and shorter-term measures such as deeply oversold software/services and crypto, along with GS’s Panic Index near max fear, suggest this rally likely has a few more weeks left in the tank.
***The MO port finished 2025 up +50.8% and is currently up +33.7% ytd in 26’. If you’d like to join the Collective, our premier service that offers discussions on high-level theory, differentiated research, real-time trade alerts, portfolio tracking, and a global community of serious traders/investors dedicated to mastery, then sign up below.***
1. Our Trifecta Lens Score (a composite of macro, liquidity, technicals, and sentiment) fell to -2 last week, which is bearish. It was driven lower by a big drop in liquidity, which has flipped negative for the first time since Nov of last year.
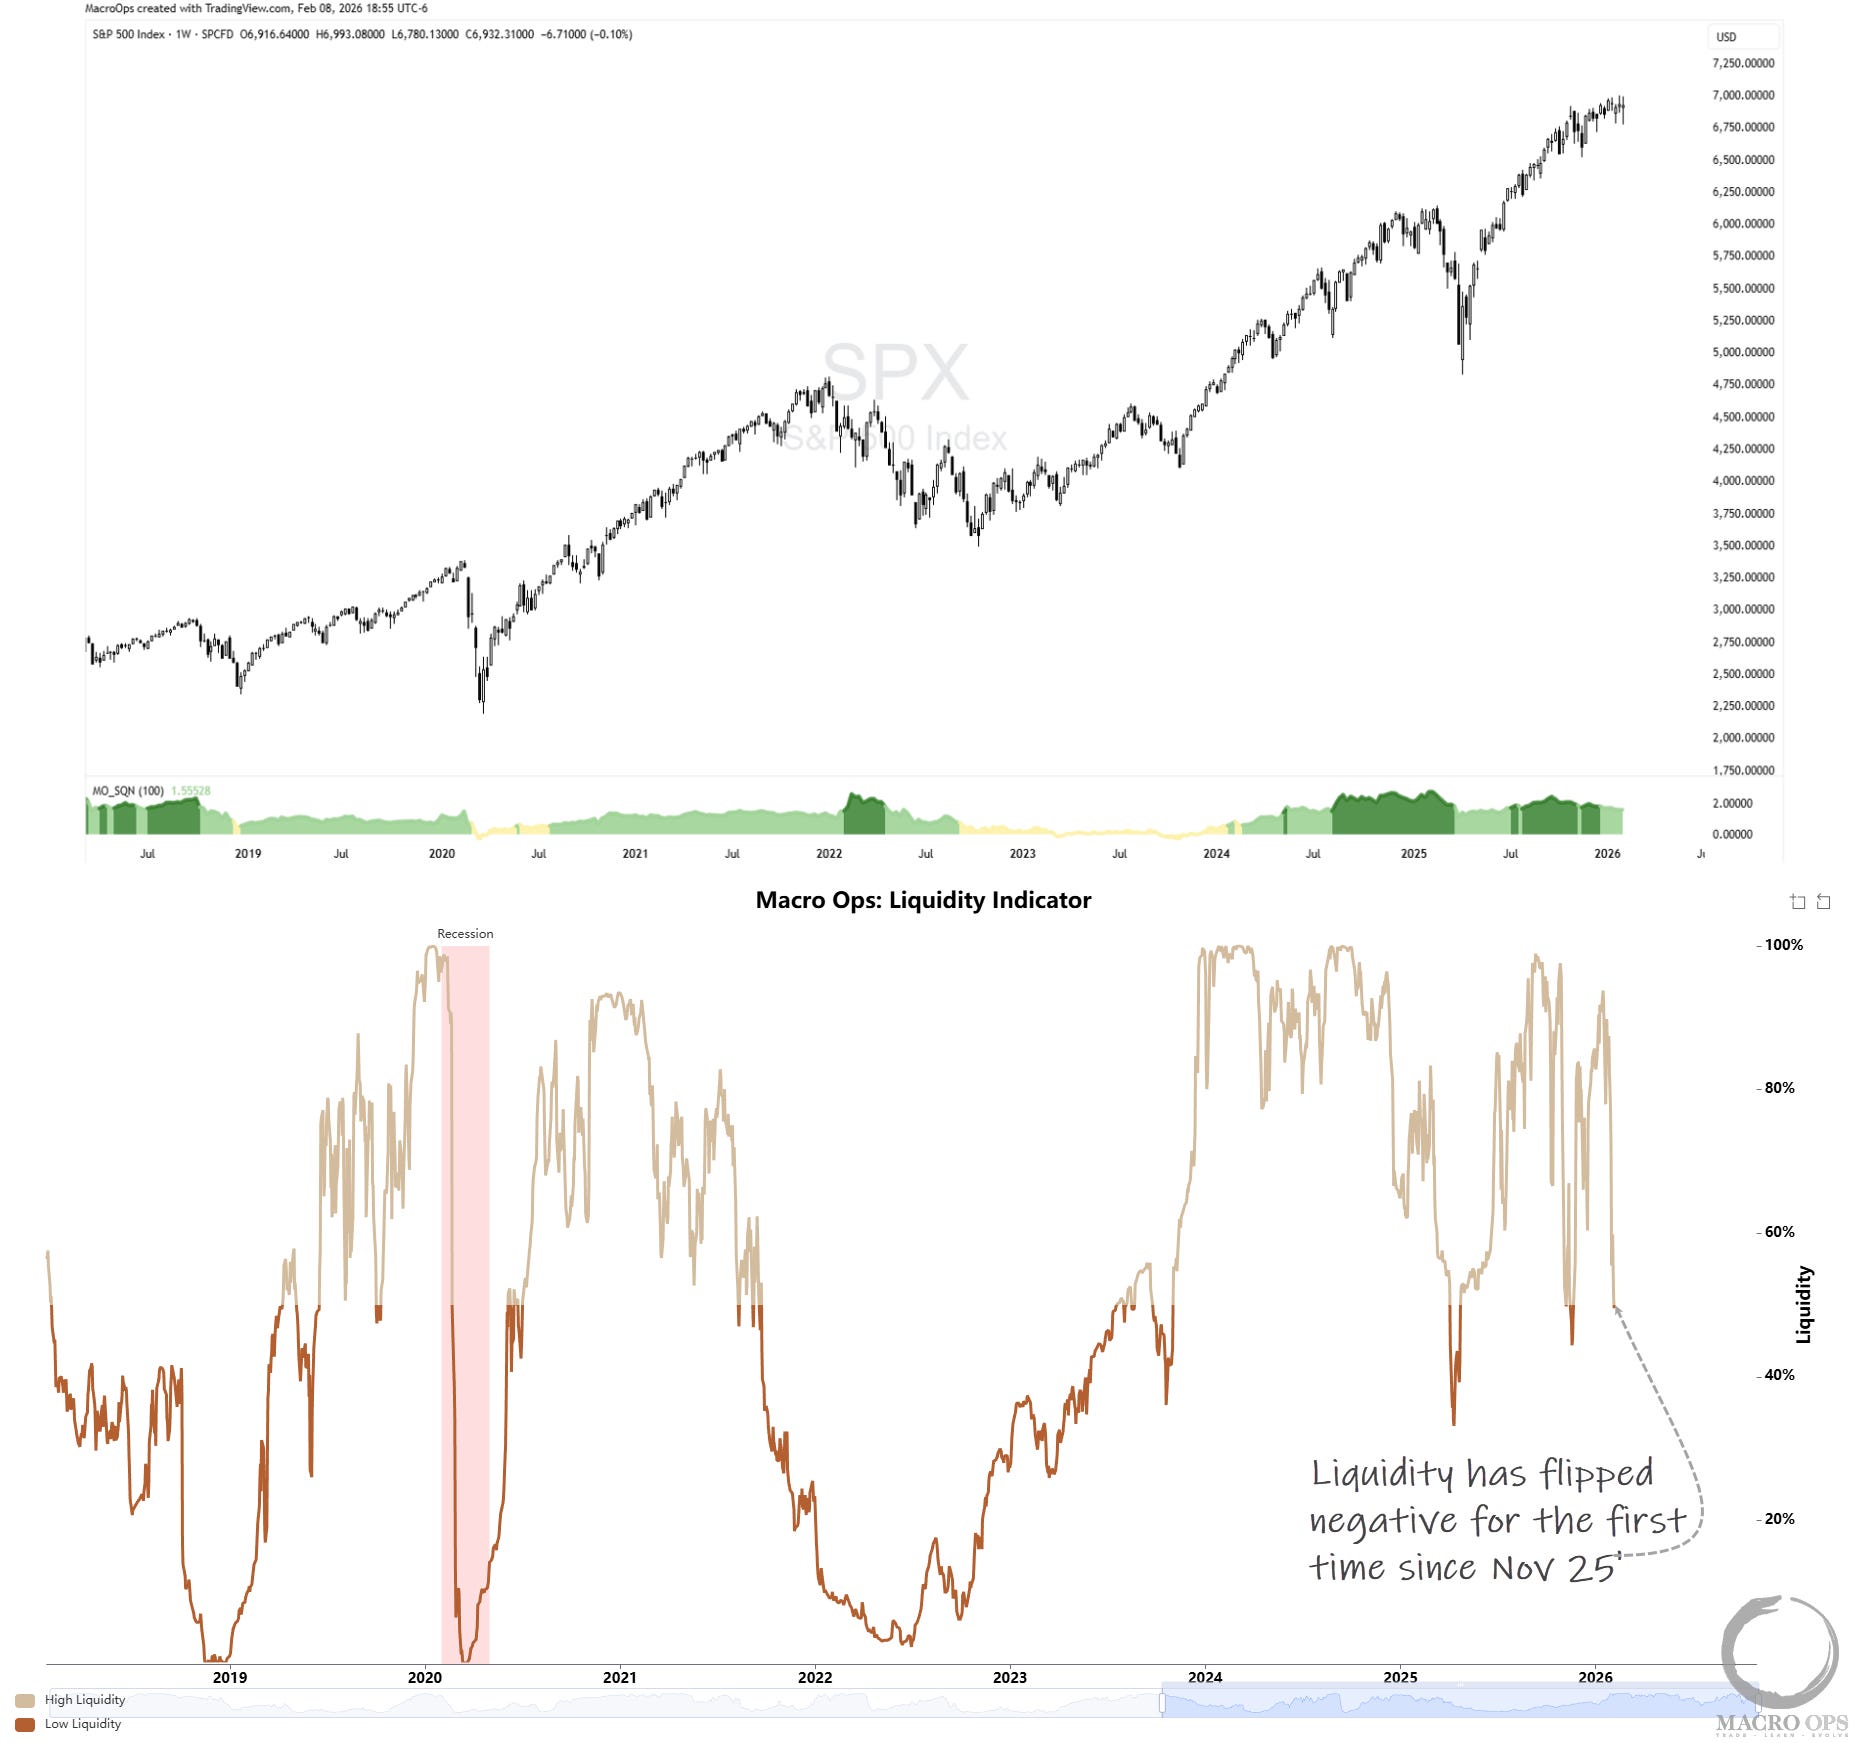
2. Our Liquidity Indicator plunged to 49% last week, marking its first negative reading since it briefly touched these levels in Nov of last year. I’d expect to see this rebound given the fiscal backdrop, but it’s possible that it leads lower level and we see a flushout in risk first. Regardless, this bears close watch.
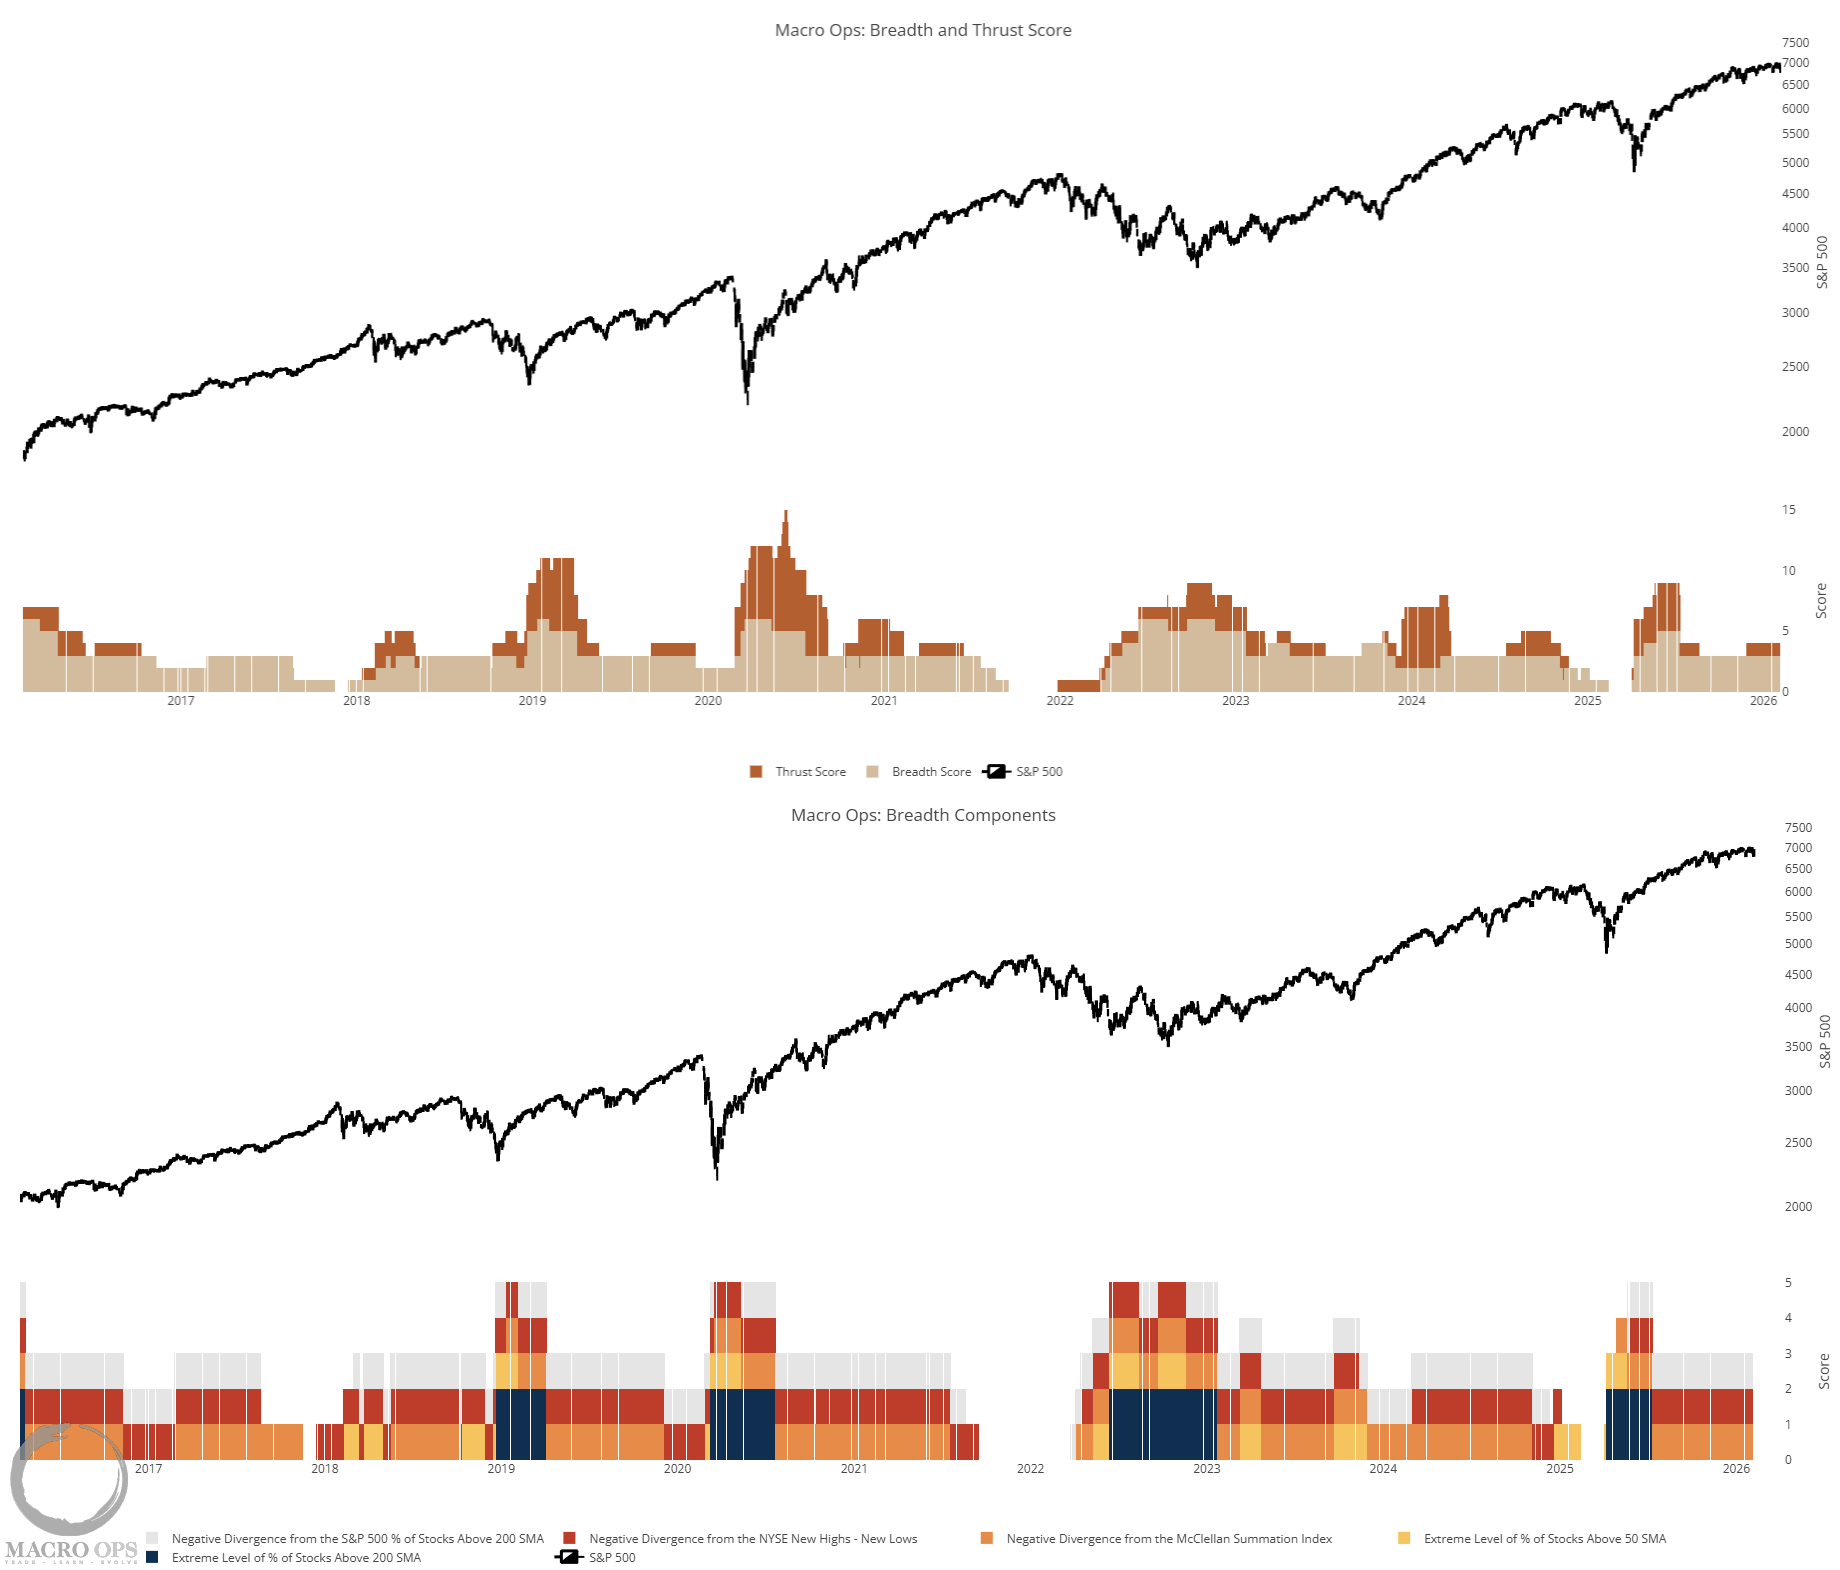
3. Our Aggregate Breadth and Breadth+Thrust composite, however, remains supportive of the broader uptrend. This suggests any near-term downside should be contained (sub -7%).
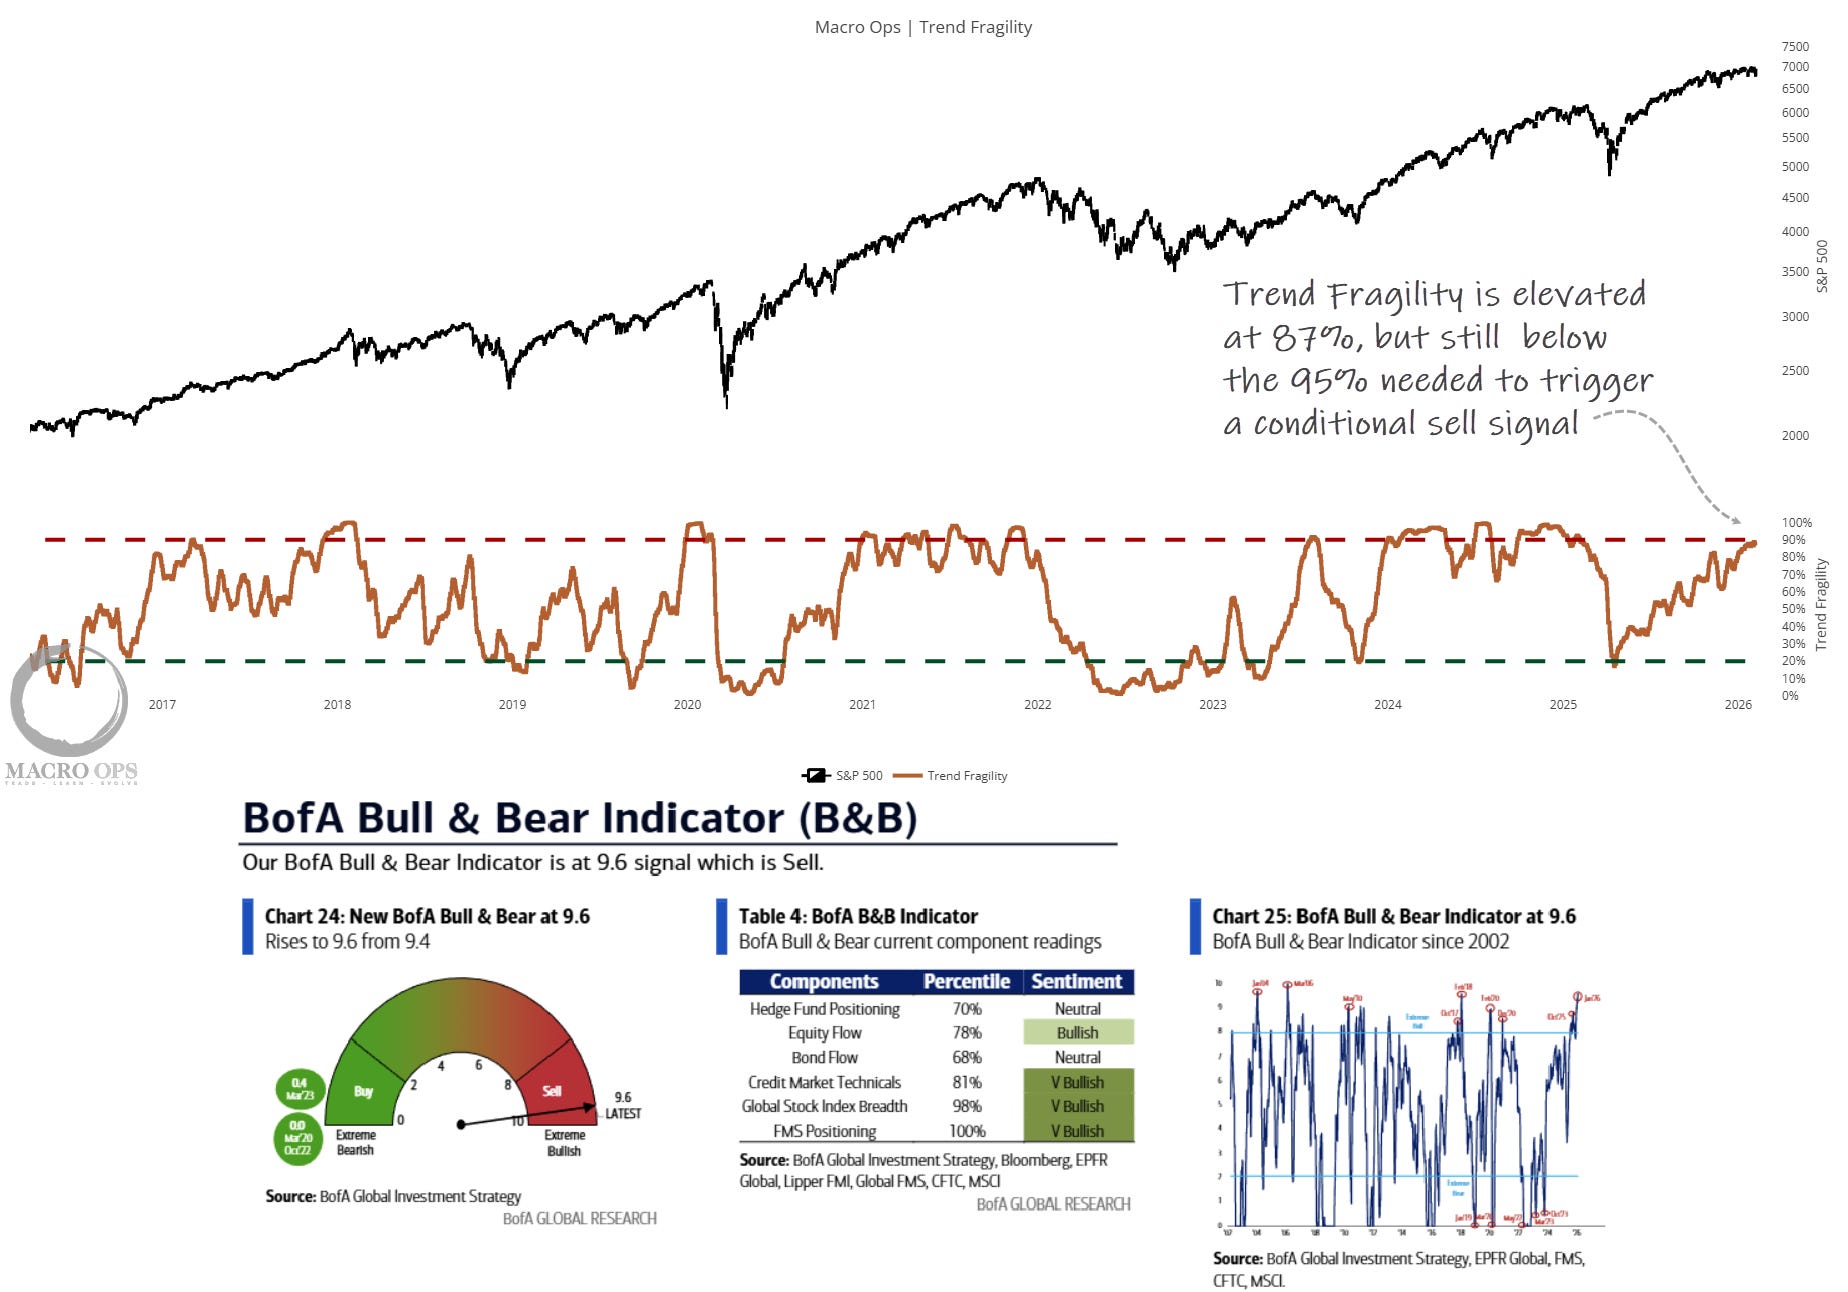
4. Our Trend Fragility score (a composite of sentiment and positioning indicators) is elevated at 87%. But, this is below the >95% threshold for a conditional sell signal. While BofA’s Bull-Bear indicator is at its highest since March of 06’, triggering a sell signal, where forward 3m returns are historically poor.
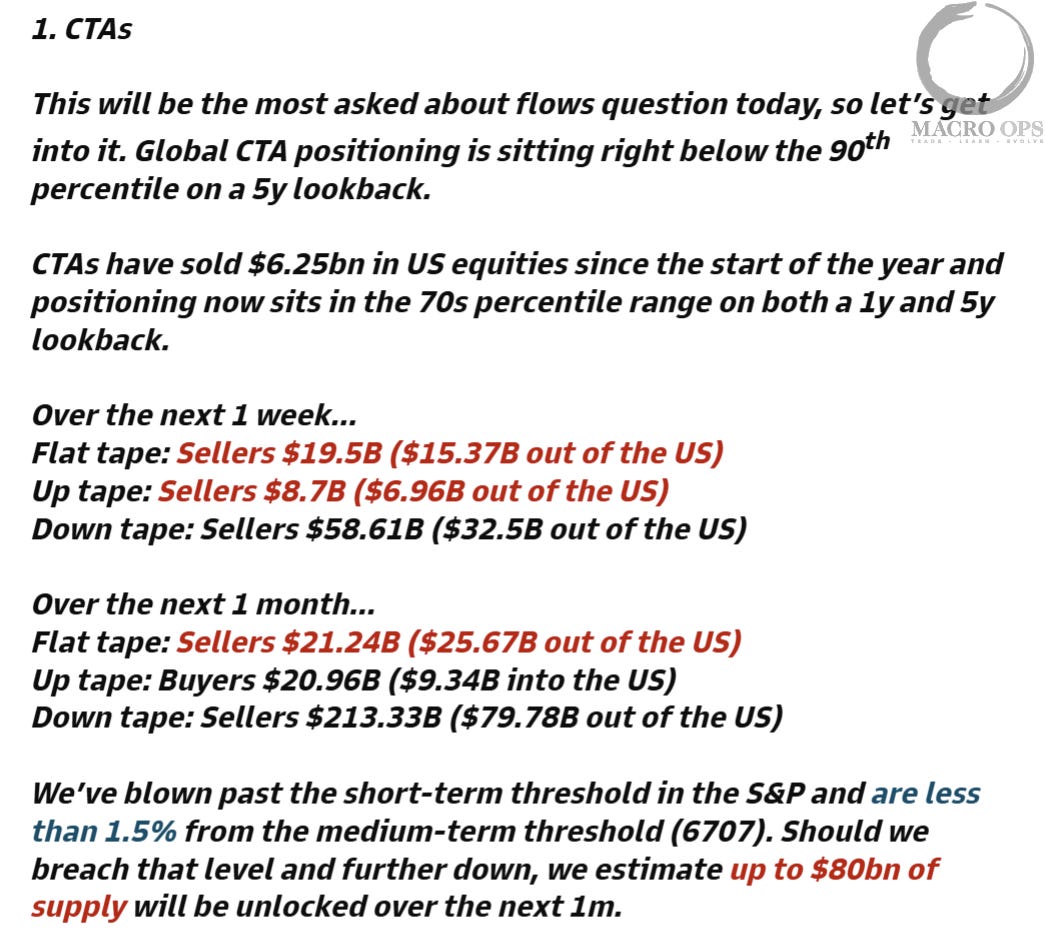
5. Global CTA positioning is in the 90th %tile according to GS. If the SPX takes out last week’s lows, we’ll have a substantial headwind from trend followers.
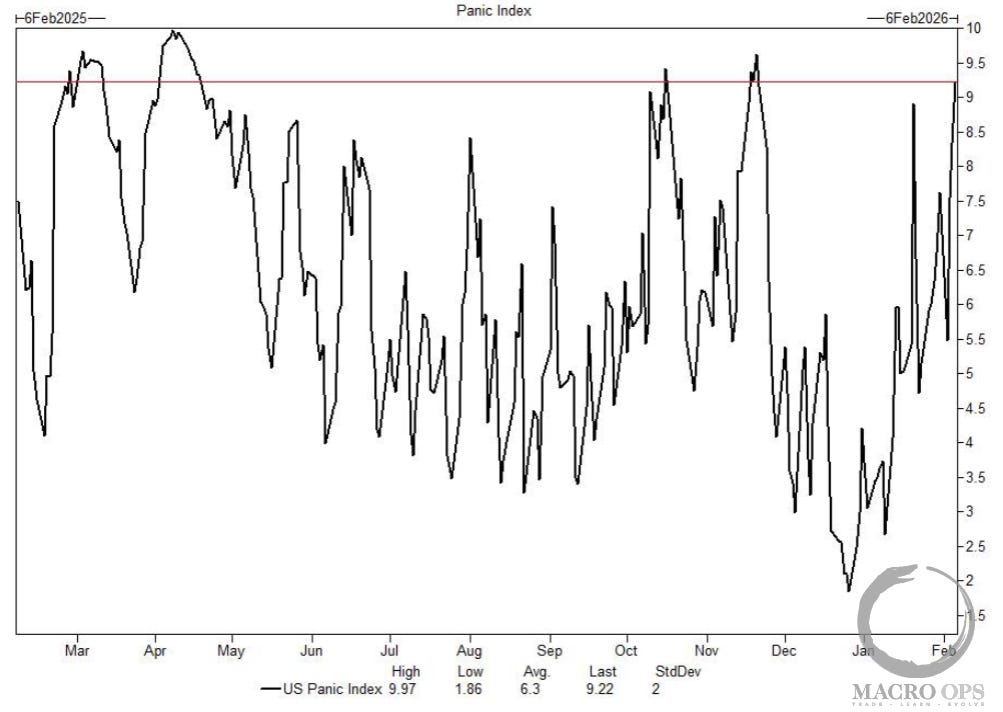
6. GS’s shorter-term measure of panic hit “9.22 based on 1-month S&P implied volatility, VIX volatility, S&P 1m put-call skew, and the S&P term structure slope (1m vs. 3m). These vol metrics indicate that investors are not far off from max fear.” We also have software and crypto at deeply oversold levels where historically, mean reversion comes into play. This market has fuel for another leg higher before rolling over into a larger correction sometime in March.
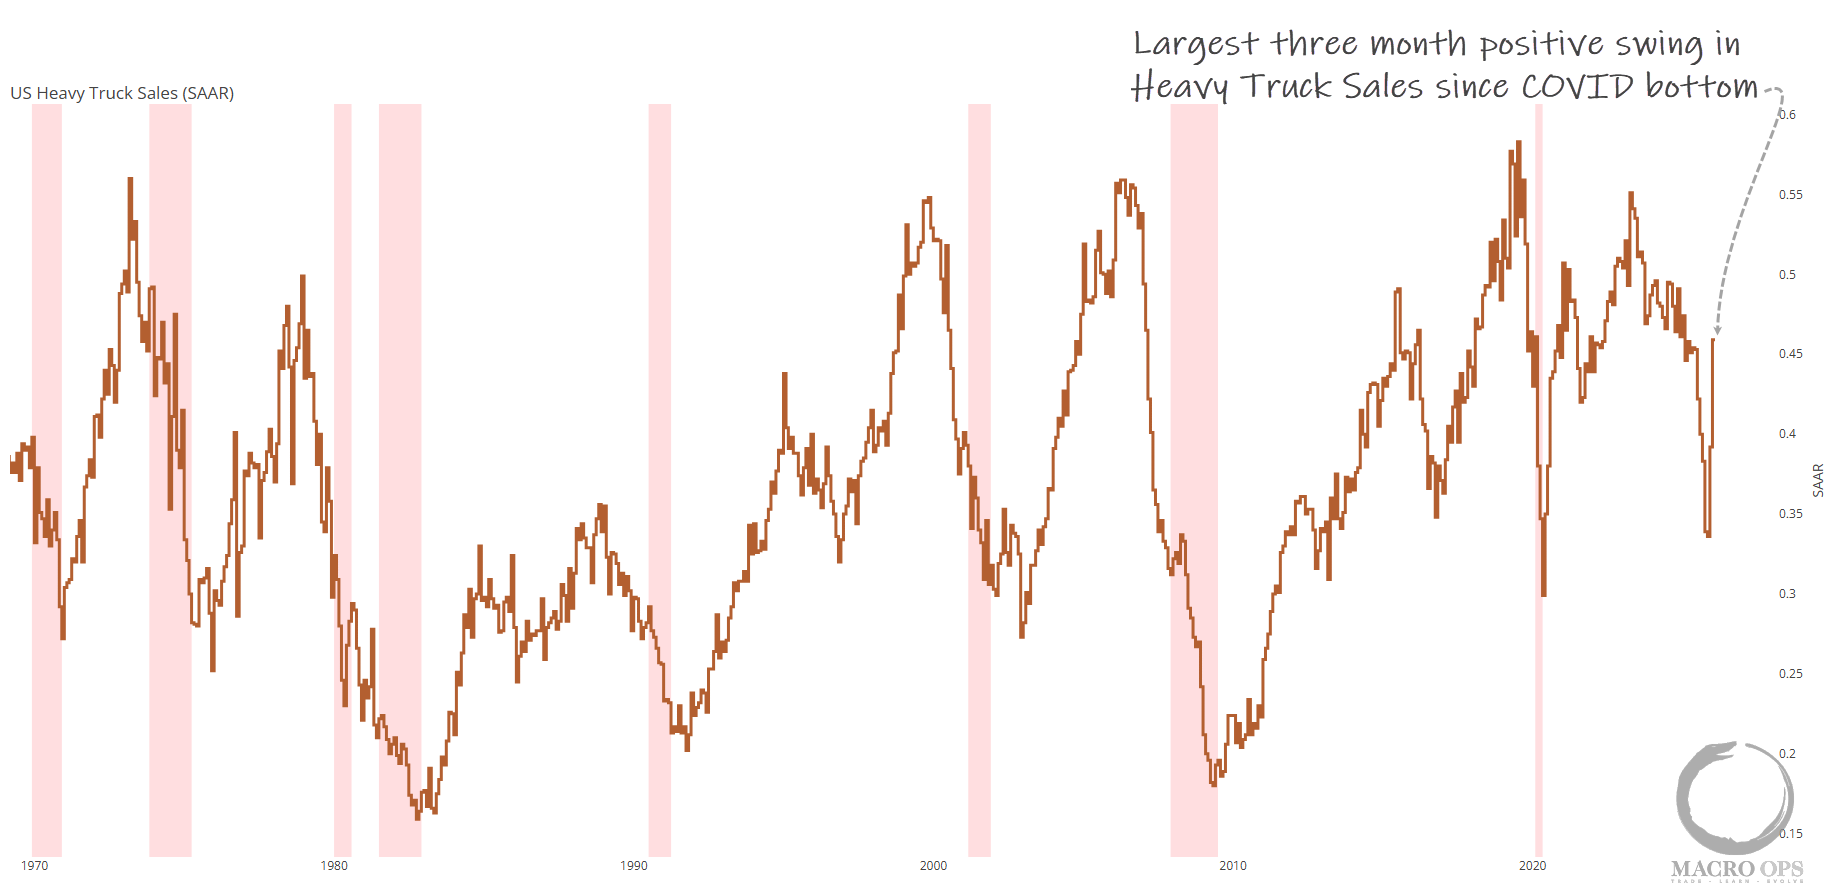
7. I’ve been highlighting the positive inflections in US growth metrics for the past month. Well, here’s another one… Heavy Truck Sales have put in their strongest 3-month swing since the COVID lows. And there are people out there seriously talking about a recession this year, smh.
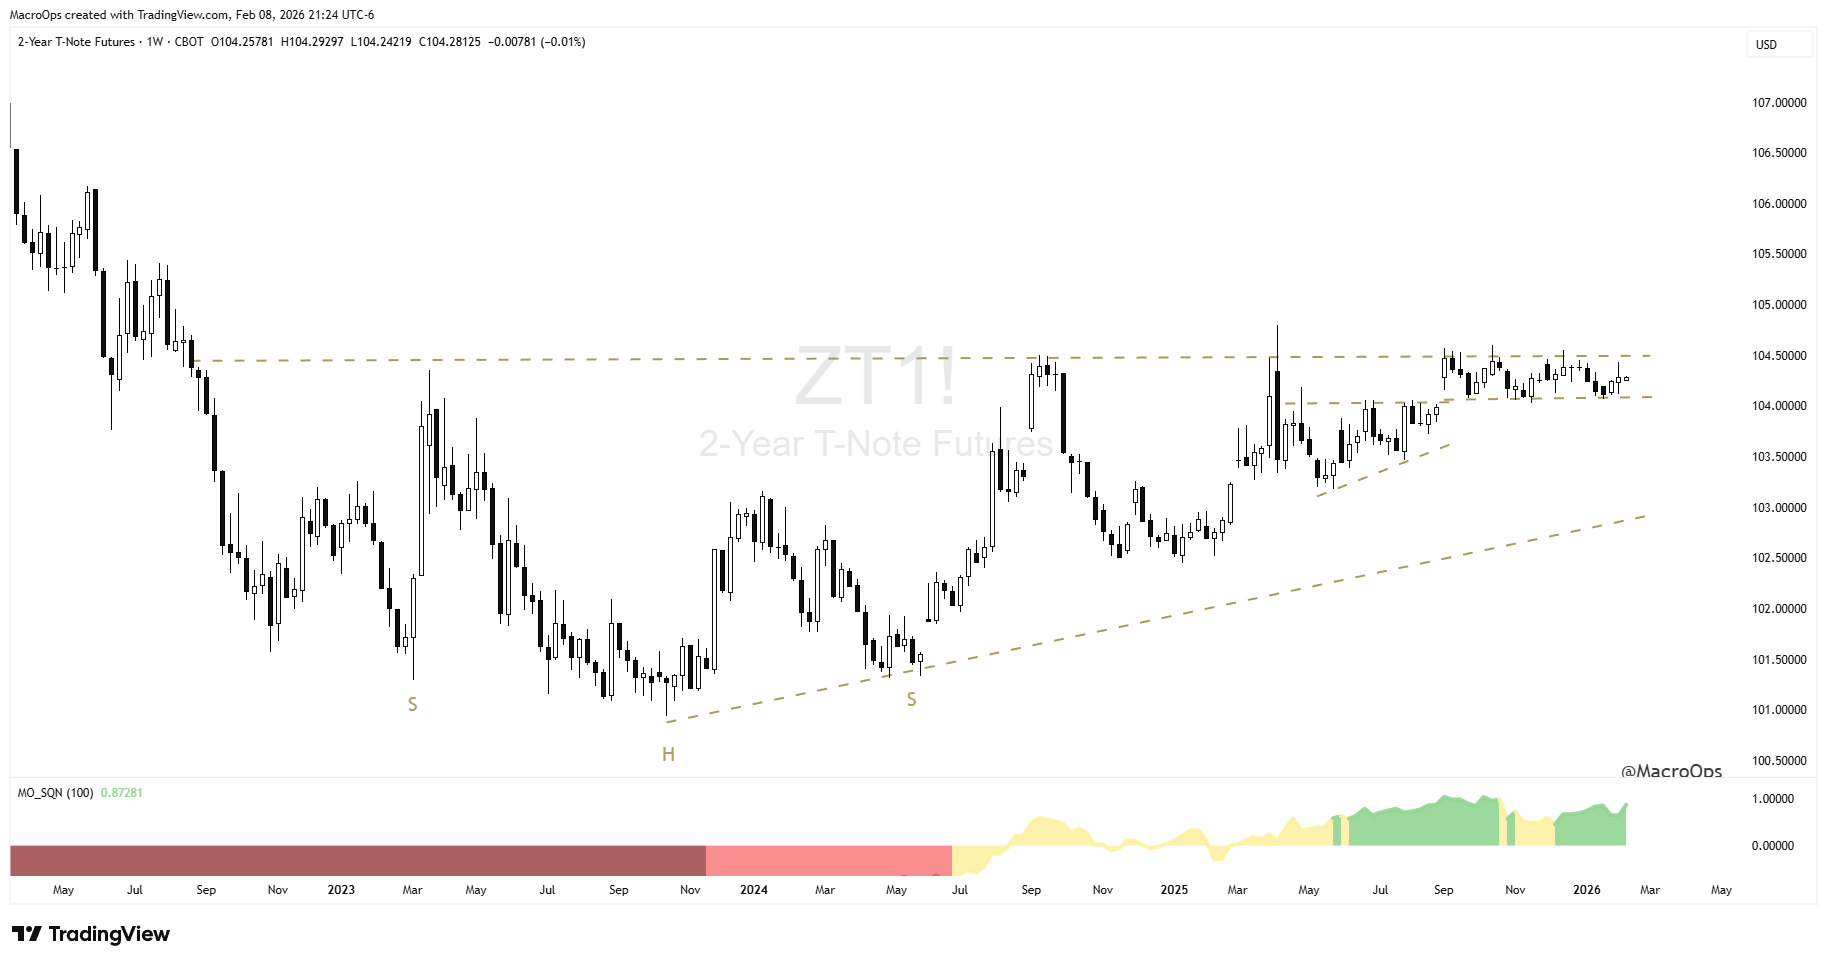
8. 2-year UST Notes continue to be one of the more interesting long-term setups I’m tracking. They’re in a major compression regime. Have put in a multi-year inverted H&S bottom. And are now consolidating right below the neckline in another compression regime. A big move is coming... My bias is up. We are long and will add aggressively on a breakout.
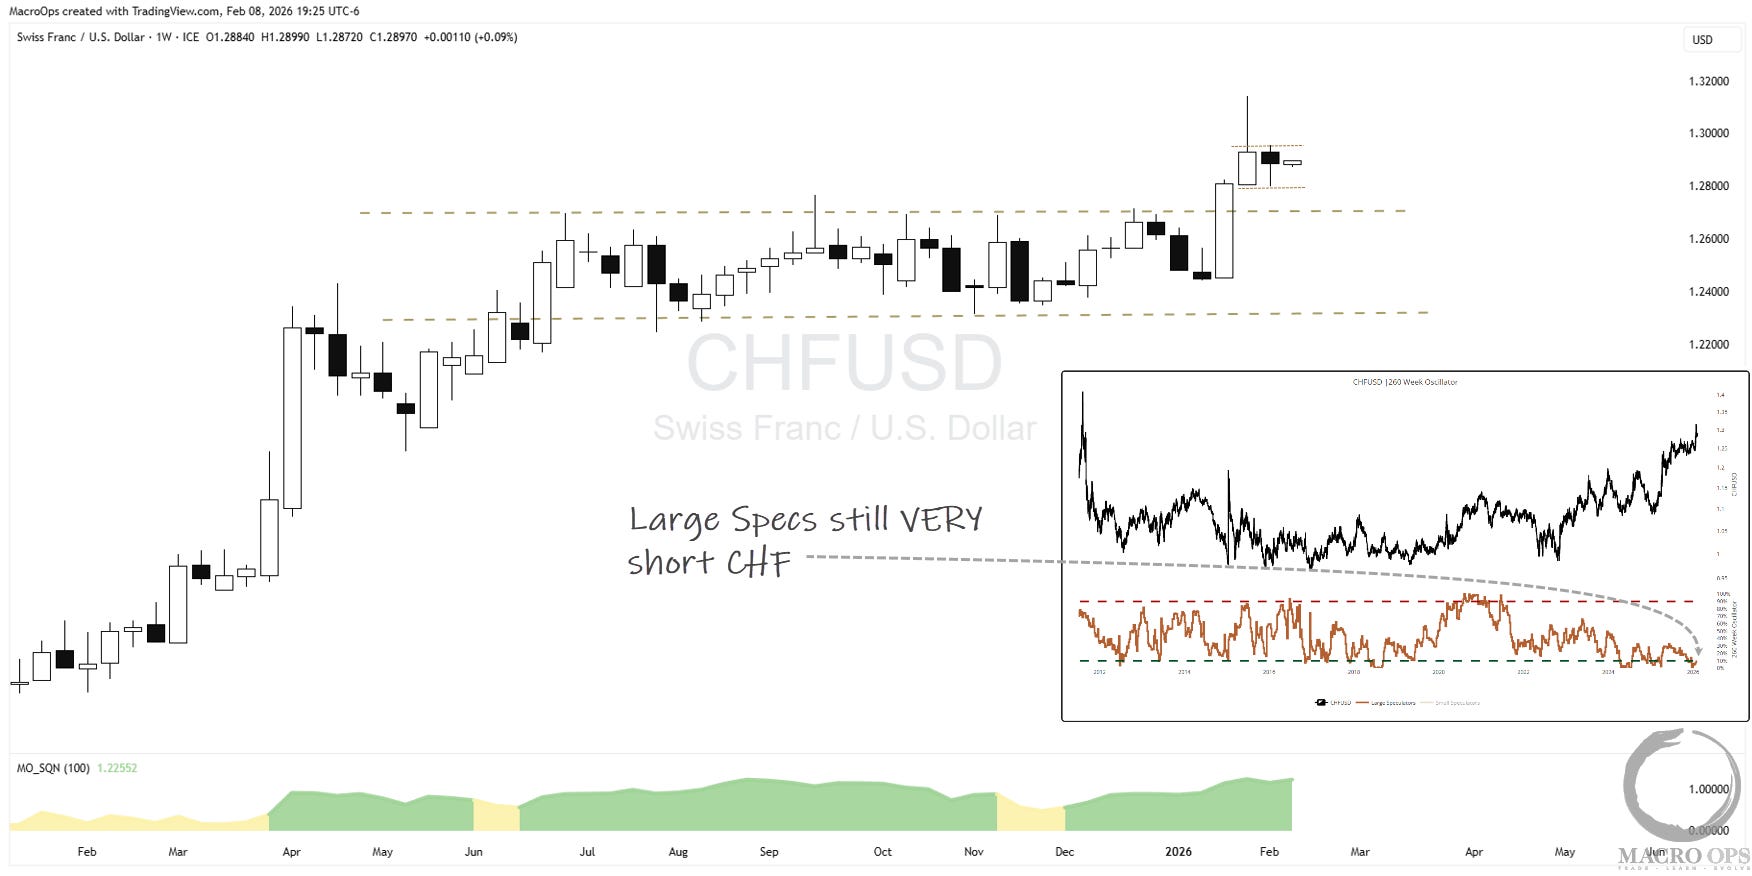
9. The Swissie is wedging after a breakout from a large 9-month rectangle / compression regime. We bought on the breakout, took partial profit on the quick move, and are looking to add on a move above last week’s high. Also, Large Specs remain very short.
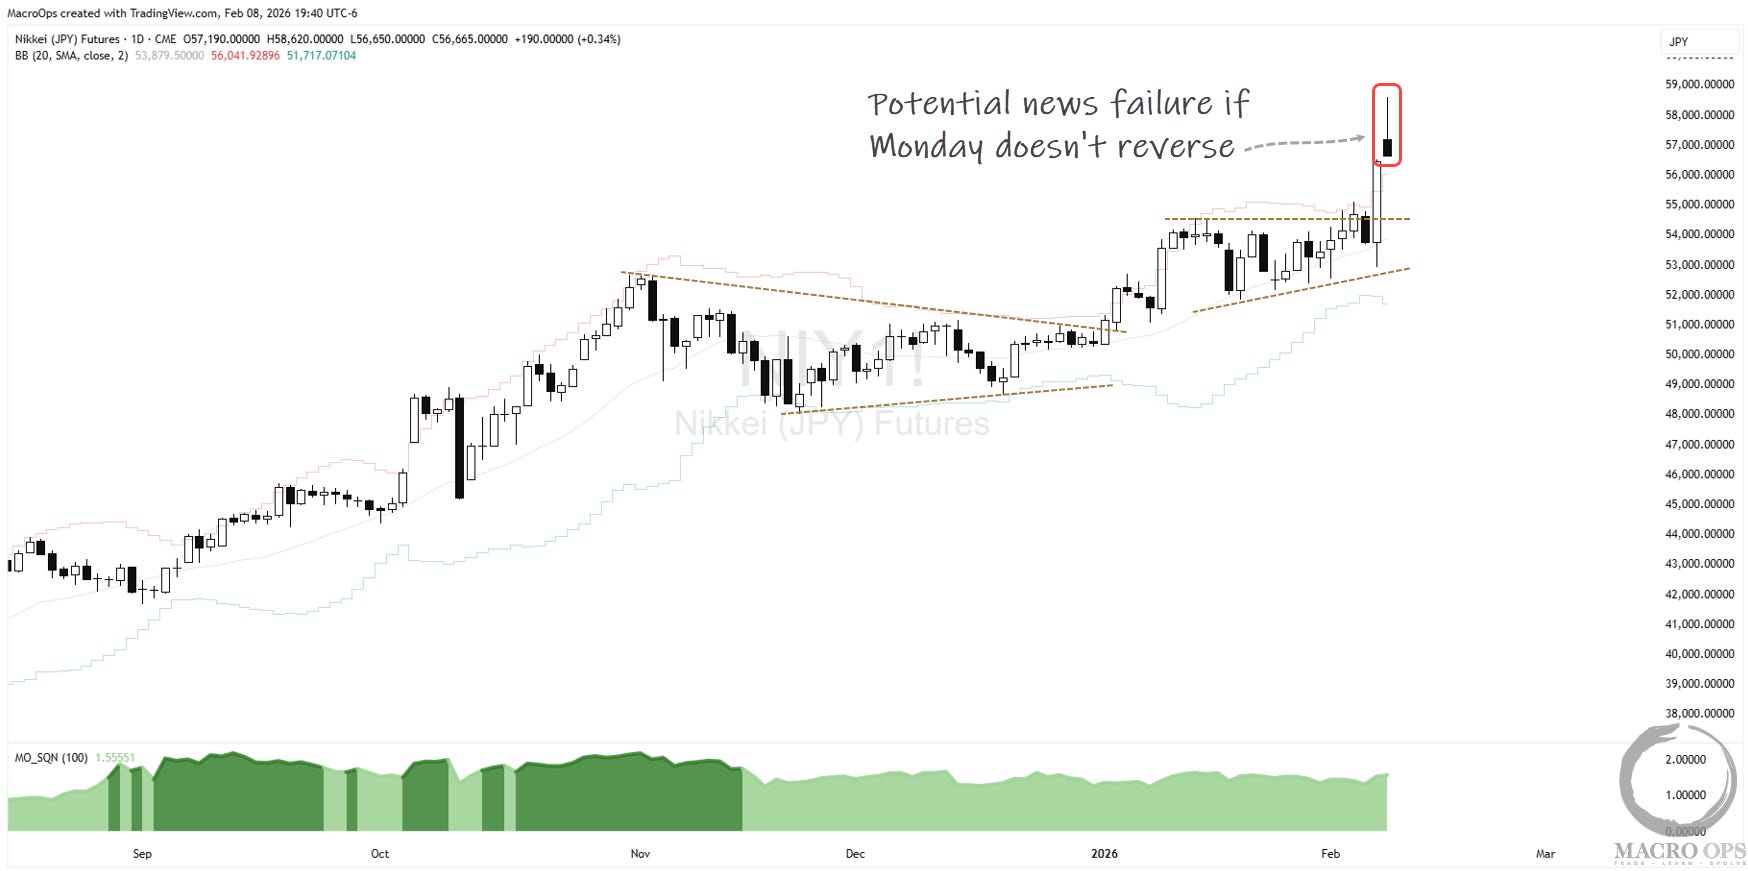
10. The Nikkei broke out last week from a compression/wedge within a Bull Quiet regime. We had buy stops triggered on Friday’s move to add to our existing long position. The market gapped up on Sunday’s open (as I write this) on the results of Takaichi’s LDP victory in the snap elections, where they secured 316 seats, giving them a comfortable supermajority, and the political capital to pursue their full fiscal agenda. It appears to be reversing, and we’ll have to see how it closes, but if it closes red on the day, that’d be a notable news failure.
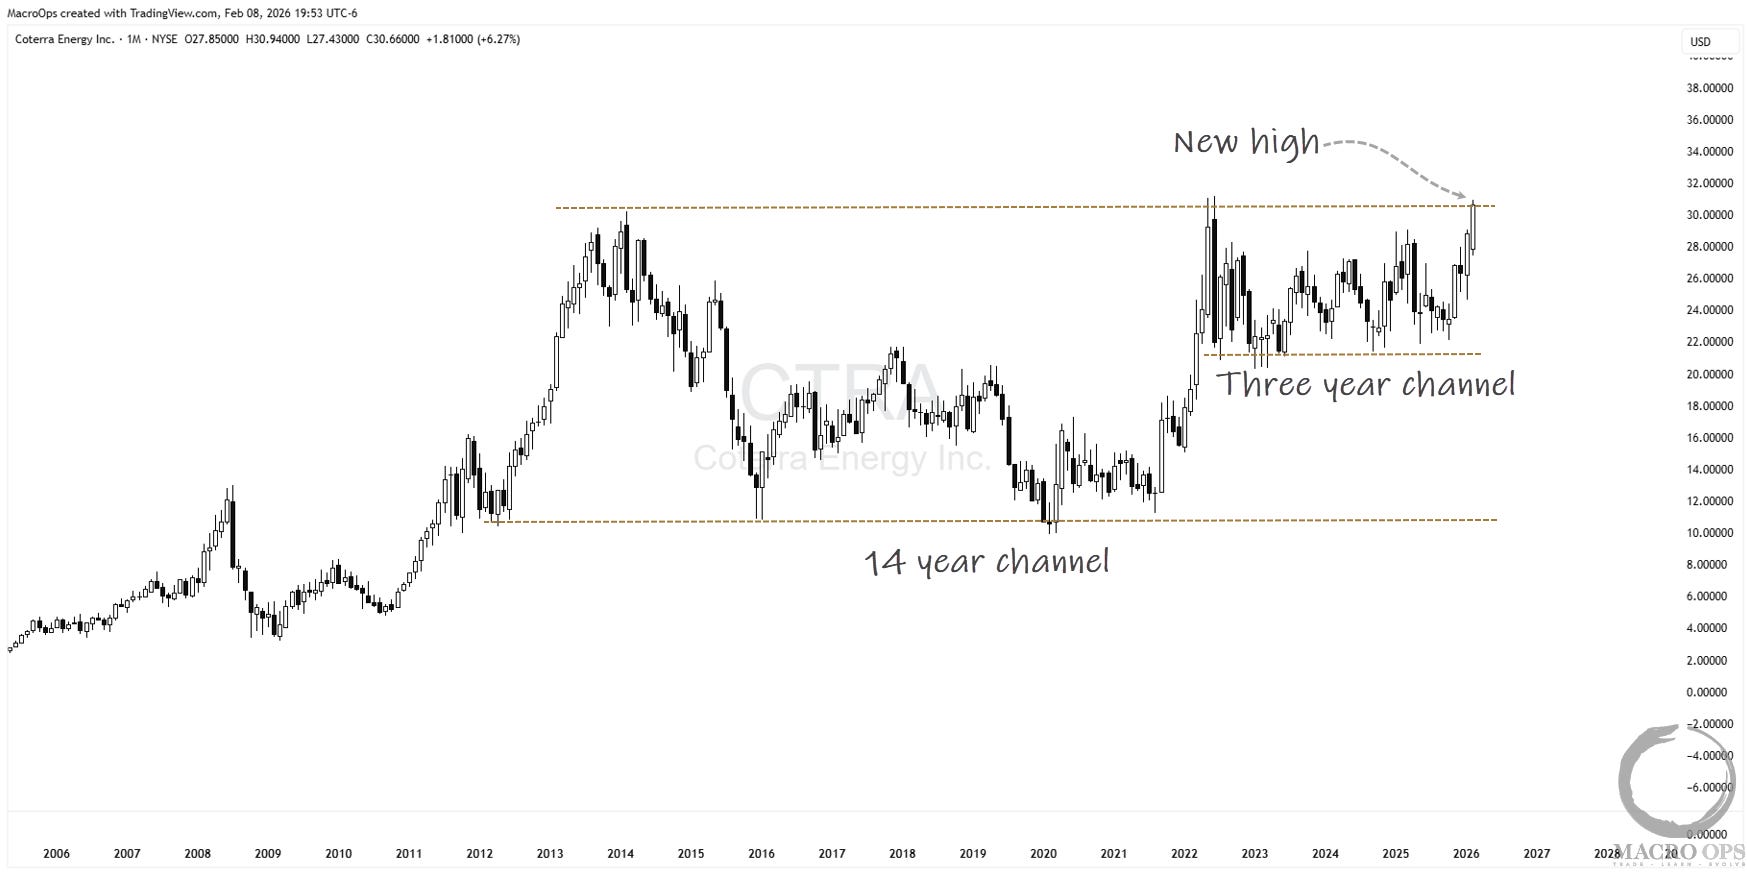
11. For the past month, our focus has been on industrials and energy, and that hasn’t changed. Last week, I shared the chart of CVX, which has broken out. Here’s another one we’ll be adding to our book. Coterra Energy (CTRA) is breaking out of a 3-year channel within a larger 14-year channel. That’s a lot of pent-up energy for a run higher.
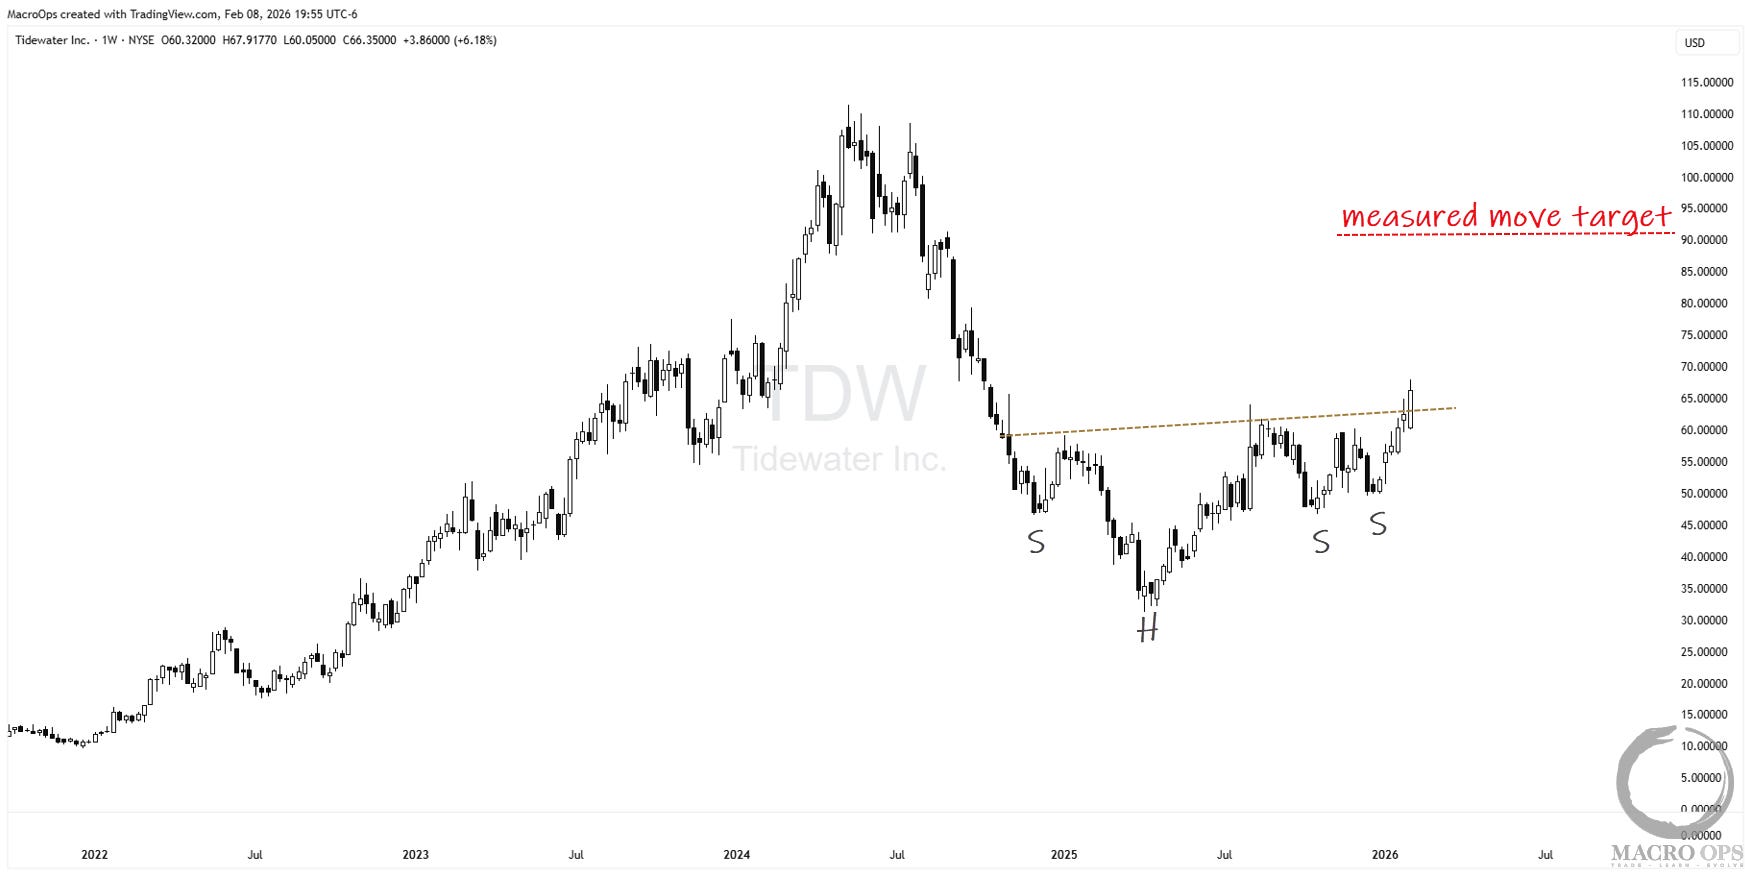
12. Here’s another… Tidewater (TDW), a name we’ve traded in and out of for the past few years, completed a 12m+ inverted H&S last week. We like this name for a number of reasons; my partner, Brandon, may revisit them in an upcoming Long Pull report. We’ll add this to the book soon.
Our resident Classical Chartist, Mike G, shared some great charts (including a few energy names) in his latest This Infinite Game report. I highly recommend giving it a read.
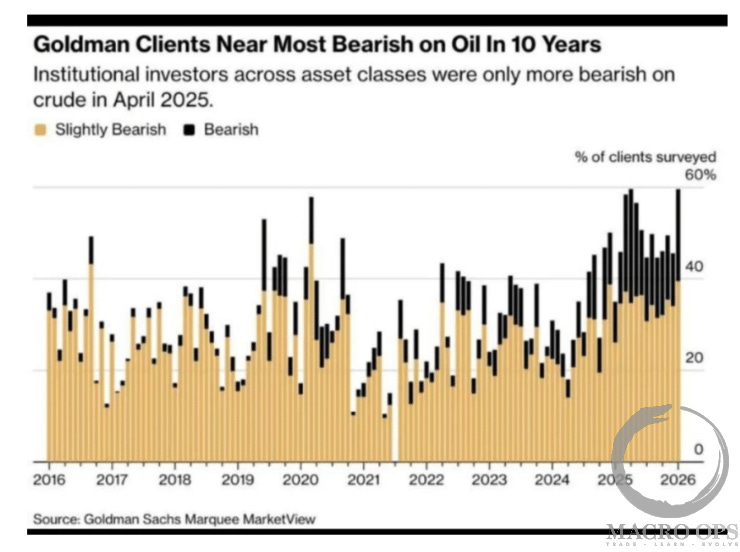
13. Bonus chart: Fade GS Clients… (h/t @JS for the chart)
Thanks for reading.
Your Macro Operator,
Alex