

Paradigm Shift, Meet Complacency…
Liquidity is deteriorating, margin is stretched, and the BTD crowd hasn't gotten the memo yet.

Summary: The weight of evidence favors more downside near-term. Bulls need to reclaim key levels — they haven’t. MO Liquidity Gauge hit its lowest reading since early ‘23 and is trending in the wrong direction — bad omen for forward 3-month equity returns. Sentiment and positioning nowhere near a full washout. Retail buying and margin levels near highs. Not a great look for risk assets. On the opportunity side — 2y USTs broke below a key range within a large compression, signaling a potential trend change. Coal is a major beneficiary from the conflict in the ME. And crypto is coiling.
QOTW via @Jesse_Livermore: “Best analogue I can think of for today’s market vibe is the period in mid Feb 2020 bf Covid when the news flow was uniformly negative but people weren’t selling bc they were bulled up on other themes and were scared of missing the uptrend that was set to resume once Covid faded.”
Jesse is spot on. We’re living through a major paradigm shift — multiple, actually — and the market remains deeply anchored to the recent past (as it has a tendency to do, see my AI Micron bull these from back in 2020 to learn why). The vol suppression, BTD mentality isn’t going away quietly. The next 6-12 months could be a very rude awakening.
MO Portfolio & Trades
1. The MO portfolio gained +280bps on the week and sits at +42.88% on the year.
We continue to hold elevated cash. Our core positions: long crude, short USTs, short NQ, long HRW Wheat, and long the BBG Commodities ETF.

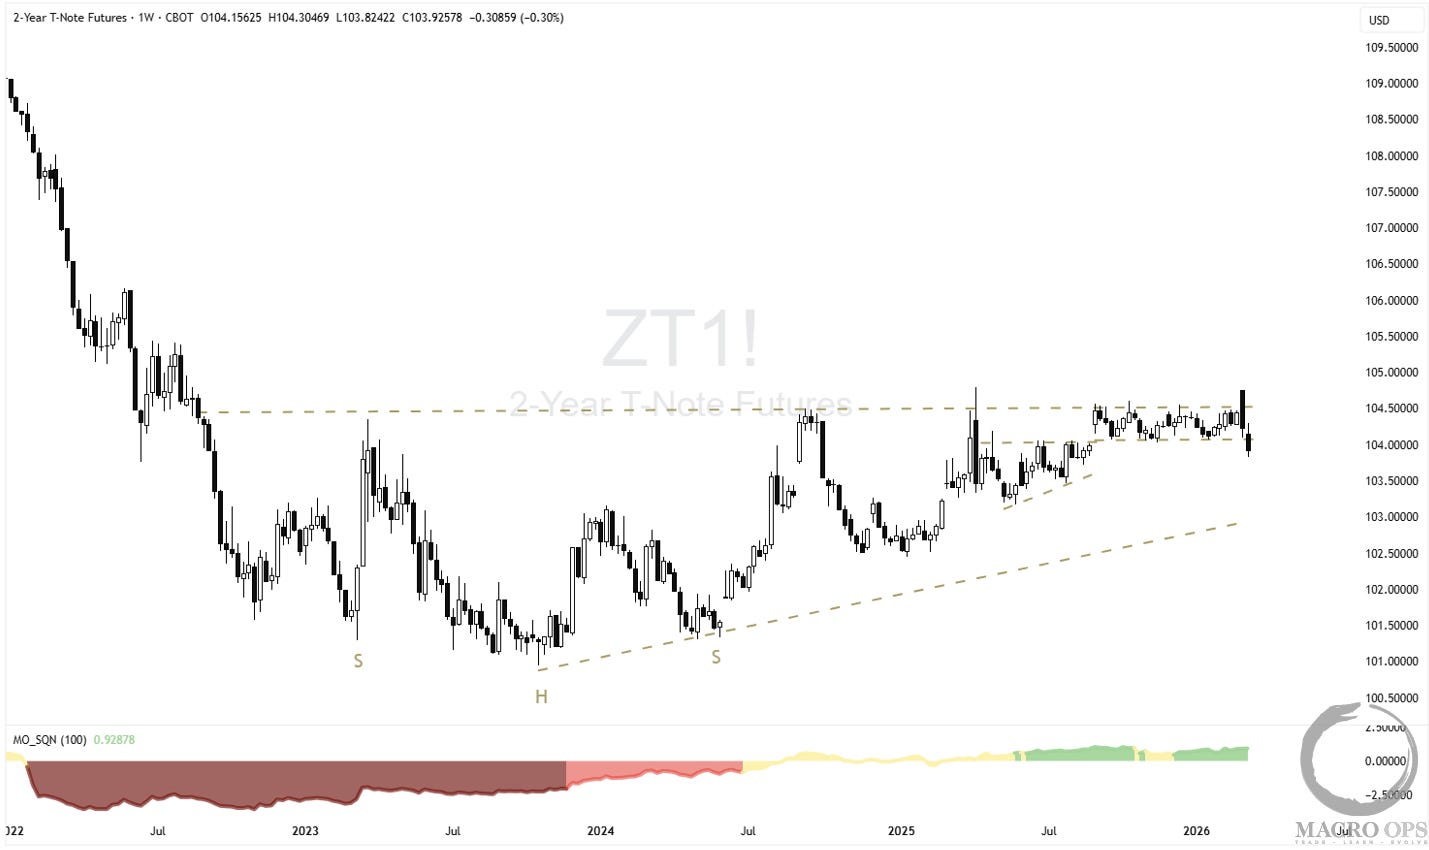
2. Two weeks ago we flagged the bearish setup in the long end of the curve (link here) — that continues to play out. Last week we went short 2s on their bearish breakdown from a tight compression regime, following a bull trap the week prior.
Fed meeting this week. We’ll adjust fire as needed.
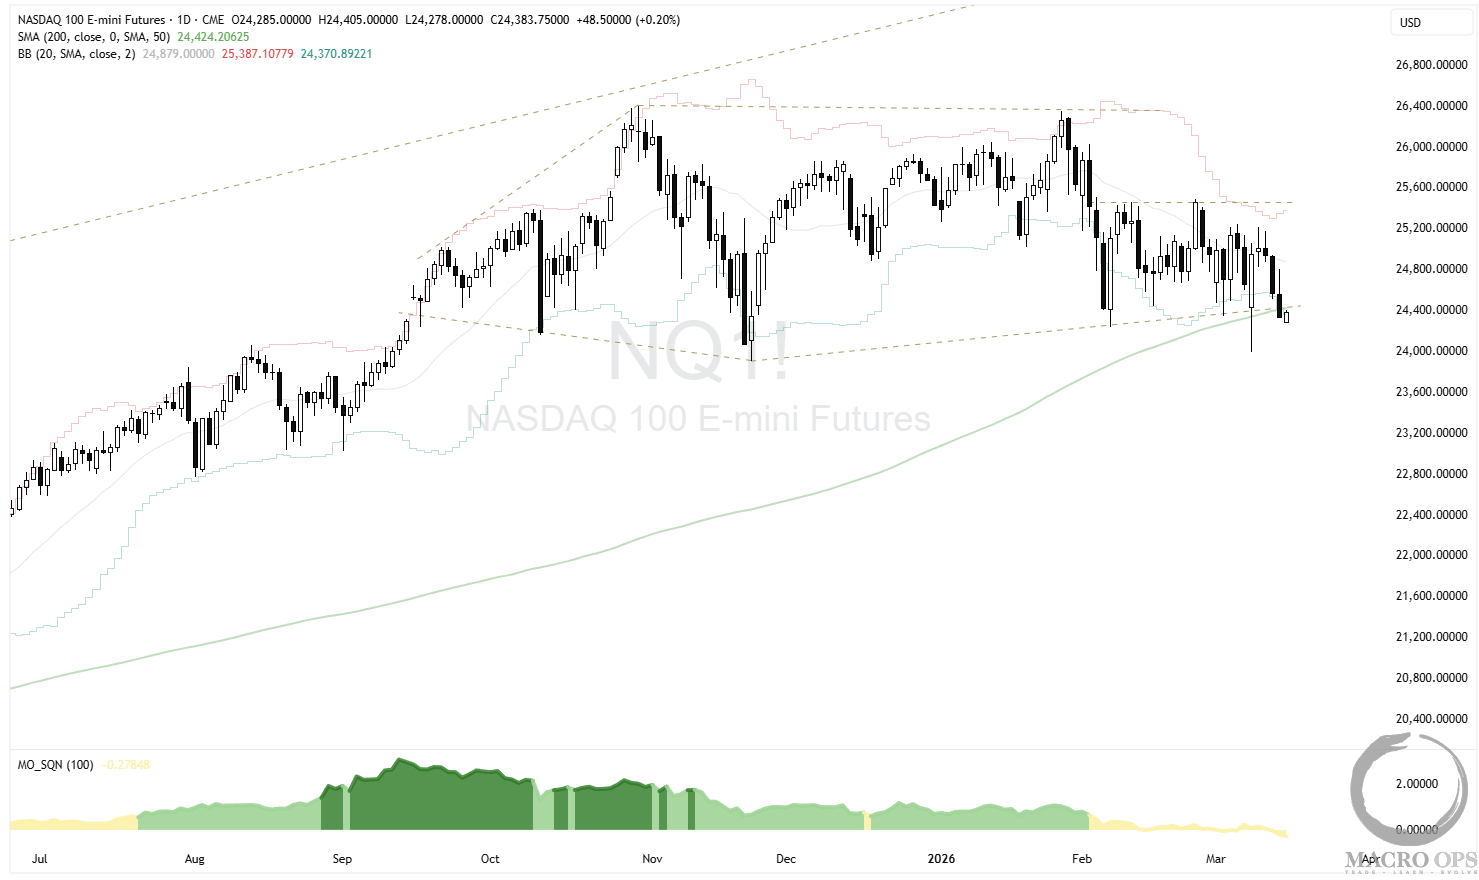
3. We started last week short the Qs and added to the position as the week progressed. They’ve since closed below key levels on the daily and are now trading under their 200dma — the tape is confirming the thesis.
Nomura’s Charlie McElligott framed the broader dynamic well:
“The ‘Lazy Leverage’ that accumulated during sustained low vol is now being mechanically risk-managed lower as Commodity/Inflation/Rate-Vol risks simultaneously reprice... because the dirty secret is that every asset class is short interest rate volatility.”
Hard to say it better than that.
Trifecta Charts
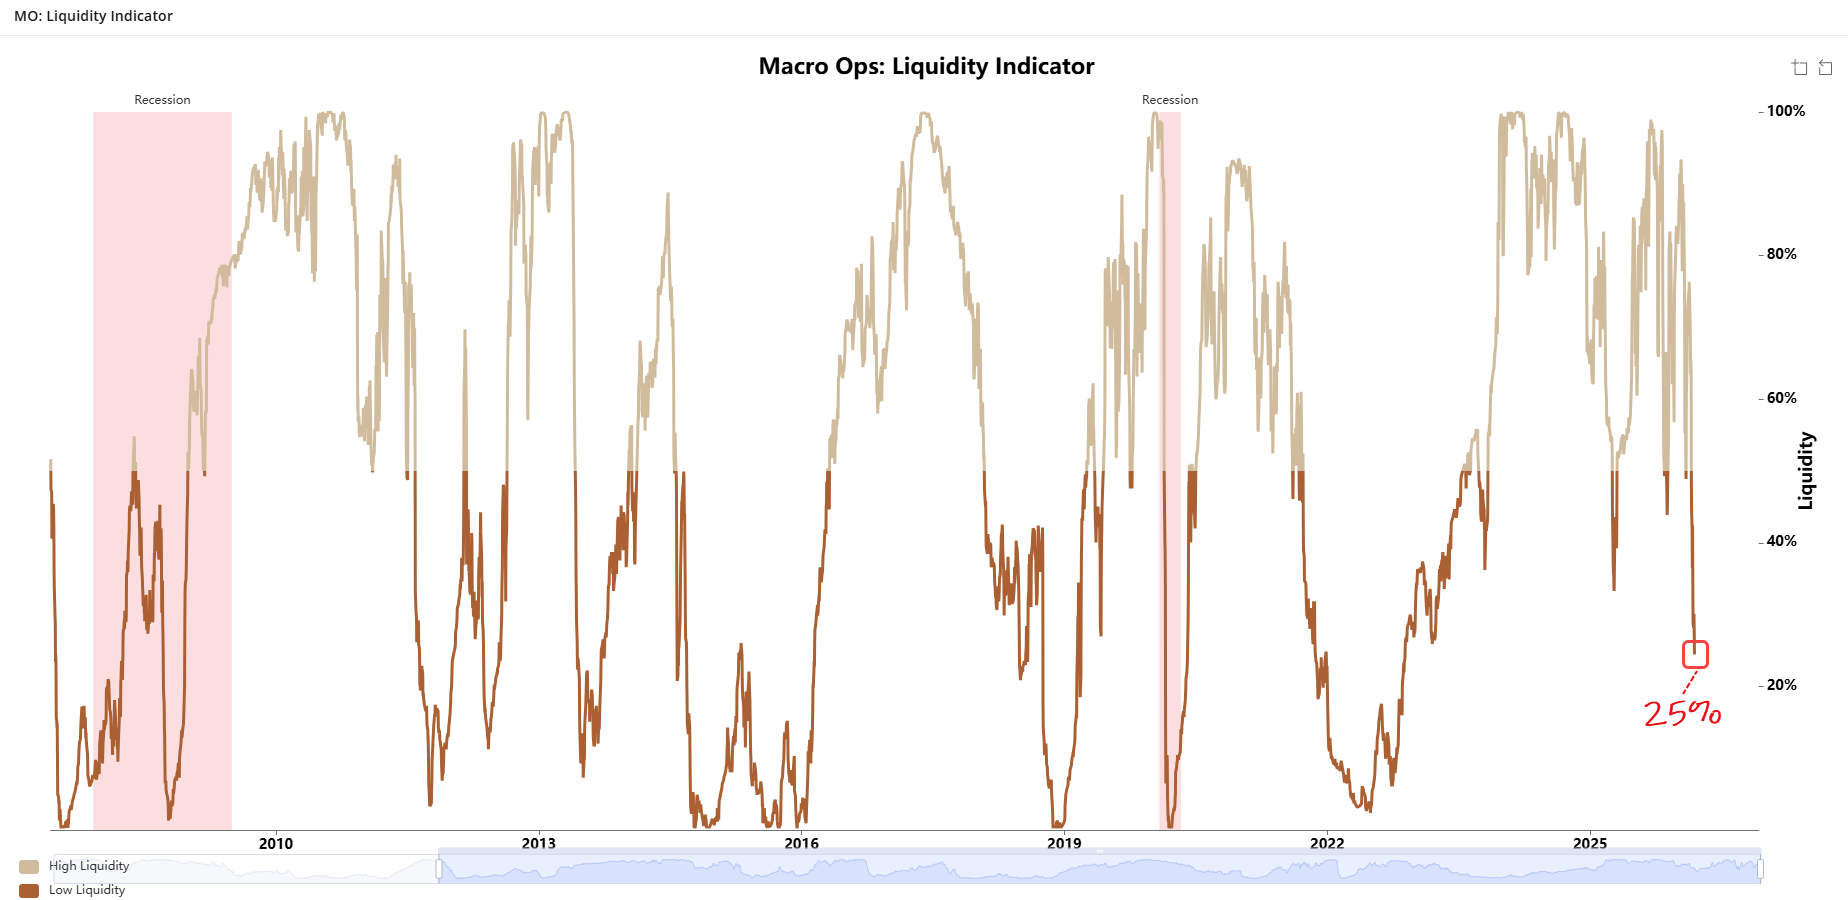
4. The MO Liquidity Gauge fell again last week to 25% — its lowest reading in three years — and historically, that combination of level and trend bodes ill for forward 3-month equity returns.
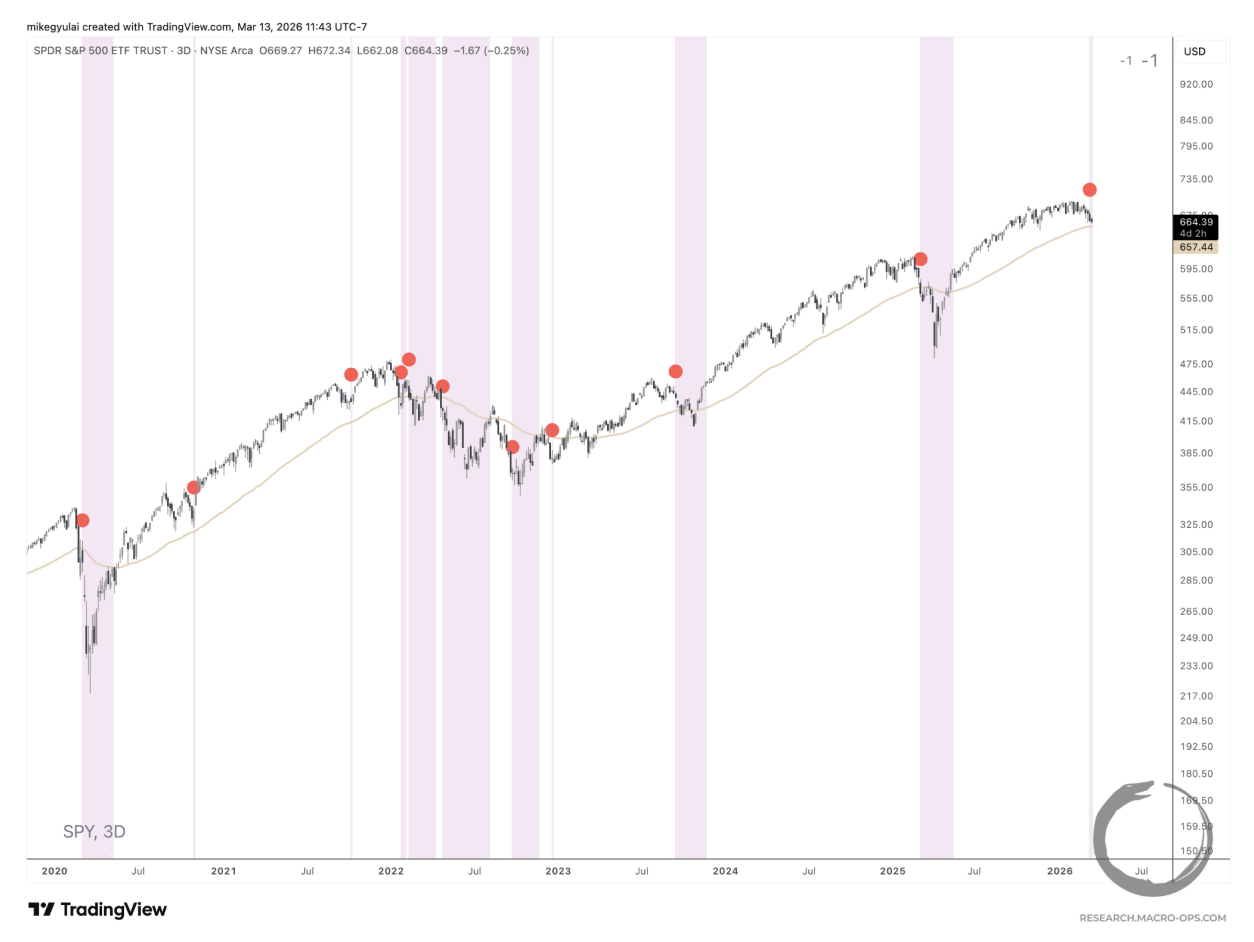
5. Our Head Technical Analyst Mike Gyulai’s Quantitative Trend Stability Model recently flipped bearish. In his latest note, Mike walks through what that signal means and how he adjusts his strategy in bearish regimes (link here
6. Still a ways to go until we get to a proper positioning and sentiment reset.

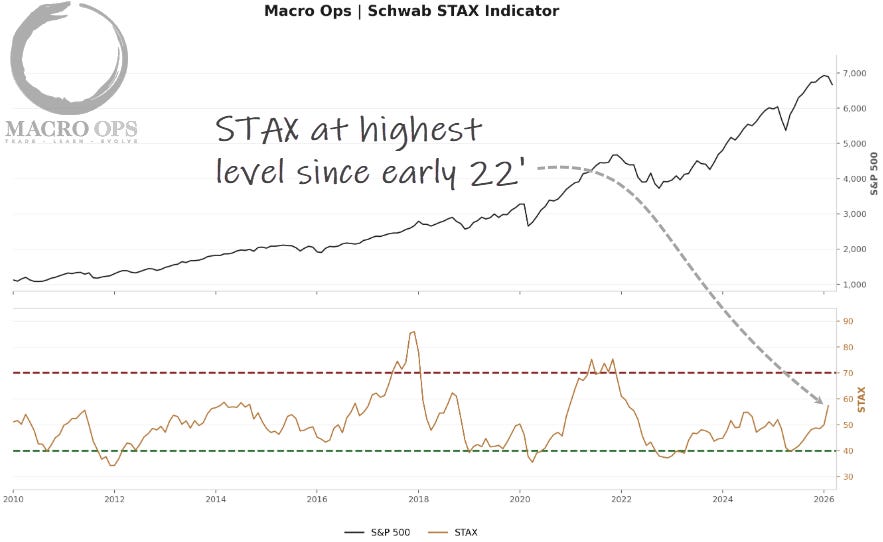
7. Retail flows have been the primary force sustaining this market for the past six-plus months. Schwab’s STAX index — which tracks actual retail activity — recently climbed to its highest reading since early ‘22.
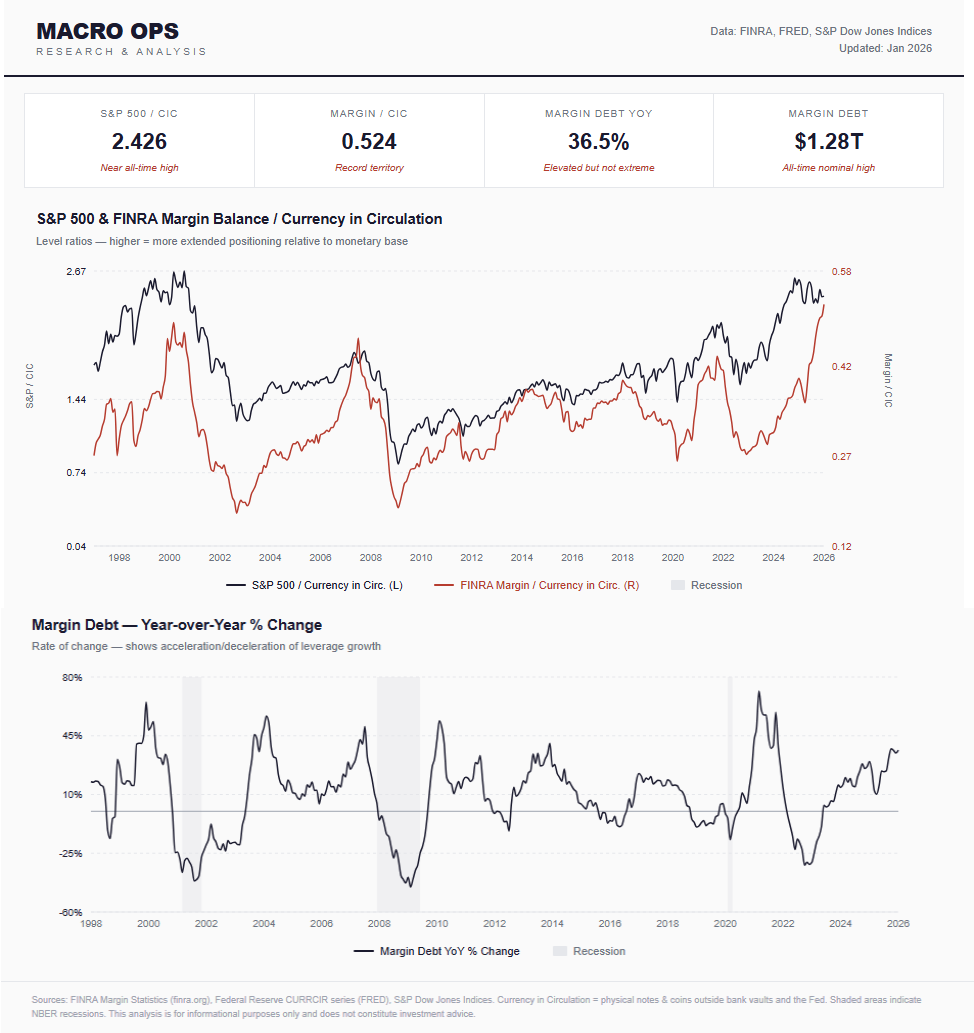
8. Meanwhile, FINRA Margin Balance/Currency in Circulation is at an all-time high and straight margin is accelerating on a YoY basis. In any other environment, that would be noteworthy. Given current valuations — and the general state of the world — it’s a striking level of complacency.
9. On valuations — HF manager Colm O’Shea recently launched a Substack (link here) and his latest post is worth your time:
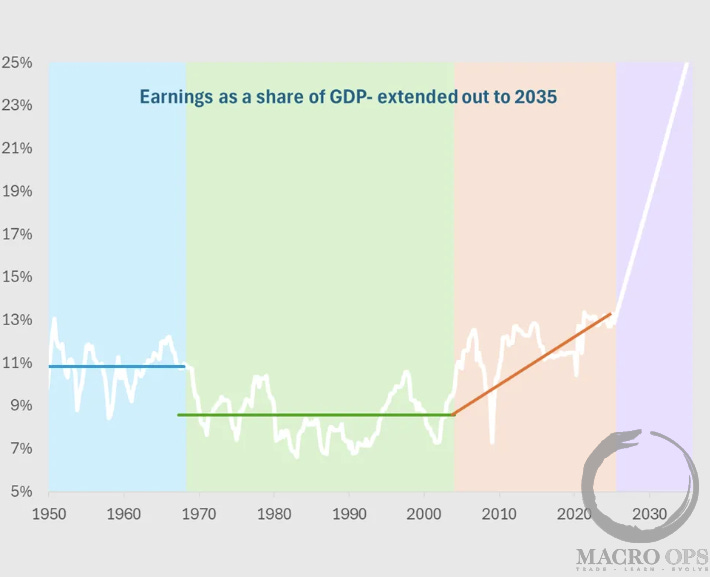
“Current valuations show the same level of optimism about future earnings growth as the 2000 dot-com bubble — except today’s earnings base is far higher. It is that combination that makes the current setup so extreme. What would earnings growth need to look like over the next decade for your stock market investment to simply keep pace with GDP growth? The chart below shows.”
Macro
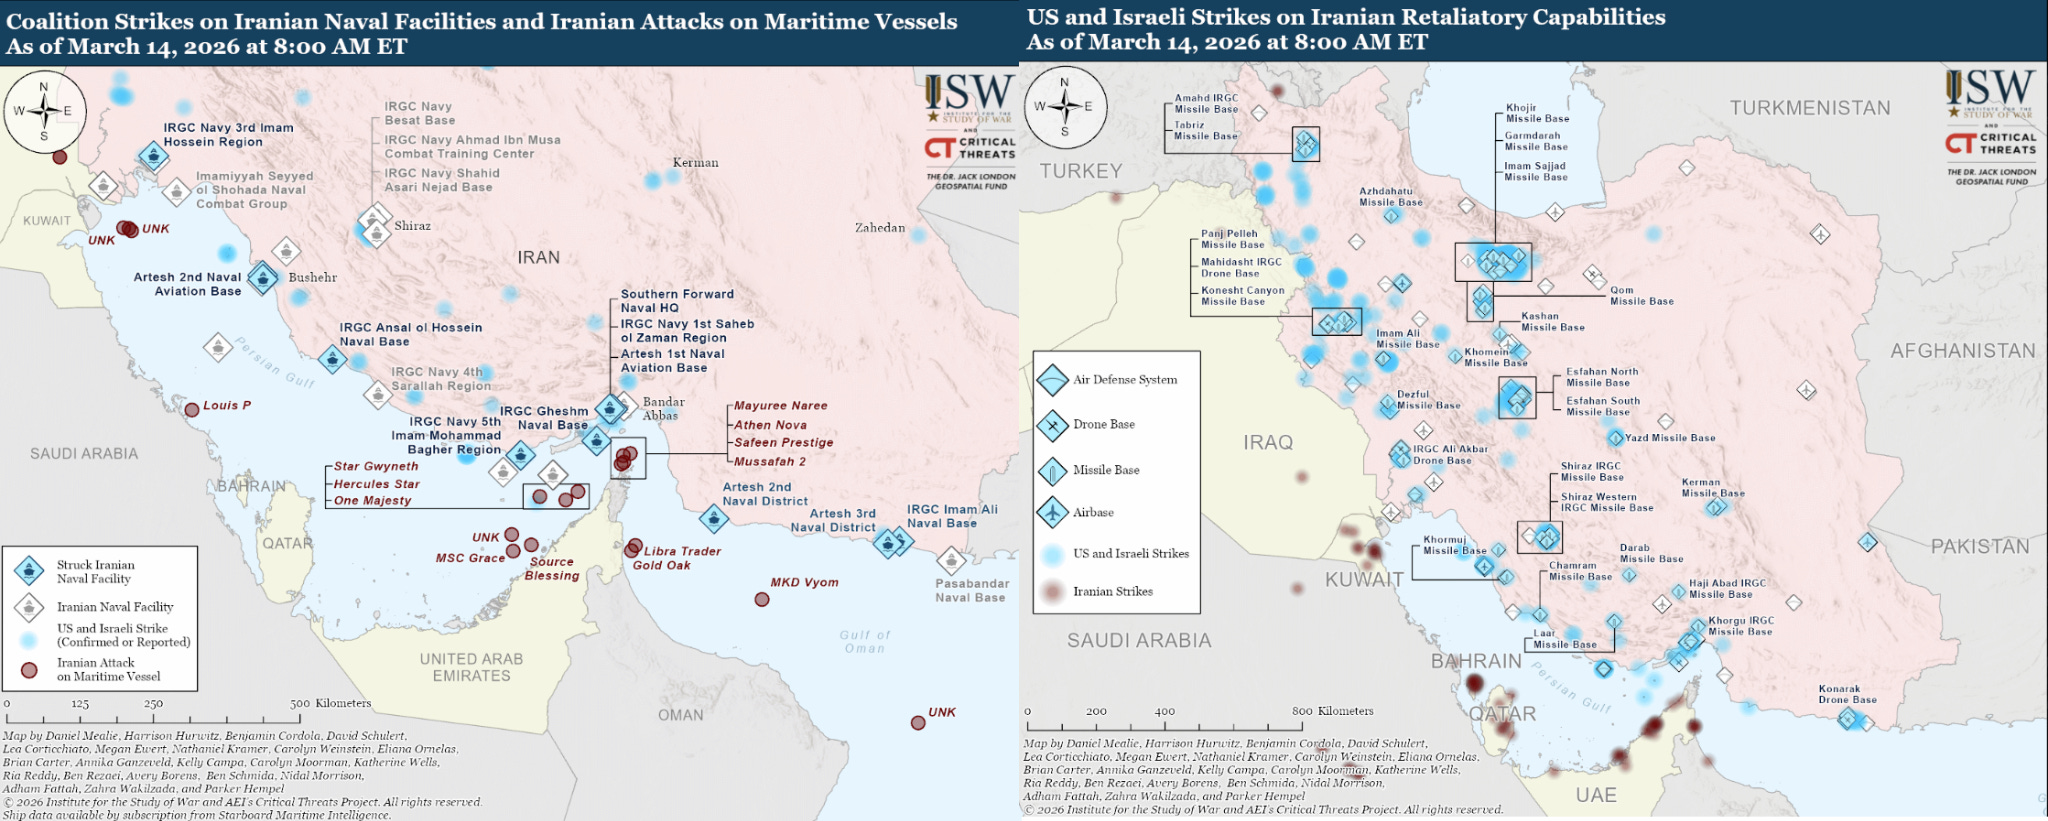
10. The Institute for the Study of War recently published maps tracking the conflict’s progression. The takeaway: the US is methodically degrading Iran’s drone and missile arsenal — the backbone of its war strategy. Iran is still throwing punches, but they’re not landing with the force an existential conflict requires. There’s more work to do, but writing this campaign off now is jumping the gun.Worth noting — ISW is writing primarily to US military objectives, which aren’t necessarily the same as strategic ones. An important distinction.
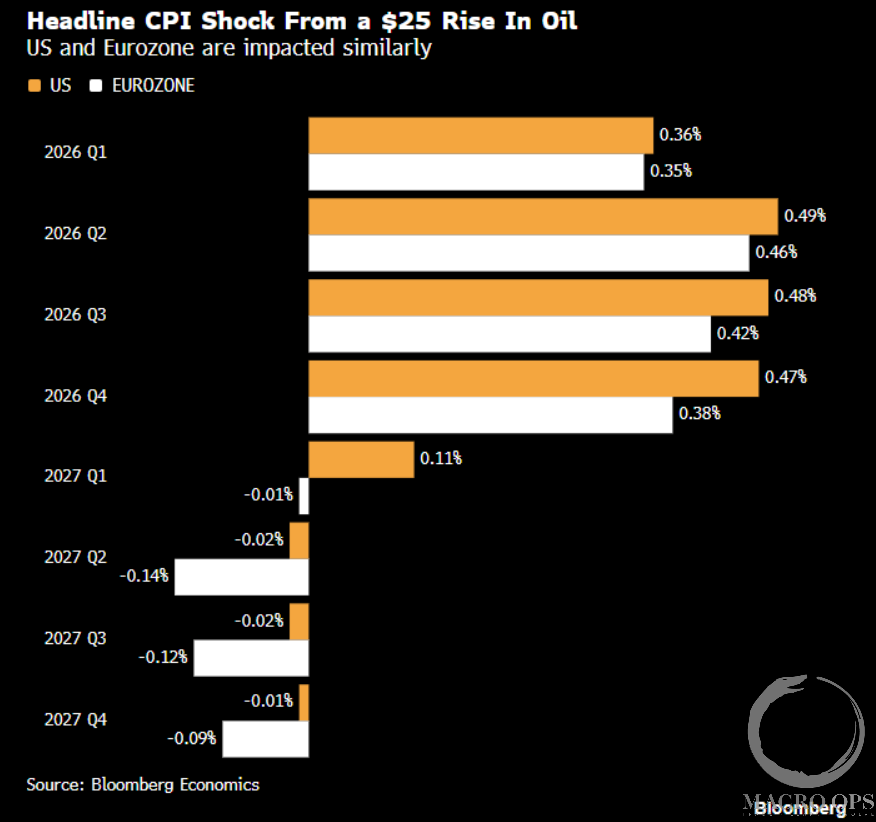
11. Oil’s impact on CPI via BBG.
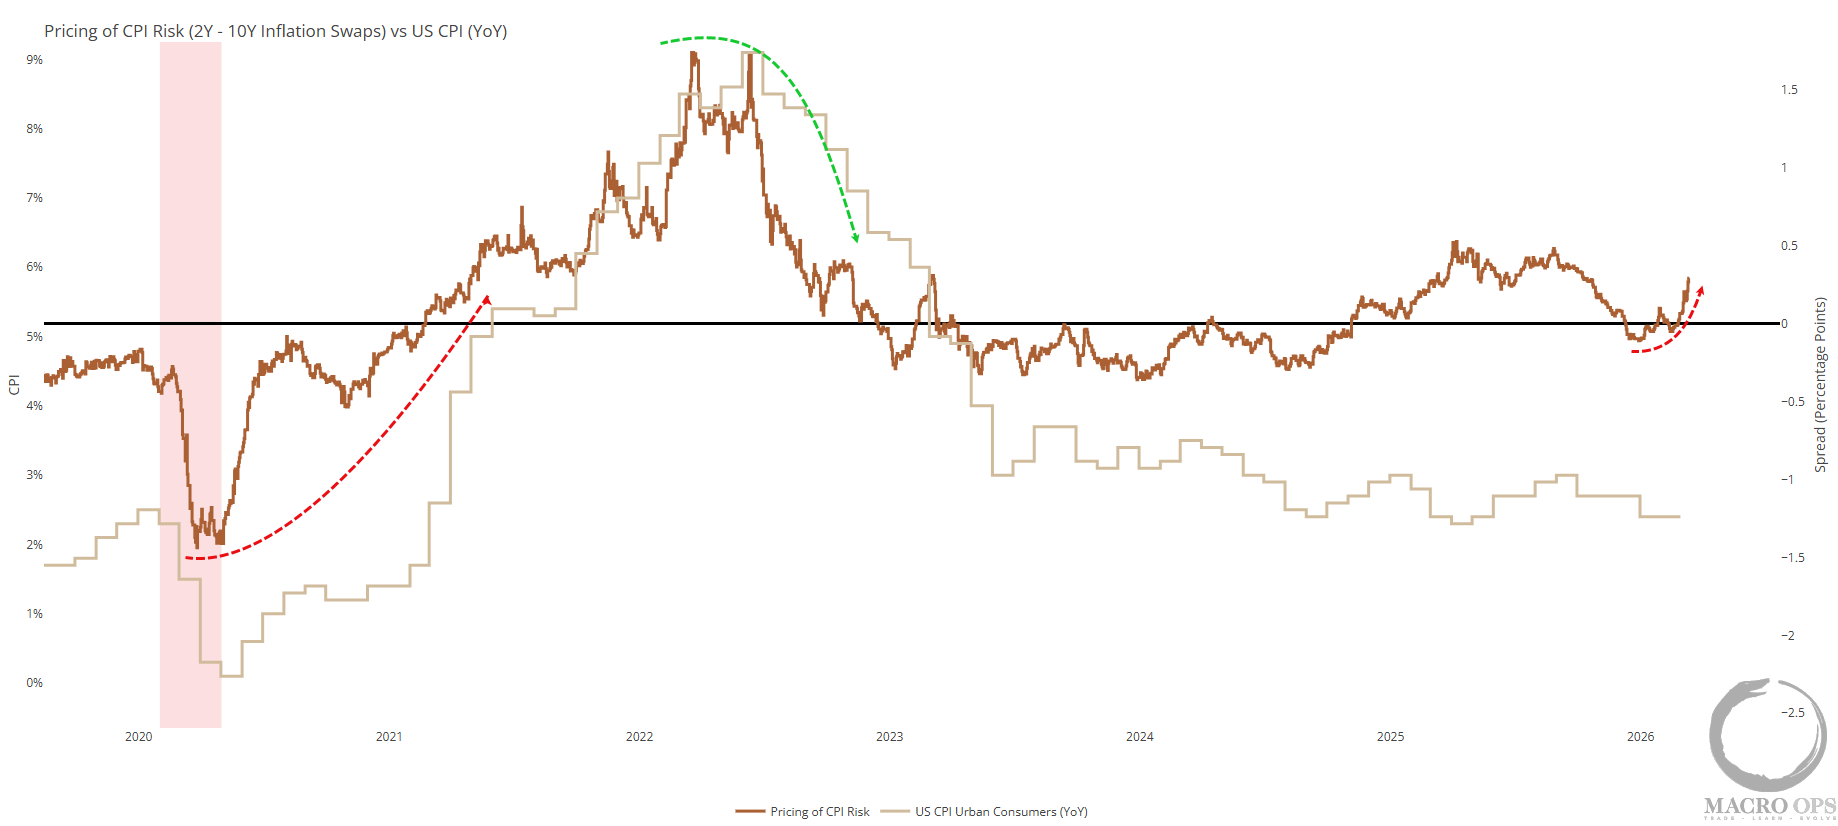
12. Inflation swaps are starting to hockey stick higher. We were already expecting rising inflation in the back half of the year, but it’s looking less like a forecast and more like a foregone conclusion.
Trade Setups / Topical Charts
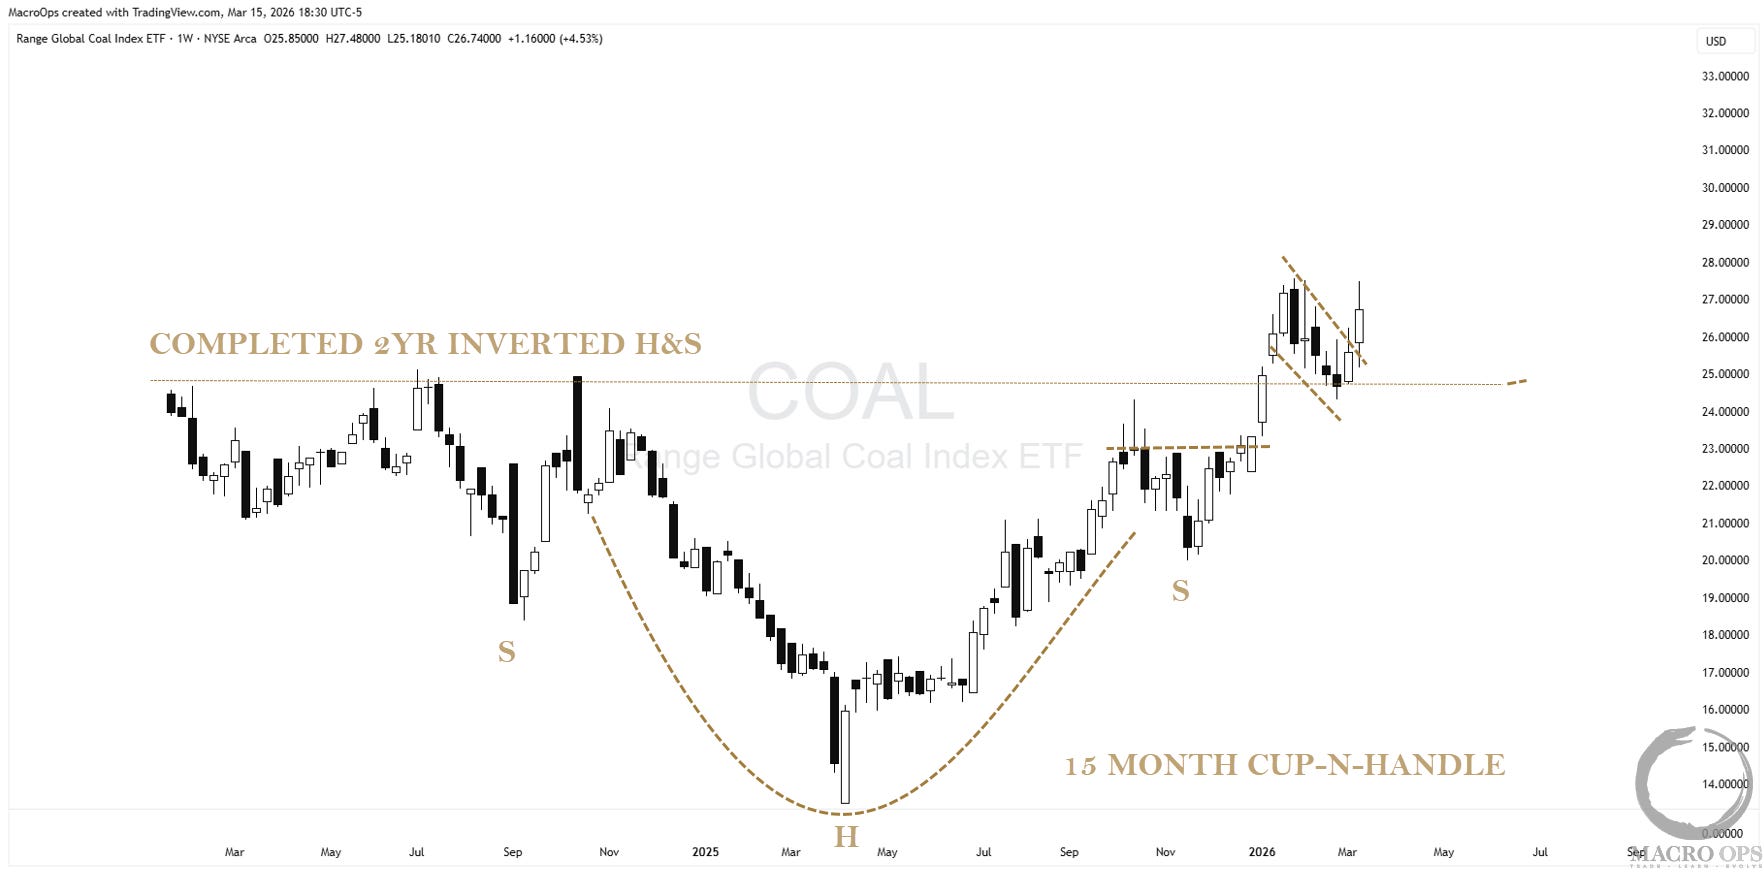
13. Coal stocks are the obvious beneficiary if Hormuz stays choked and oil holds an elevated floor. The Global Coal Index ETF (COAL) monthly is worth pulling up — it’s showing a completed large inverted H&S nested inside a broader cup-and-handle. That’s a lot of constructive structure in one frame. The tape is telling a story here.
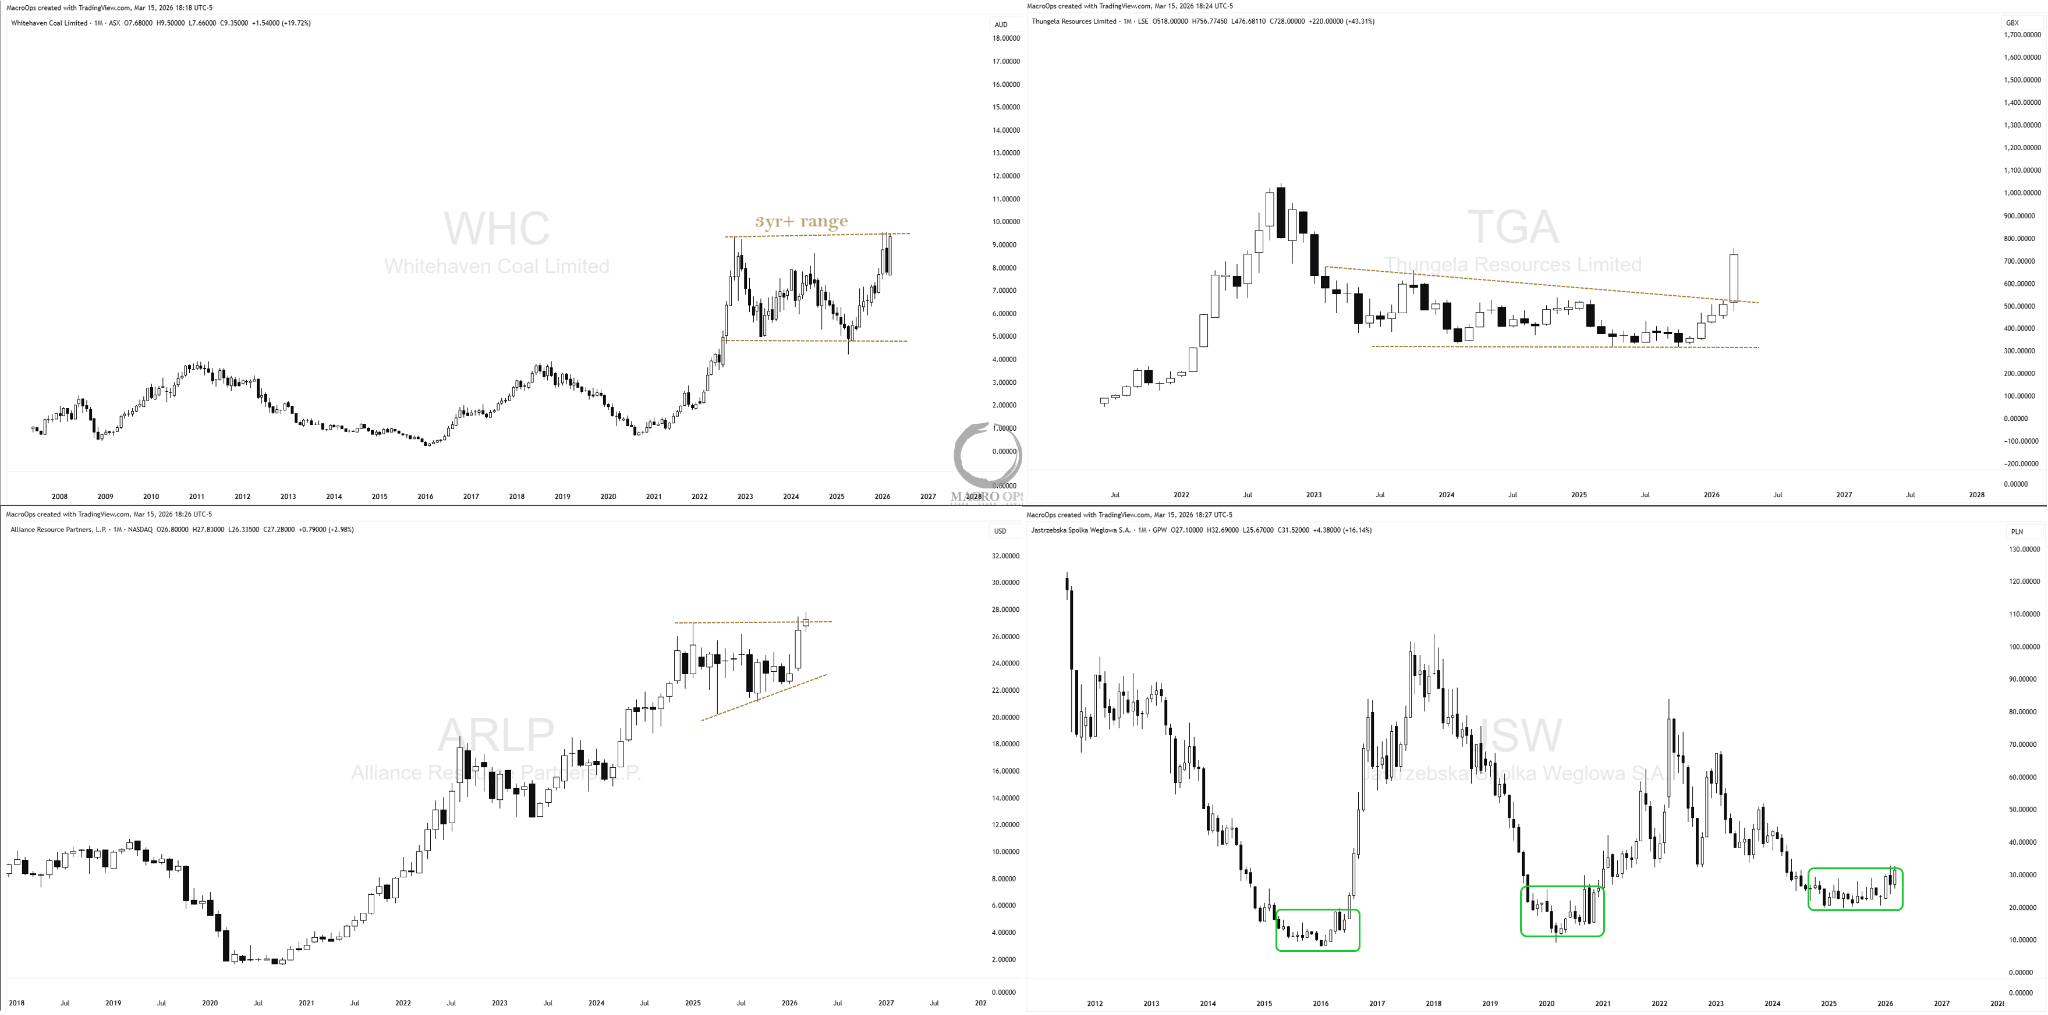
14. I ran through the index to find my favorites. Below are their monthly charts. TGA in particular is intriguing.
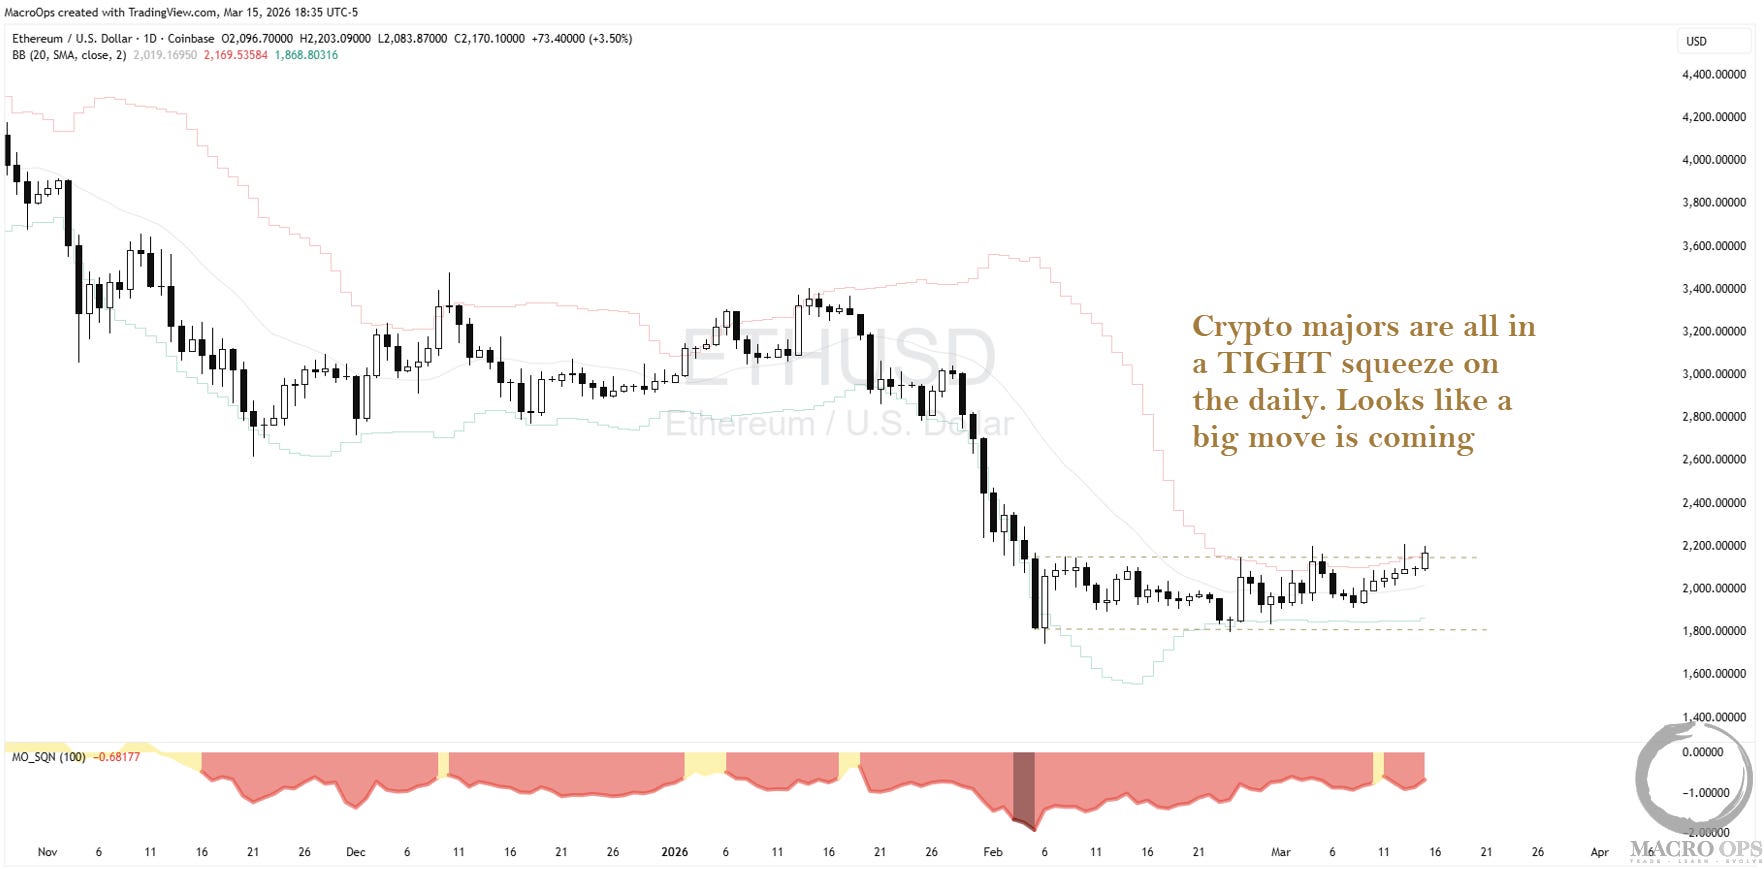
15. We’re short-term bearish on risk assets broadly, but crypto majors are worth watching. ETHUSD is holding a bid and diverging from general risk — running its own race, essentially. It’s also coiling in a tight compression regime, which means a move is coming. Direction TBD, but this one’s on the radar.
Thanks for reading.
Your Macro Operator,
Alex