


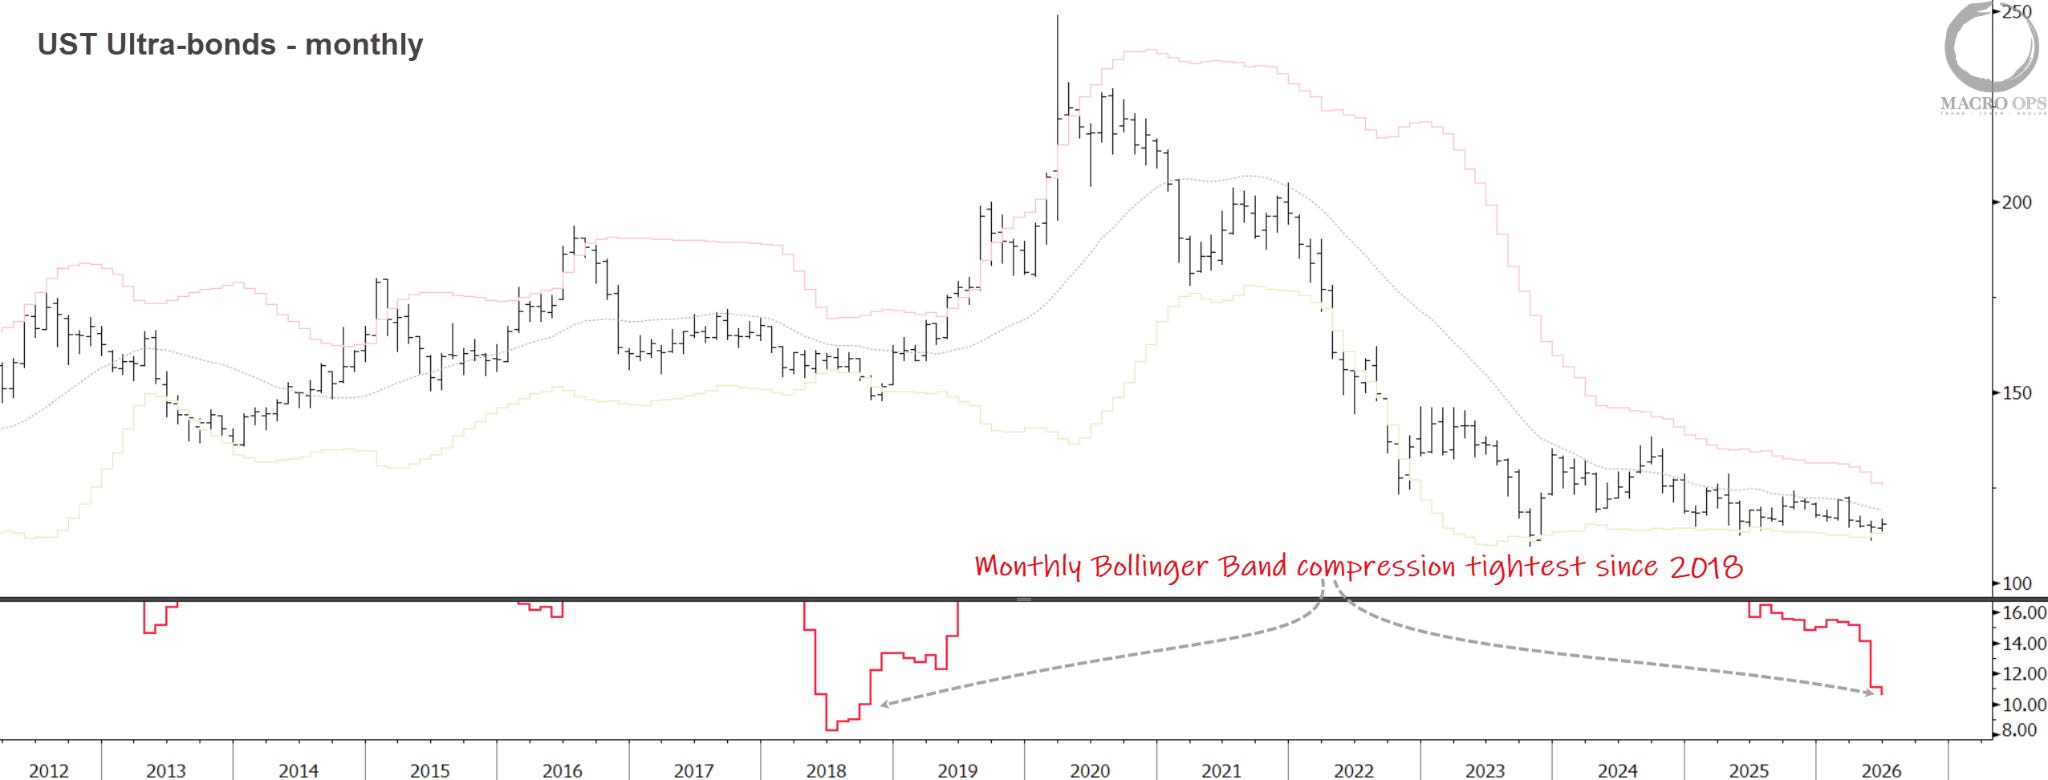
Summary: Bonds remain in a major compression regime. Our bias is for a breakdown lower, as we covered last week. But they’re short-term oversold, and positioning needs to lighten before the next leg down gets traction. Expect some reversion over the next few weeks. We’re looking to get long 2s and 10s on confirmed bullish advances.
The next two weeks are telling for DXY. It needs to hold its recent breakout. If it can’t, and this turns into a bull trap, GBP is the long — positioning there is the most crowded it’s been in history.
Breadth is broadening and diverging higher. That’s not a bearish signal. But there are early signs that volatility is building under the surface, and the next leg up in equities will be a rougher ride than the last.
We close with a full Trifecta setup in the insurance sector, and crypto remains a great short.
MO Portfolio & Trades
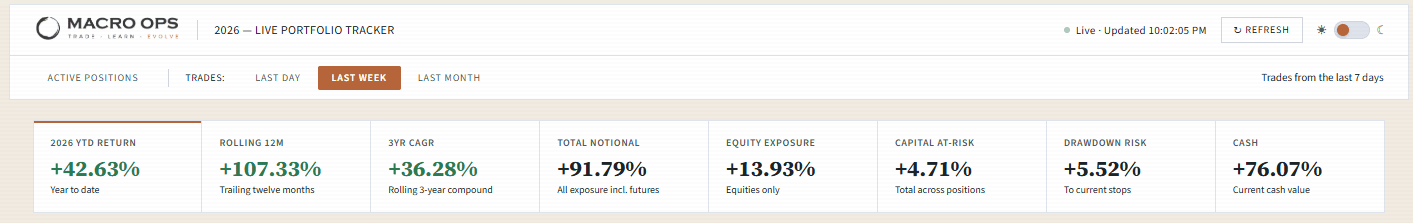
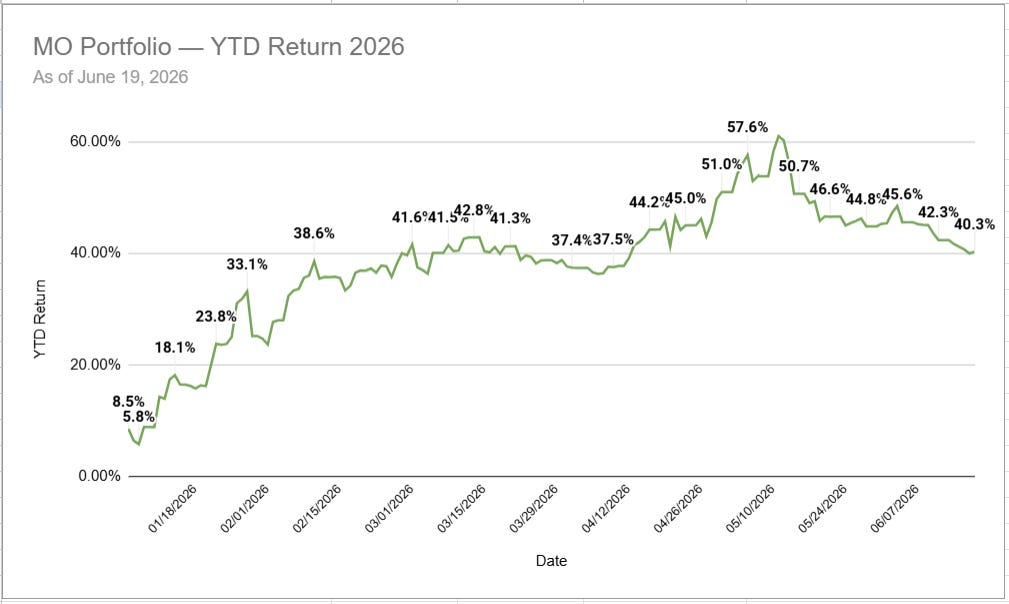
1. The portfolio ended last week up +230bps, bringing year-to-date returns to +42.6%, below our YTD NAV high of +61%.
Current positioning: elevated cash, long Nasdaq, long Russell2k, long biotech complex and cybersecurity names.
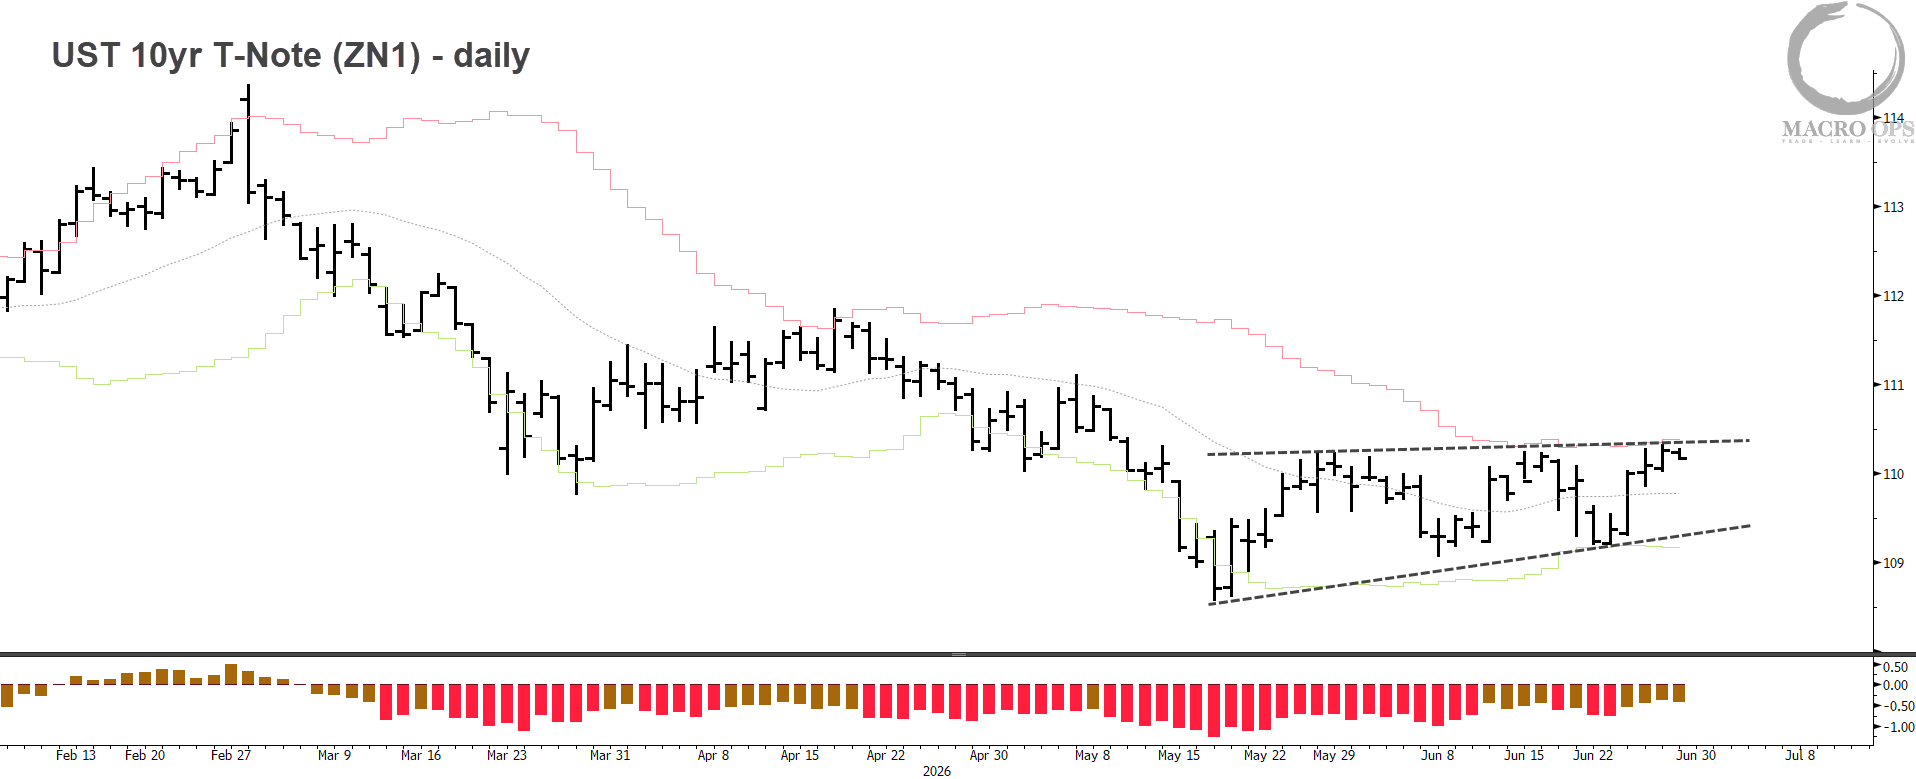
2. Bonds continue their compression on the monthly tape with BB width at its tightest range since 2018. Compression regimes precede big trends but are directionally agnostic, though our bias is for a breakout to the downside (more on this below).
3. Last week we made the case for higher rates, eventually… I say eventually because bonds are both short-term oversold, up against major support, and positioning has flipped decidedly bearish (see chart below).
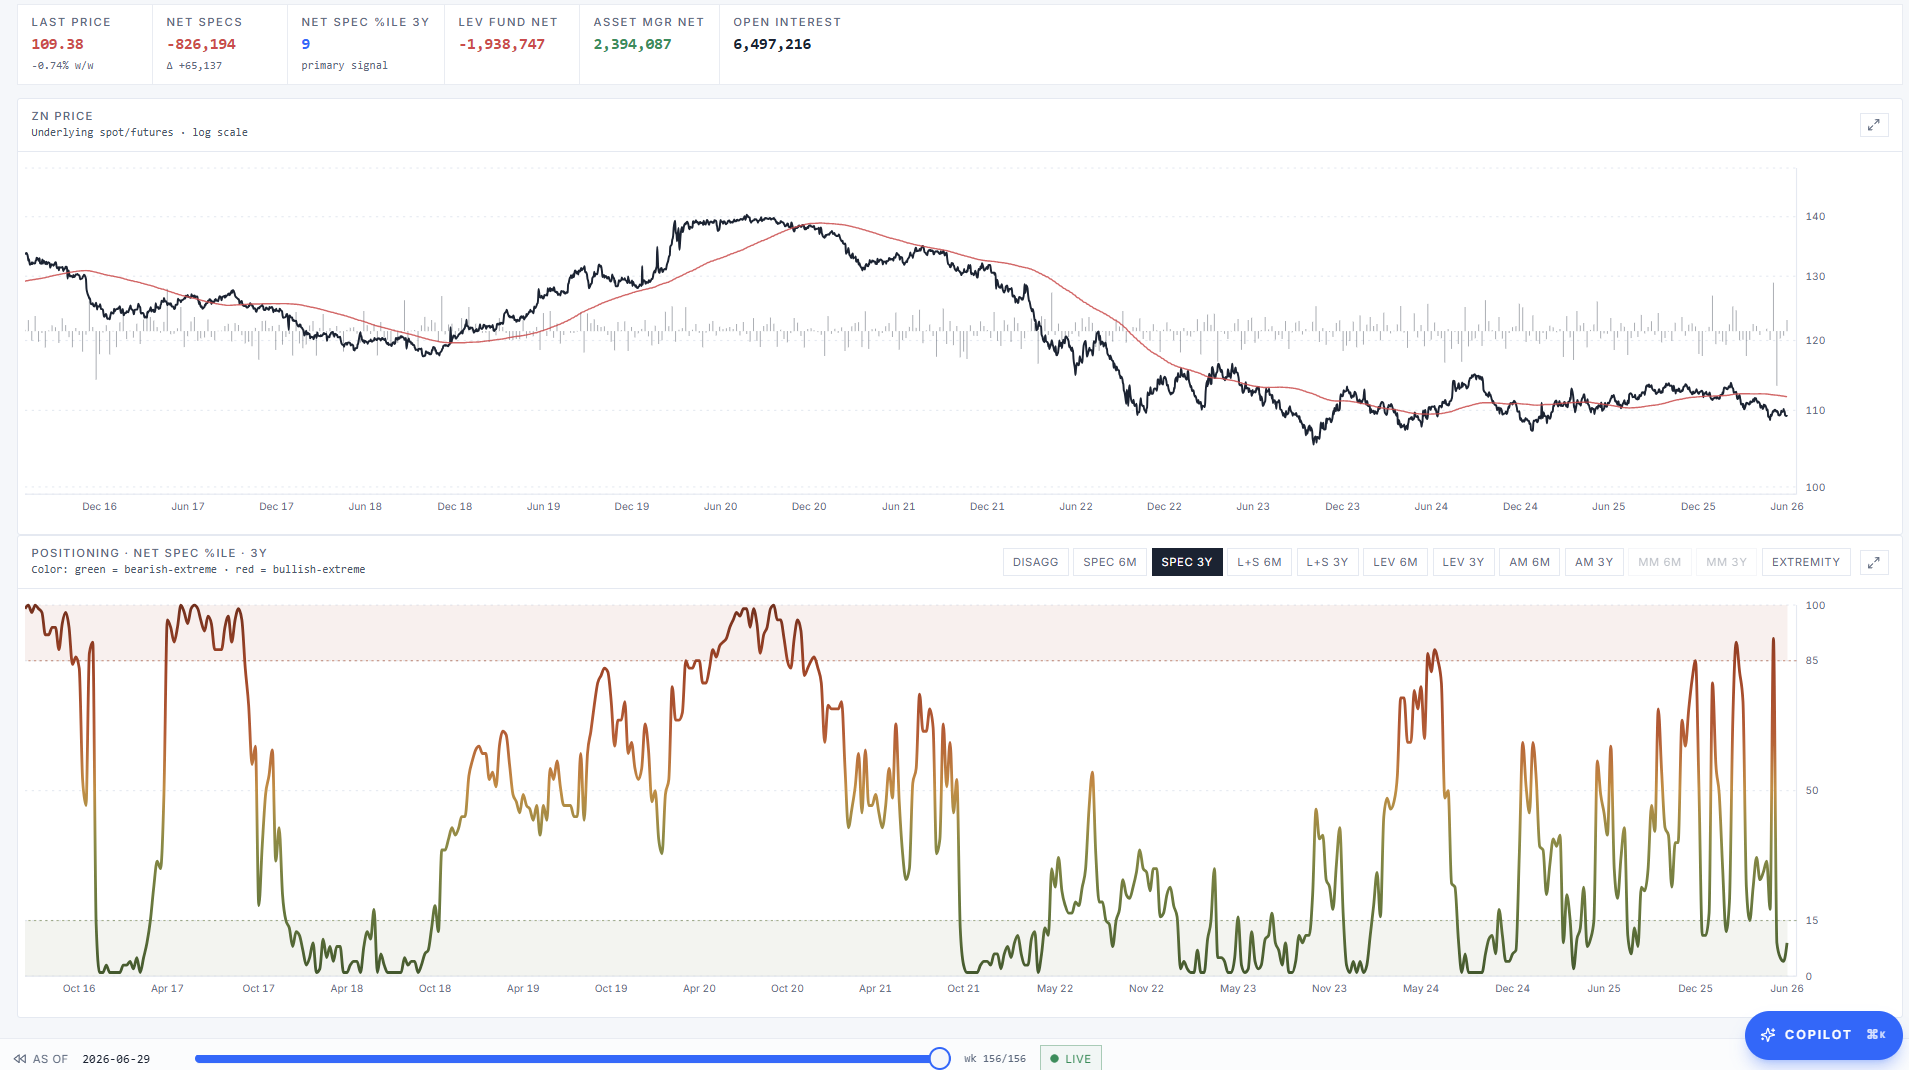
4. I’m watching to see what 10s can do here. I’m willing to play a tactical long on a breakout above this range.
5. The DXY has so far held its breakout (chart below is a weekly).
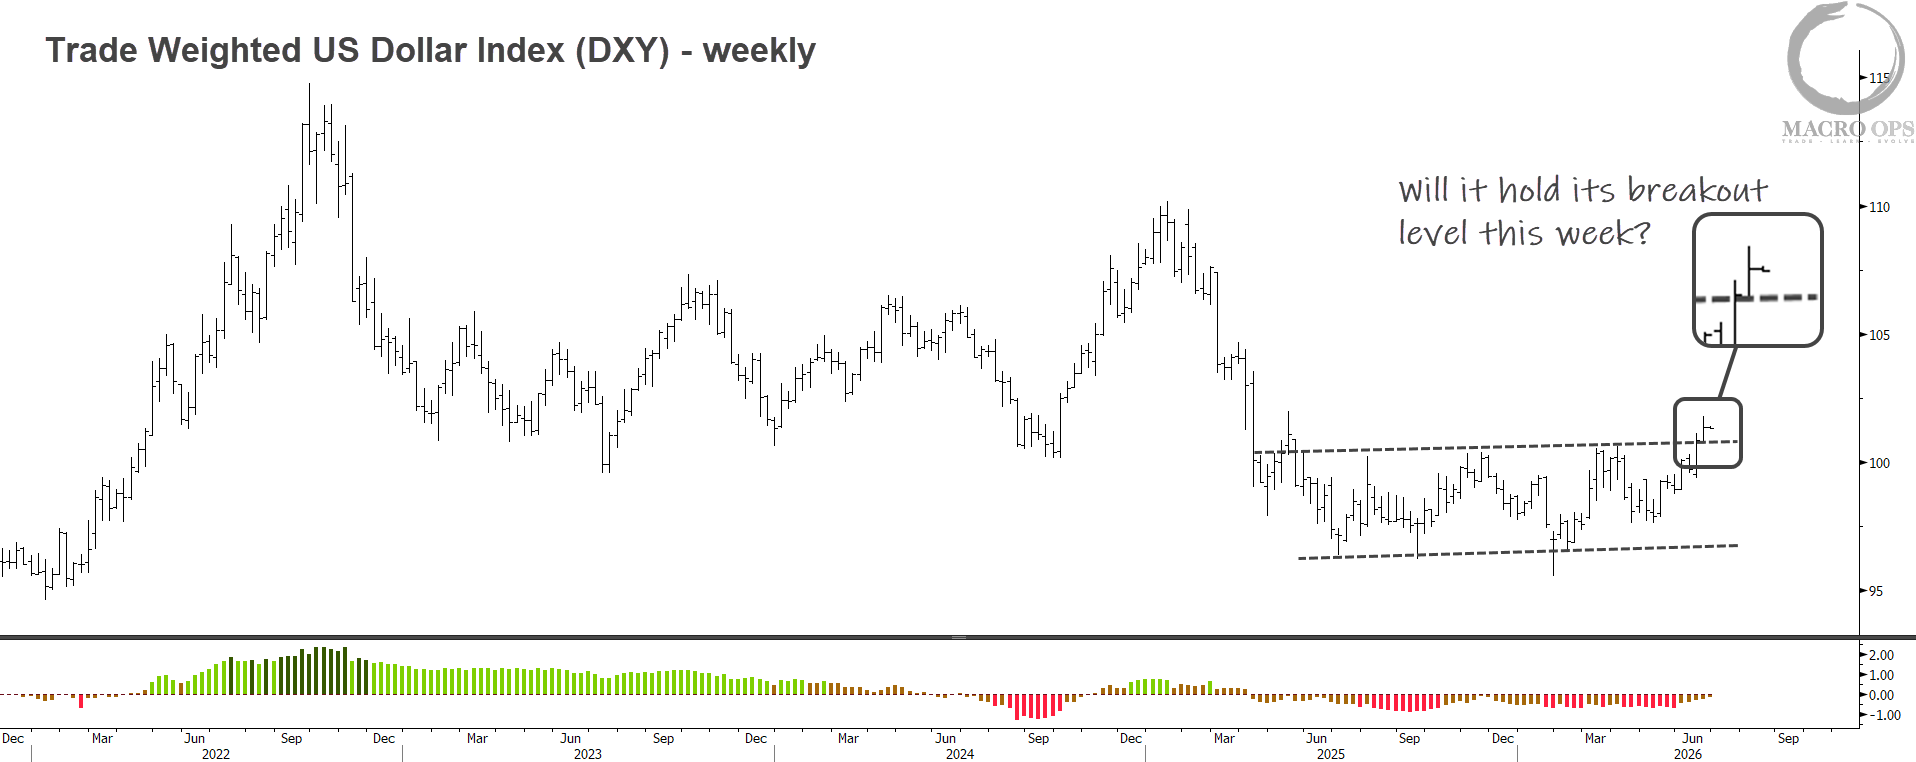
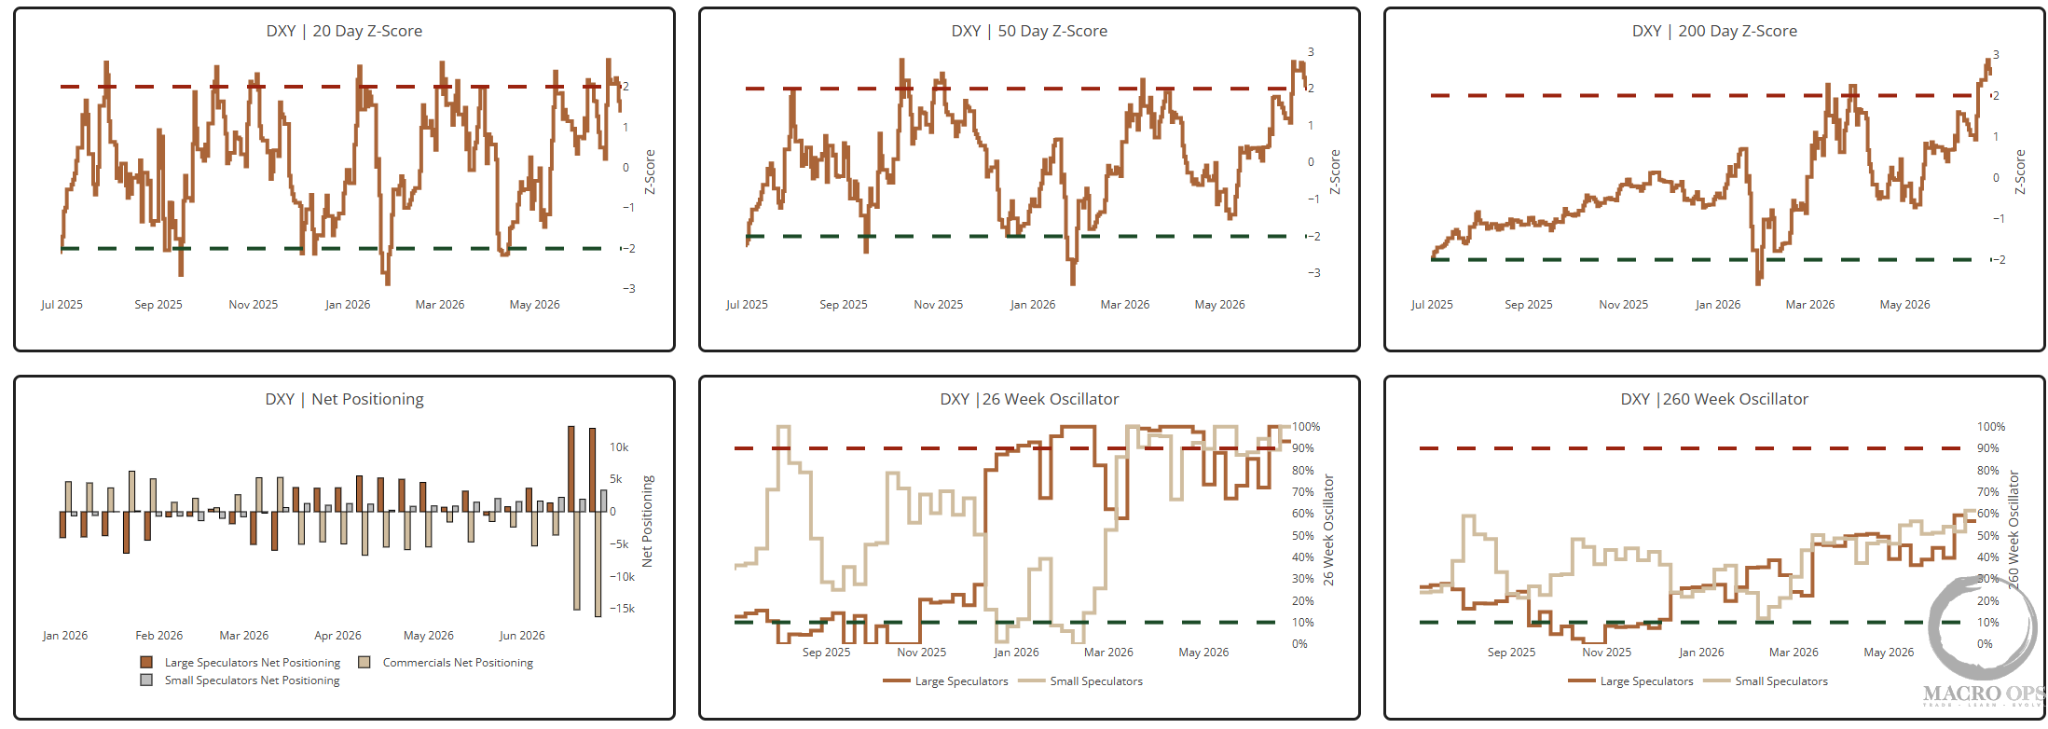
6. It’s now around 2std overbought across all-three timeframes, while short-term positioning is elevated. The next two weeks will be the tell in whether DXY can hold and consolidate these gains, or this turns into a major bull trap. The answer will have significant implications across assets (ie, commodities, EM, growth, etc…). We are long.
7. If you’re of the mind that DXY is setting up a bull trap, then long GBP offers a nice trade It’s at the bottom of its 15-month+ sideways range/compression regime.
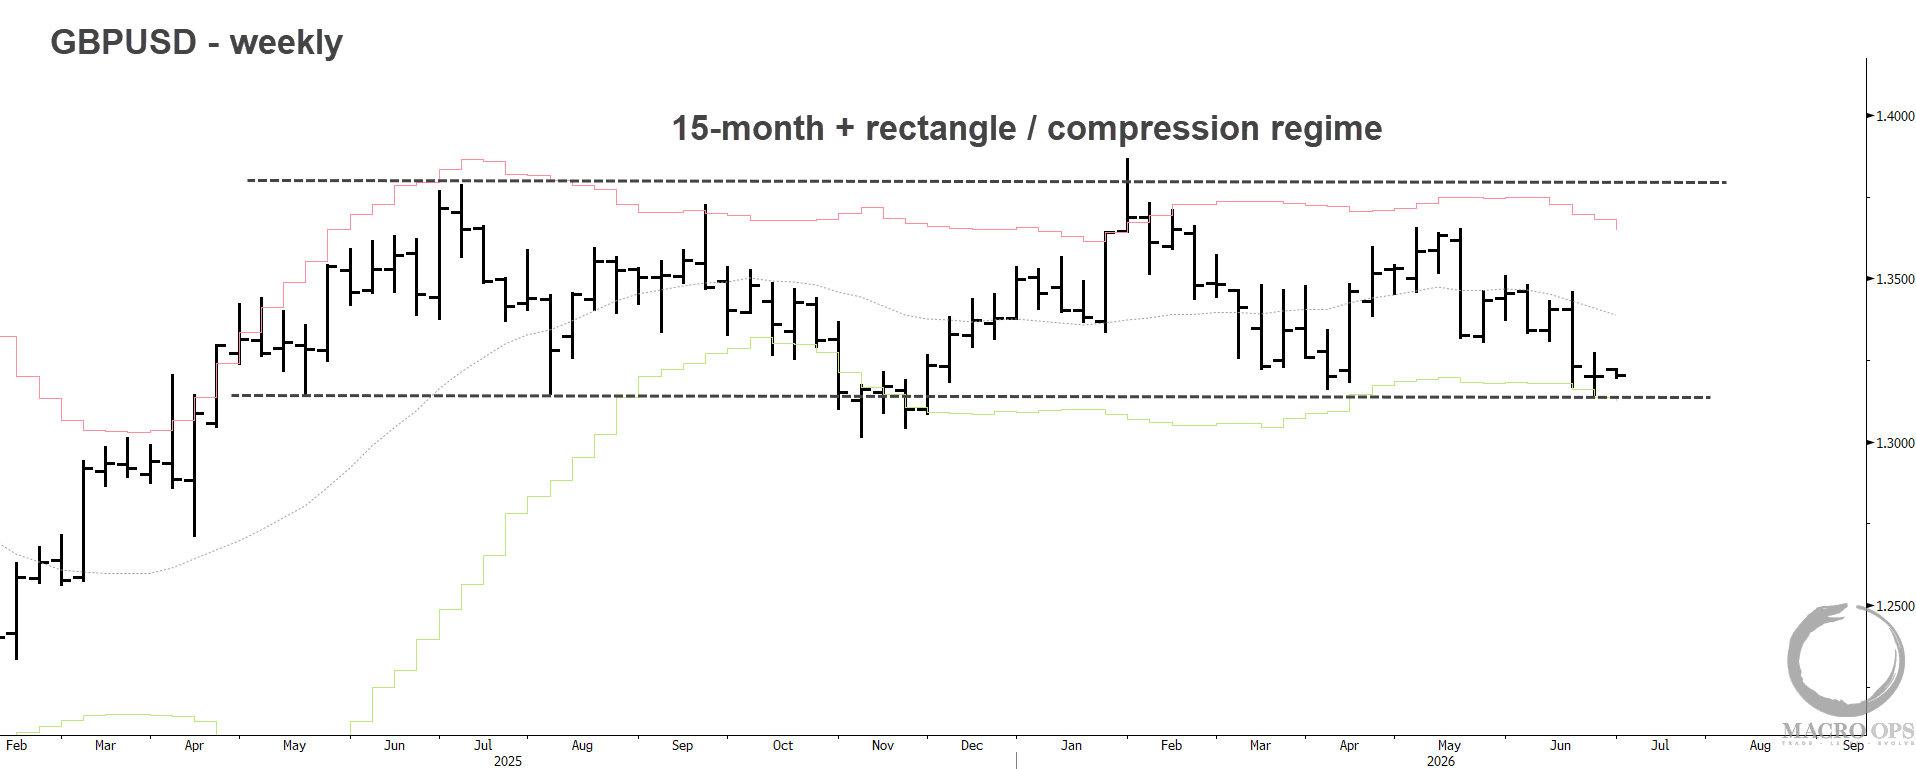
8. Our Spec oscillators on both a 6m and 3y basis are in the 4th and 1st percentiles, respectively.
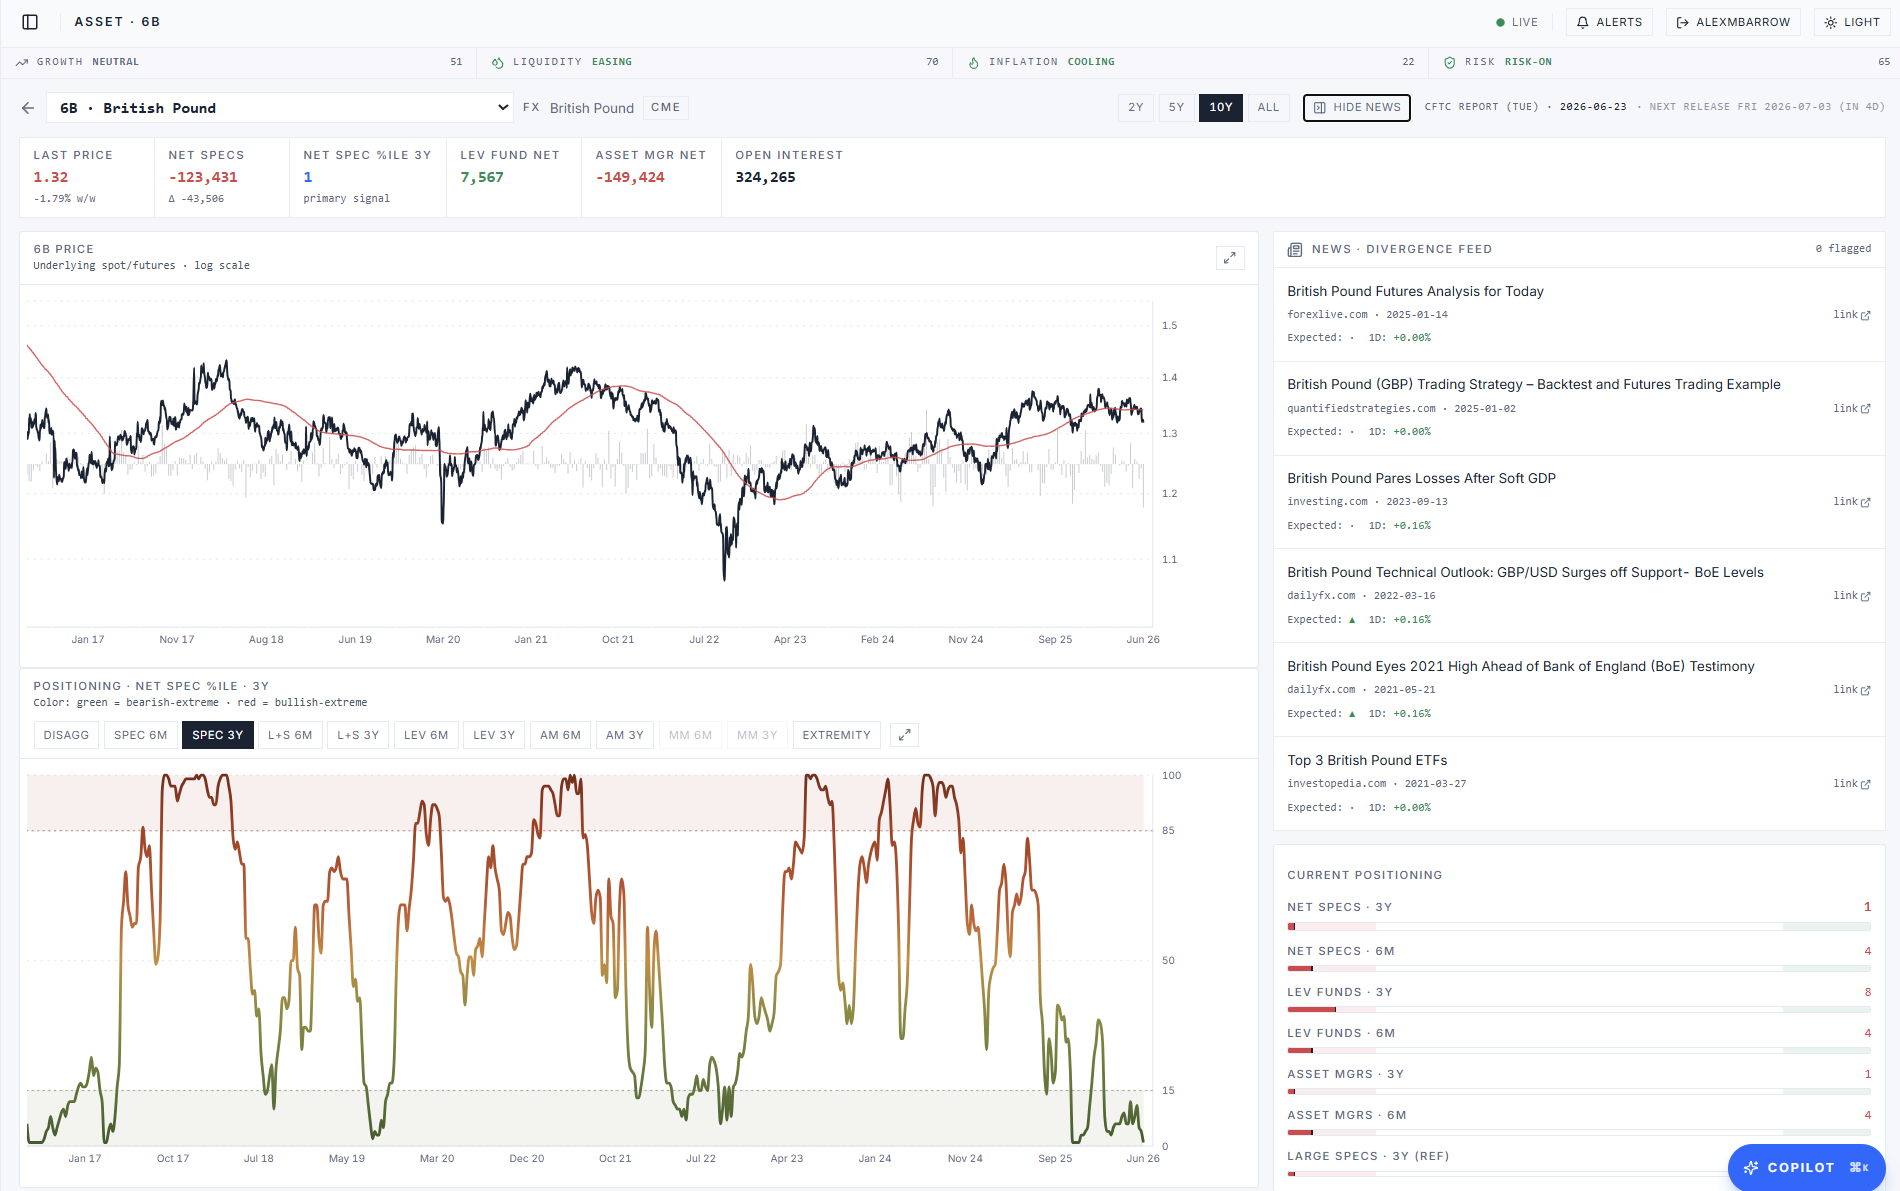
9. In fact, Commercials are holding their most crowded long positioning in history. The last two times Commercials were even remotely this long it marked a significant bottom in the pound.
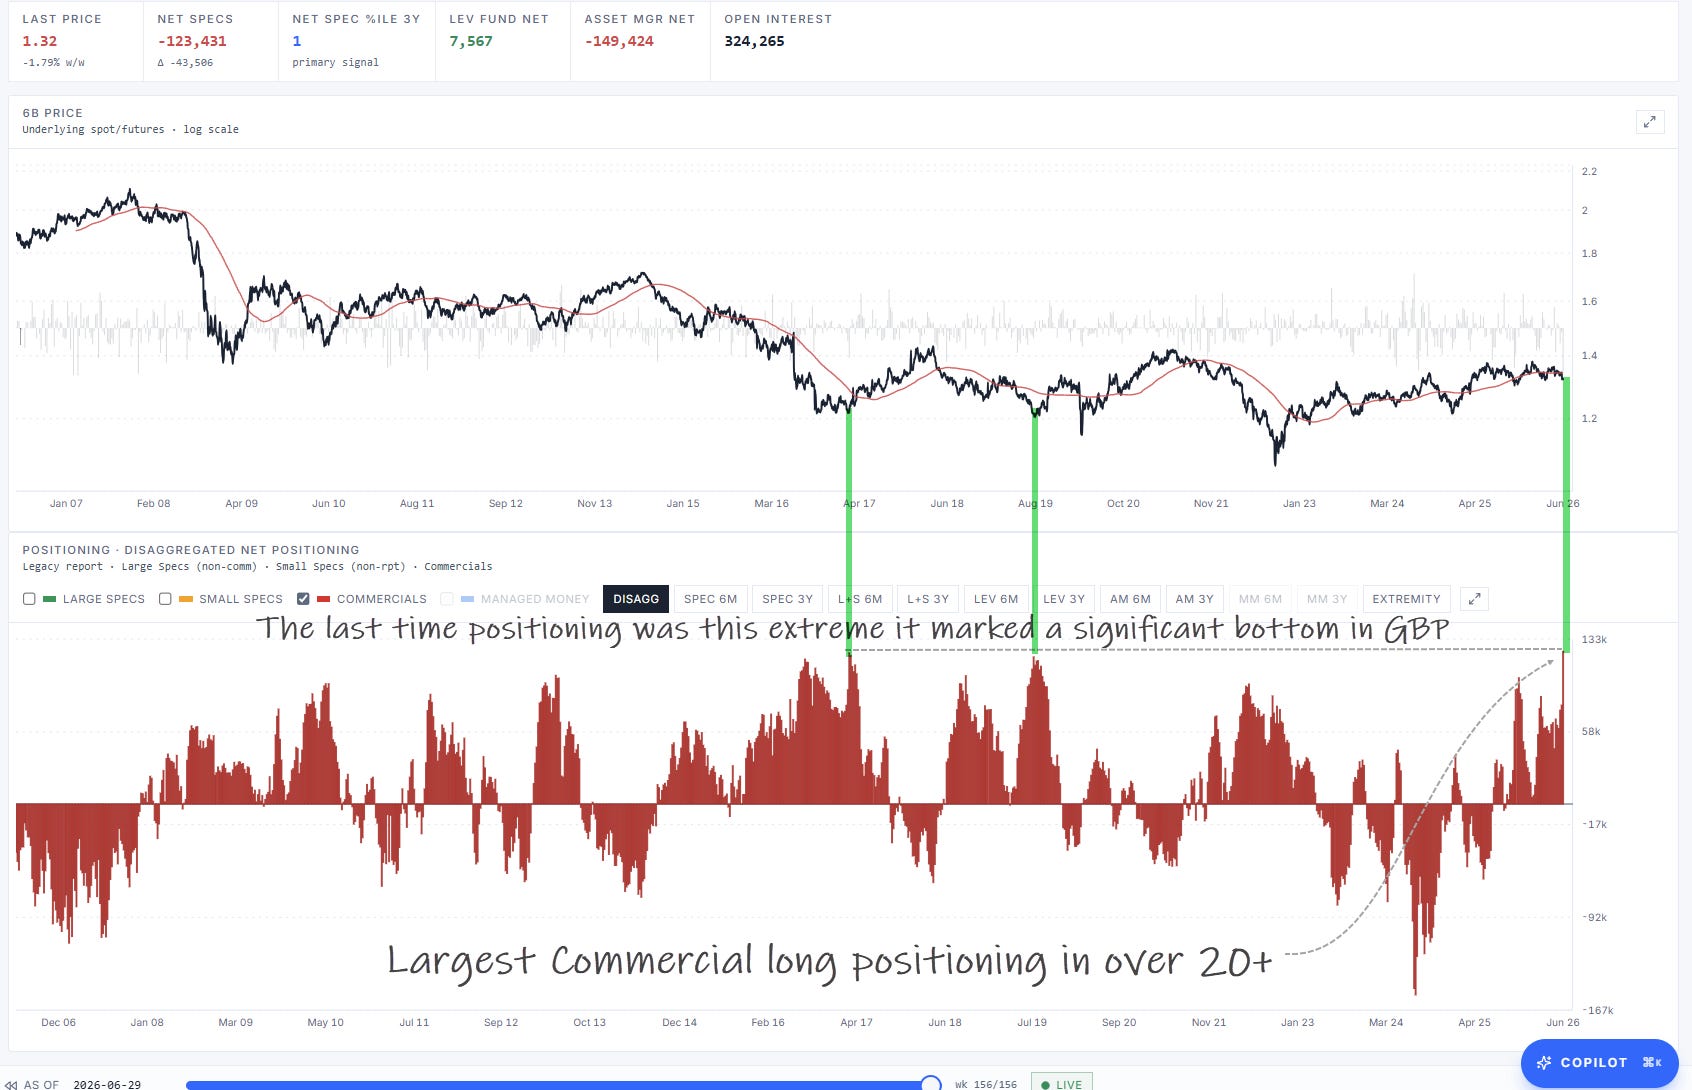
10. Our HUD multi-chart page shows that GBP is basically the inverse of DXY right now. It’s roughly 2std oversold across all three timeframes. Seasonality flips positive one week from now. But… yield spread momentum remains low and we’d want to see that flip in order for long GBP to have prospects of more than just a small mean reversion positioning fade.
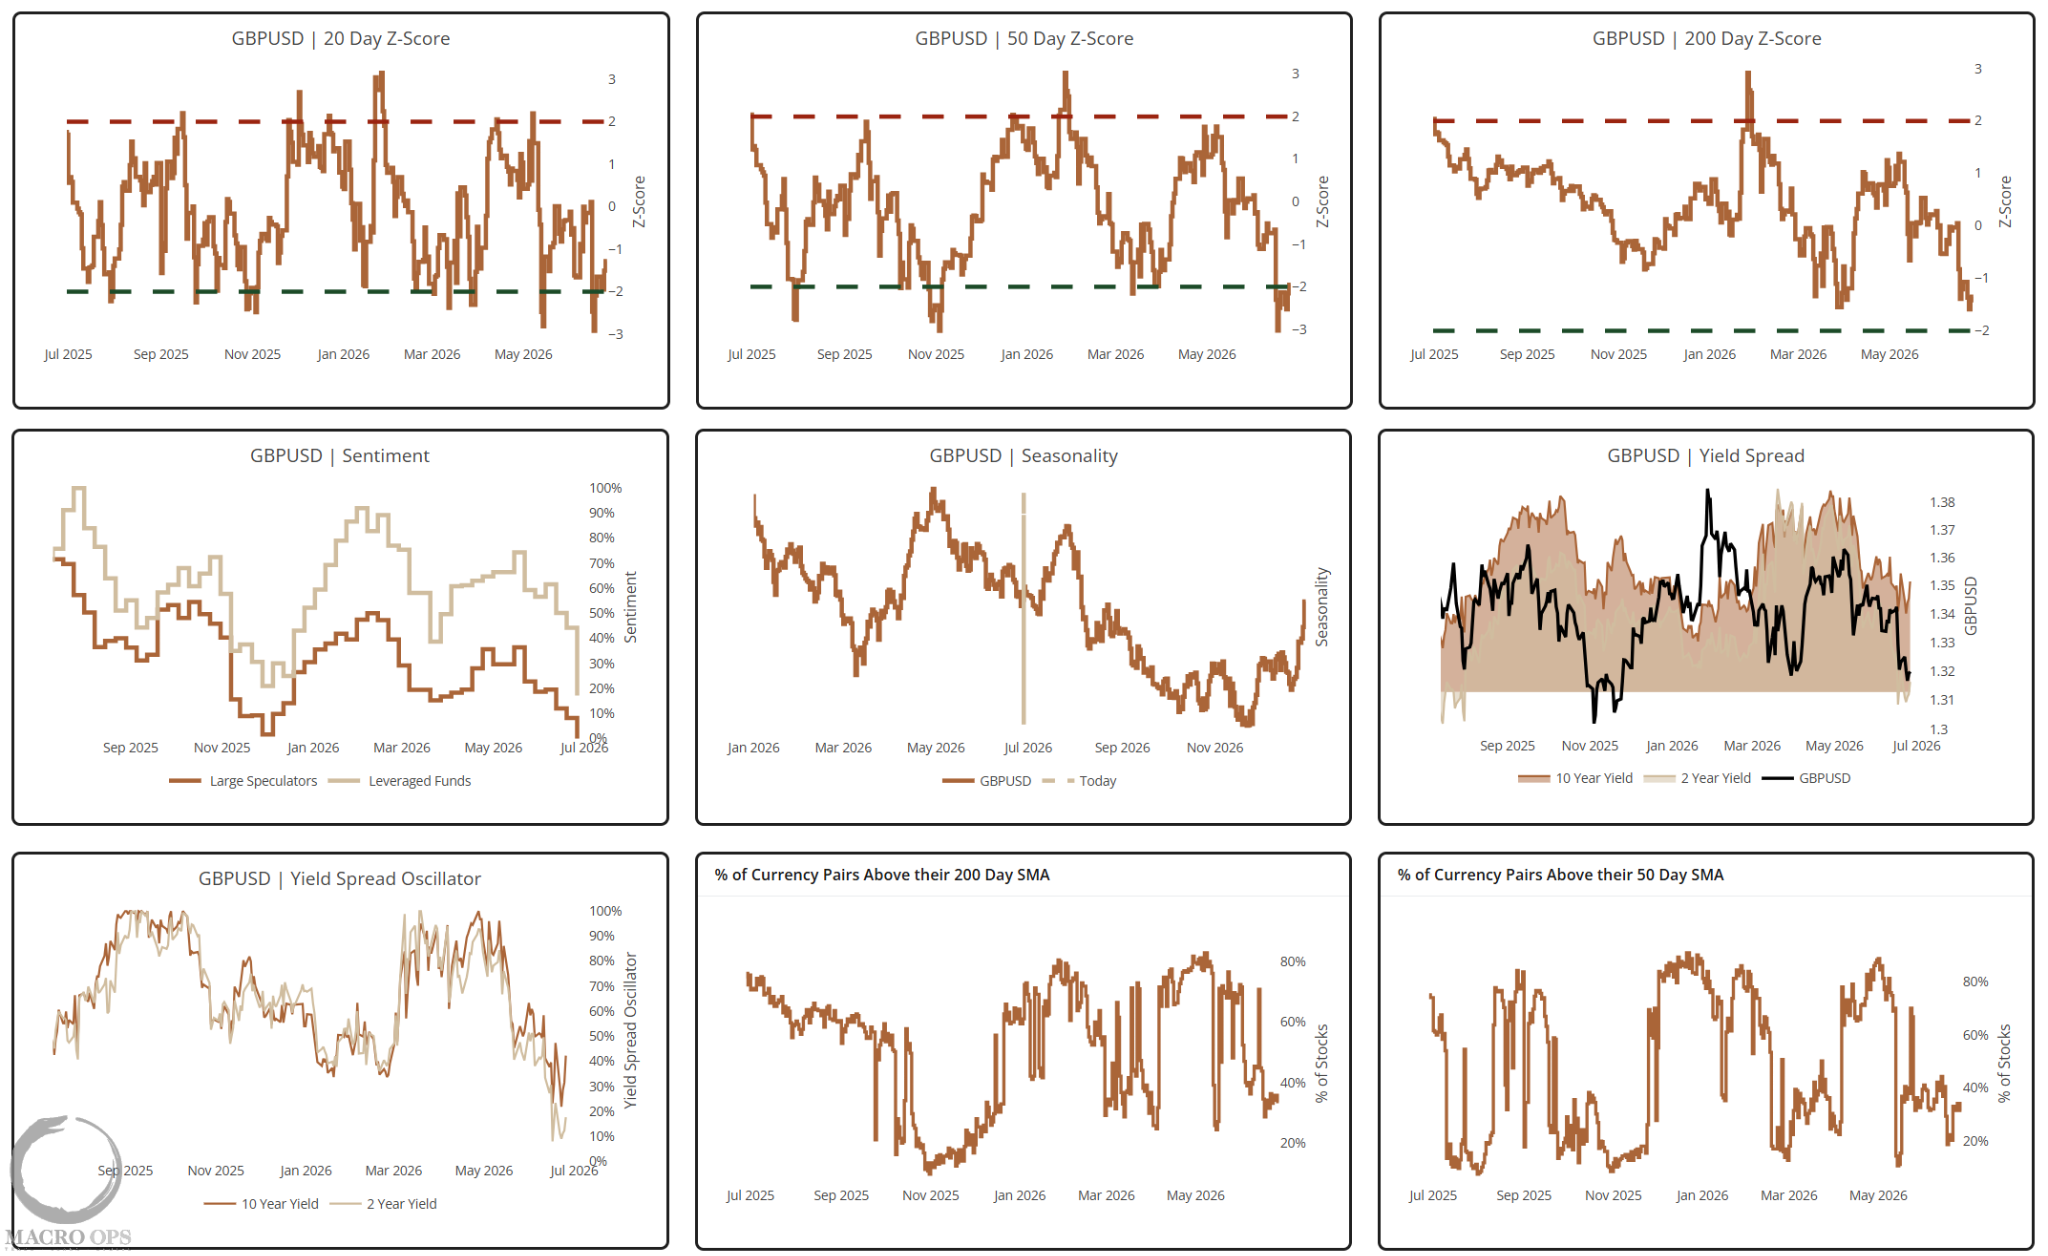
11. This is a pretty incredible relative flows chart from SG.
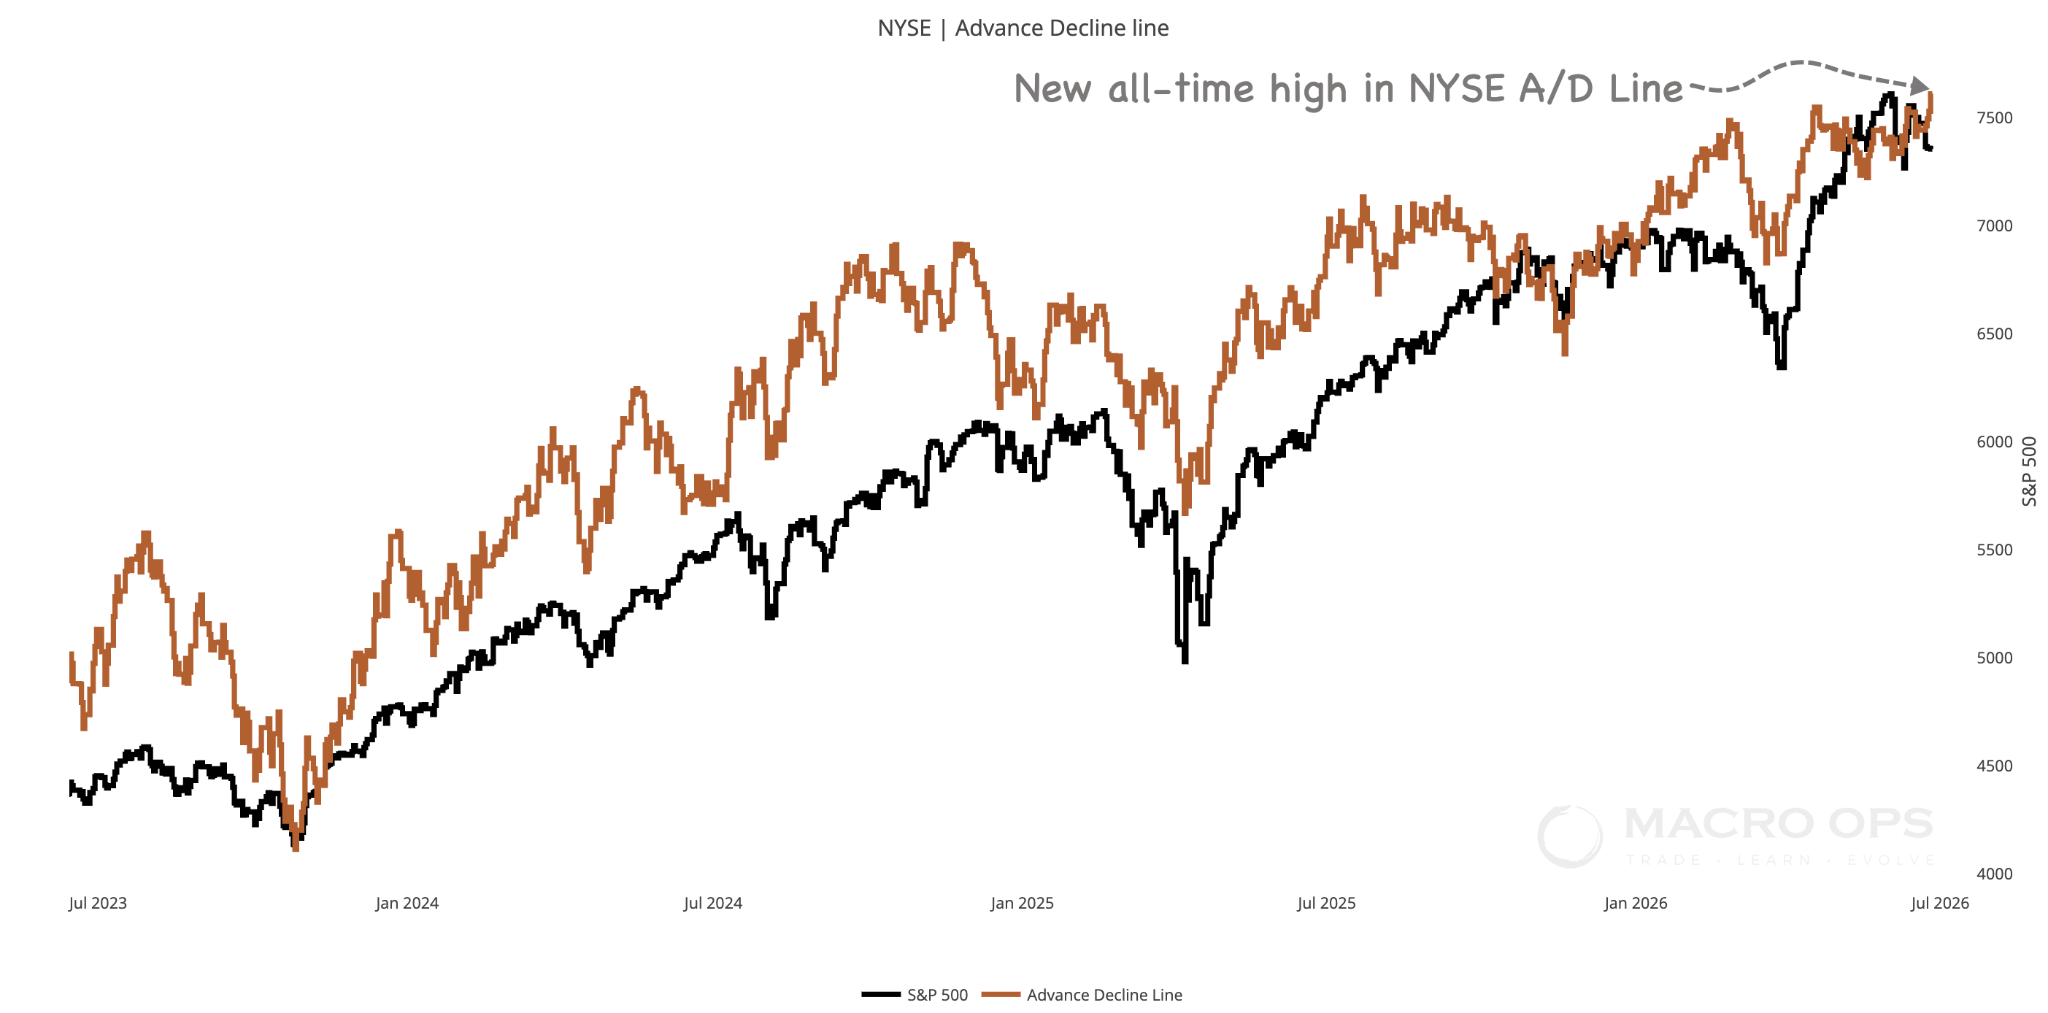
12. NYSE A/D Line (in amber) hit a new all-time high last Friday, positively diverging from the index, which typically is not a bearish development.
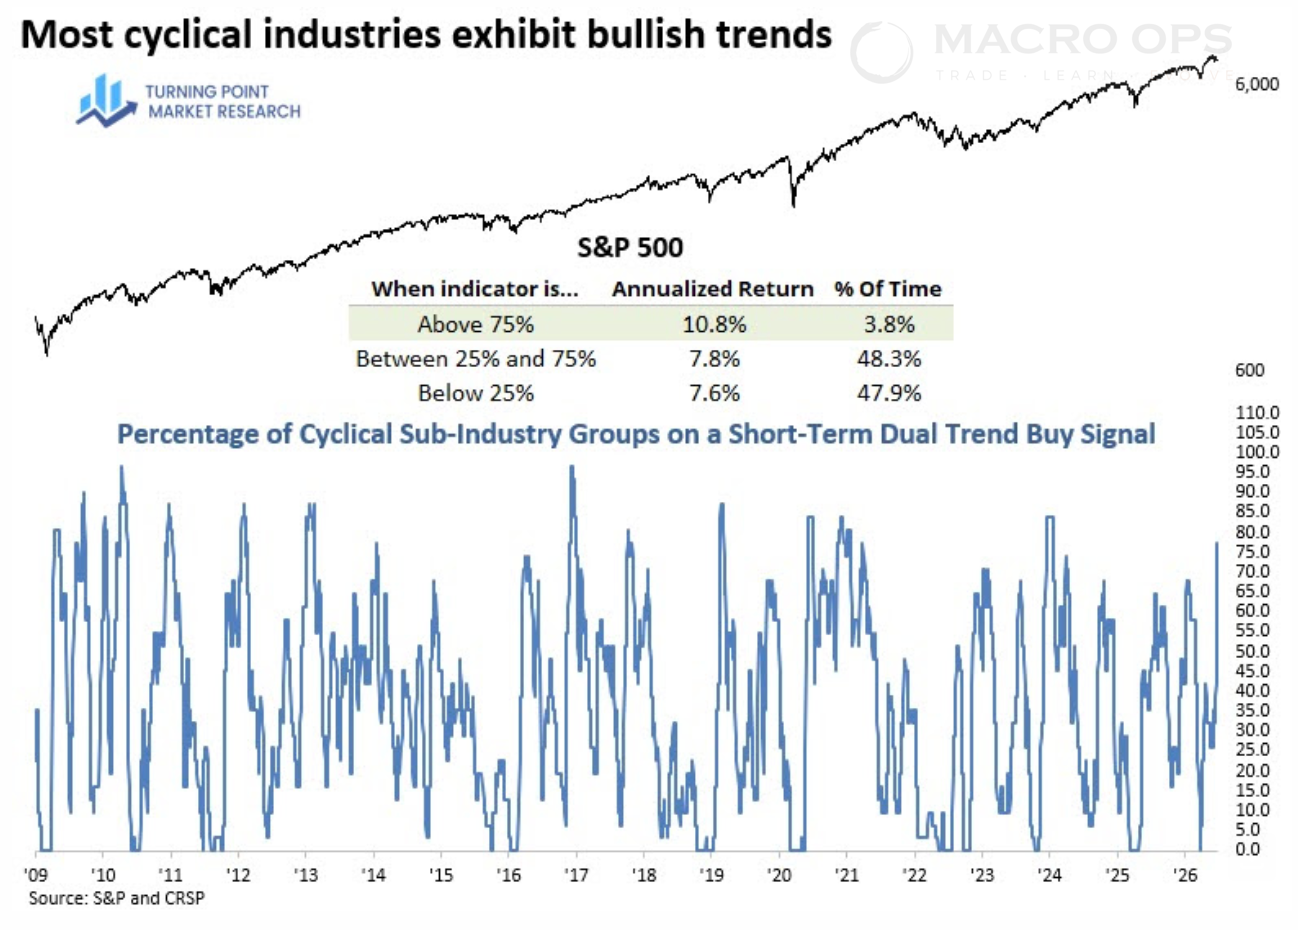
13. And our friend Dean Christian’s over at TPMR shared this study last week showing that over 75% of cyclical subindustries are in bullish trends on both short and long-term measures. Going all the way back to the 60s, this has occurred only 3.8% of the time, and the SPX has historically seen annualized returns of +10.8%.
14. The path of least resistance remains up. That’s what the weight of the evidence (breadth, internals, technicals) tell us. However, we expect the trend to be more volatile going forward, with frequent positioning induced air pockets. Our resident vol trader, Tony, shared some great stuff on this very topic in this week’s Vol Street Journal. I highly recommend giving it a watch. Here’s some of his summary notes:
This week’s episode examines a series of shifting conditions across my proprietary market models, volatility complex, currency, and credit markets that point to growing market vulnerability. I break down the developments and explain why the risk environment has changed.
Proprietary Models: Both models have been flashing warning signs for weeks, and Friday sent the EWS model to its highest, most cautionary level since the early days of the Iran conflict.
VIX Futures: The front of the futures curve is flattening as spot VIX tightens its gap to the July contract and the July-August spread compresses.
Chronic Undervixing: Realized volatility continues to climb while implied volatility lags, squeezing the variance risk premium as individual stock volatilities rise.
Positioning Dynamics: Speculators are heavily long the Dow and strongly bought the S&P dip, alongside crowded long positions in the US Dollar and short positions in major cross currencies.
Credit Market Stress: High-yield and investment-grade spreads are beginning to widen from very tight levels as capital rotates toward Treasuries and equities start to follow high yield bonds lower.
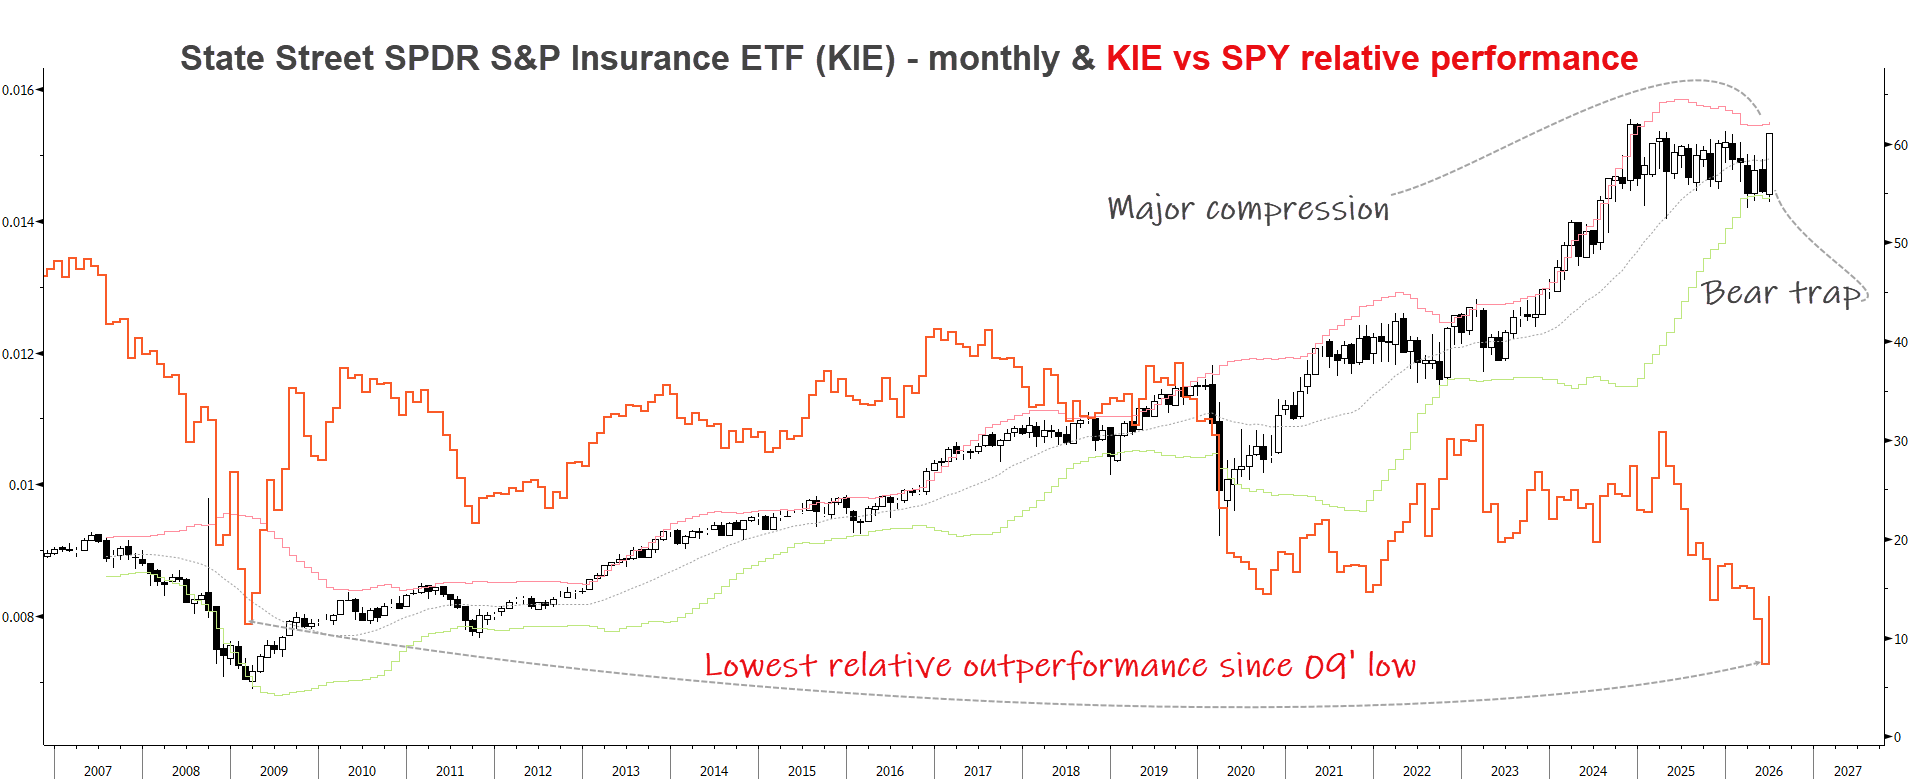
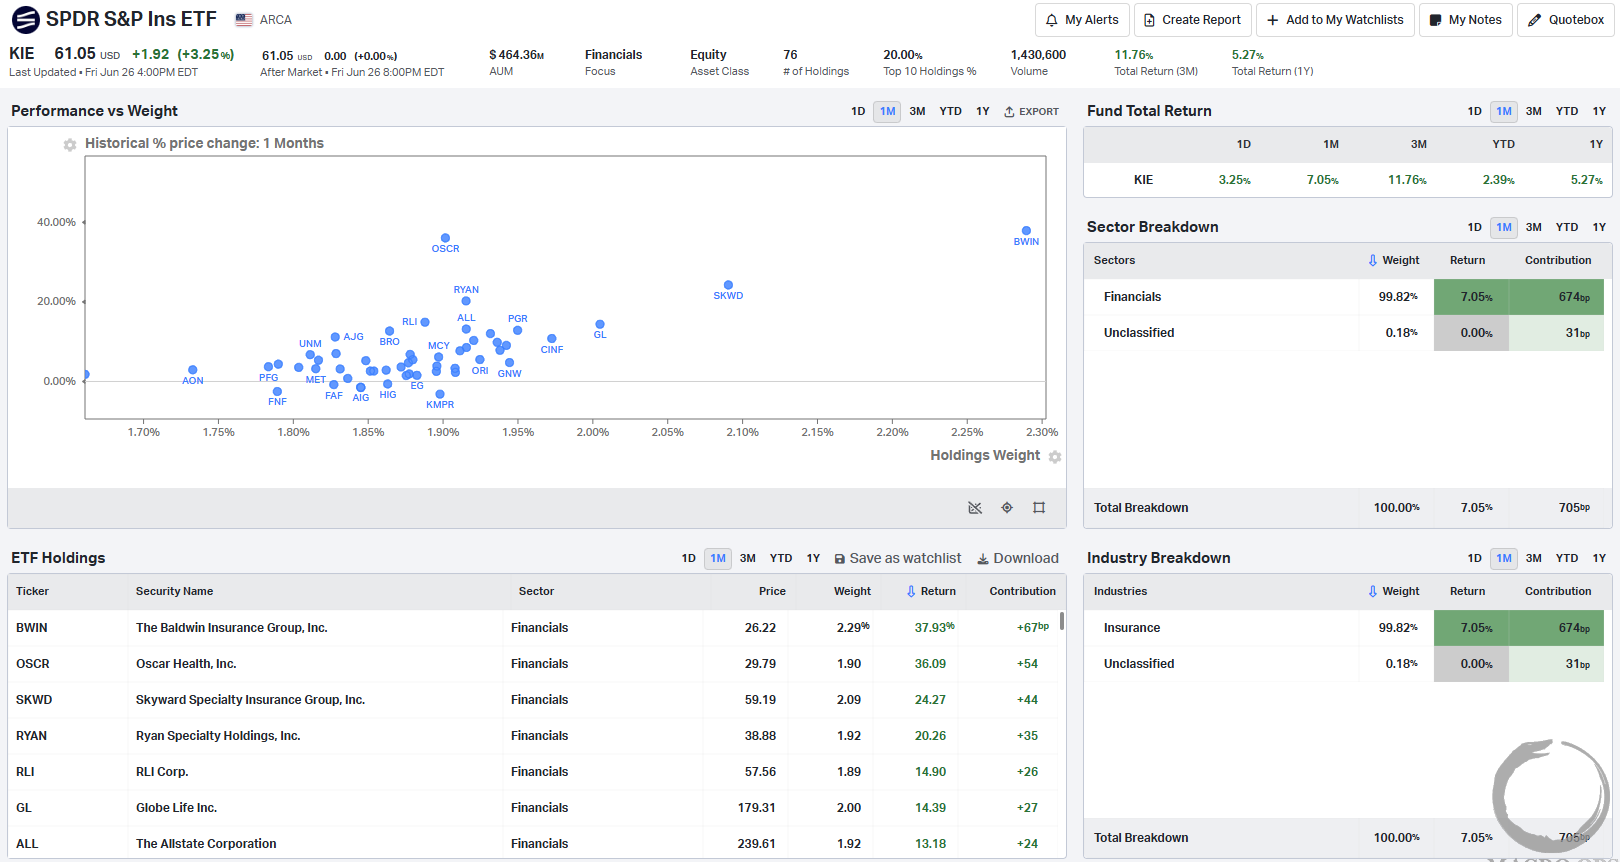
15. Been tracking this one for a while now and it looks like it’s finally tee’d up. The SPDR Insurance ETF (KIE) has put in a bear trap reversal within a major compression regime on the monthly. Its relative performance versus the SPX is coming off all-time lows, even below levels hit during the 09’ bottom. We will likely be getting long this ETF along with some select names.
16. Here’s the Koyfin holdings breakdown for it. The top 1-month performing names are BWIN, OSCR, SKWD, and RYAN. OSCR is my current favorite.
Thanks for reading.
Your Macro Operator,
Alex